This chapter describes different components, that correspond to respective sections of a config to launch VictoriaMetrics Anomaly Detection (or simply
vmanomaly
service:
- Model(s) section - Required
- Reader section - Required
- Scheduler(s) section - Required
- Writer section - Required
- Monitoring section - Optional
- Settings section - Optional
- Server section - Optional
Once the service starts, automated config validation is performed Available from v1.7.2 . Please see container logs for errors that need to be fixed to create fully valid config, visiting sections above for examples and documentation.
Components’ class
Available from v1.13.0
can be referenced by a short alias instead of a full class path - i.e. model.zscore.ZscoreModel becomes zscore, reader.vm.VmReader becomes vm, scheduler.periodic.PeriodicScheduler becomes periodic, etc. Please see according sections for the details.
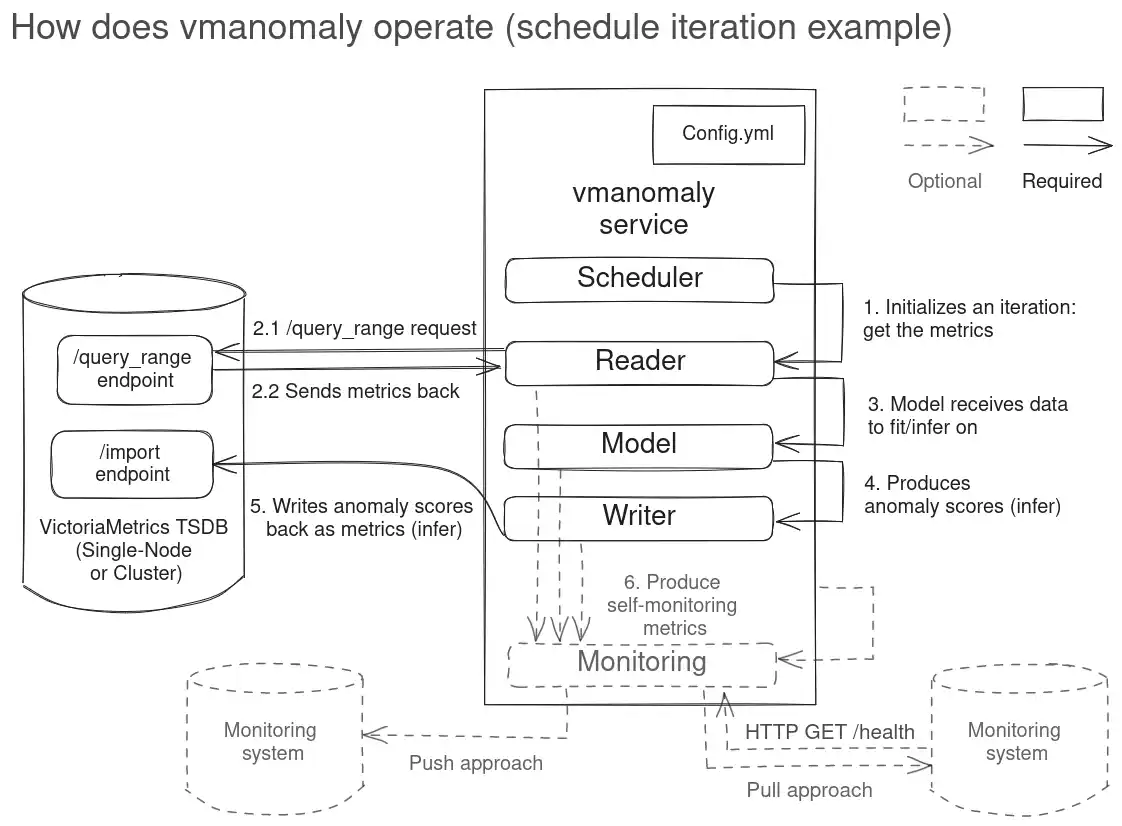
Components interaction #
Below, you will find an example illustrating how the components of vmanomaly interact with each other and with a VictoriaMetrics or VictoriaLogs/VictoriaTraces datasource.
Reader
and
Writer
also support
multitenancy
, so you can read/write from/to different locations - see tenant_id param description.
Example config #
Here’s a minimalistic full config example, demonstrating many-to-many configuration (actual for latest version ):
      settings:
  n_workers: 4  # number of workers to run models in parallel
  anomaly_score_outside_data_range: 5.0  # default anomaly score for anomalies outside expected data range
  restore_state: True  # restore state from previous run, if available
  retention:  # how long to keep stale models on disk/in memory
    ttl: "1d"  # time-to-live duration, if the model was not used for inference within this duration, it will be considered stale
    check_interval: "1h"  # how often to check for stale models and remove them

# how and when to run the models is defined by schedulers
# https://docs.victoriametrics.com/anomaly-detection/components/scheduler/
schedulers:
  periodic_online:  # alias
    class: 'periodic' # scheduler class
    infer_every: "30s"  # how often to produce anomaly scores for new data
    fit_every: "365d"  # how often to re-fit the models, for online models used effectively once, then they are updated with new data and won't require re-fit
    fit_window: "3d"  # how much historical data to use for fit stage
    start_from: "00:00"  # start from specified time, i.e. 00:00 given timezone and do daily fits as `fit_every` is 1 day
    tz: "Europe/Kyiv"  # timezone to use for start_from
  periodic_offline_1w:
    class: 'periodic'
    infer_every: "15m"
    fit_every: "24h"
    fit_window: "14d"
    # if no start_from is specified, jobs will start immediately after service starts

# what model types and with what hyperparams to run on your data
# https://docs.victoriametrics.com/anomaly-detection/components/models/
models:
  zscore:  # we can set up alias for model
    class: 'zscore_online'  # model class
    z_threshold: 3.5
    decay: 0.99  # weight for data points value should be in (0, 1], 1 means to give equal weight to all data
    provide_series: ['anomaly_score', 'y', 'yhat', 'yhat_upper']  # what series to produce as output of the model
    queries: ['host_network_receive_errors']  # what queries to run particular model on
    schedulers: ['periodic_online']  # will be fit once, used for infer every 30s
    min_dev_from_expected: 0.0  # turned off. if |y - yhat| < min_dev_from_expected, anomaly score will be 0
    detection_direction: 'above_expected' # detect anomalies only when y > yhat, "peaks"
    clip_predictions: True  # clip predictions to expected data range, i.e. [0, inf] for this query `host_network_receive_errors
  prophet_weekly: # we can set up alias for model
    class: 'prophet'
    provide_series: ['anomaly_score', 'y', 'yhat', 'yhat_lower', 'yhat_upper']
    queries: ['cpu_seconds_total']
    schedulers: ['periodic_offline_1w']  # will be attached to 1-week scheduler, re-fit every 24h and infer every 15m
    min_dev_from_expected: [0.01, 0.01]  # minimum deviation from expected value to be even considered as anomaly
    anomaly_score_outside_data_range: 1.5  # override default anomaly score outside expected data range
    detection_direction: 'above_expected'
    clip_predictions: True  # clip predictions to expected data range, i.e. [0, inf] for this query `cpu_seconds_total`
    args:  # model-specific arguments
      interval_width: 0.98
      yearly_seasonality: False  # disable yearly seasonality, since we have only 7 days of data

# where to read data from
# https://docs.victoriametrics.com/anomaly-detection/components/reader/#vm-reader
reader:
  class: 'vm'
  datasource_url: "https://play.victoriametrics.com/"
  tenant_id: "0:0"
  sampling_period: "30s"  # what data resolution to fetch from VictoriaMetrics' /query_range endpoint
  latency_offset: '1ms'
  query_from_last_seen_timestamp: False
  tz: "UTC"  # timezone to use for queries without explicit timezone
  "offset": "0s"  # offset to apply to all queries, e.g. to account for data delays, can be overridden on per-query basis
  queries:  # aliases to MetricsQL expressions
    cpu_seconds_total:
      expr: 'avg(rate(node_cpu_seconds_total[5m])) by (mode)'
      # step: '30s'  # if not set, will be equal to reader-level sampling_period
      data_range: [0, 'inf']  # expected value range, anomaly_score = anomaly_score_outside_data_range if y (real value) is outside
    host_network_receive_errors:
      expr: 'rate(node_network_receive_errs_total[3m]) / rate(node_network_receive_packets_total[3m])'
      step: '15m'  # here we override per-query `sampling_period` to request way less data from VM TSDB
      data_range: [0, 'inf']

# where to write data to
# https://docs.victoriametrics.com/anomaly-detection/components/writer/
writer:
  datasource_url: "http://victoriametrics:8428/"
  # tenant_id: "0:0"  # for VictoriaMetrics cluster, can support "multitenant"
  # https://docs.victoriametrics.com/anomaly-detection/components/writer/#metrics-formatting
  metric_format:
    __name__: $VAR
    for: $QUERY_KEY


# enable self-monitoring in pull and/or push mode
# https://docs.victoriametrics.com/anomaly-detection/components/monitoring/
monitoring:
  # pull: # Enable /metrics endpoint.
  #   addr: "0.0.0.0"
  #   port: 8490

  push: # Enable pushing self-monitoring metrics
    url: "http://victoriametrics:8428"
    push_frequency: "15m"  # how often to push self-monitoring metrics

# configure vmanomaly server and UI settings
# https://docs.victoriametrics.com/anomaly-detection/components/server/
server:
  port: 8490
  path_prefix: '/vmanomaly'  # optional path prefix for all HTTP routes
  max_concurrent_tasks: 4  # maximum number of concurrent anomaly detection tasks processed by backend
  uvicorn_config:  # optional Uvicorn server configuration
    log_level: 'warning'
Hot reload #
This feature is better used in conjunction with stateful service to preserve the state of the models and schedulers between restarts and reuse what can be reused, thus avoiding unnecessary re-training of models, re-initialization of schedulers and re-reading of data.
Available from v1.25.0
Service supports hot reload of configuration files, which allows for automatic reloading of configurations on config files change without the need of explicit service restart. This can be enabled via the --watch
CLI argument
. vmanomaly_config_reload_enabled flag in
self-monitoring metrics
will be set to 1 (if enabled) or 0 (if disabled).
Deprecated from v1.29.5
File system event-based hot reload has been deprecated in favor of content-based polling with configurable -configCheckInterval due to reliability issues with Kubernetes ConfigMap symlink rotations and other filesystems where event delivery can be inconsistent. If you were using file system event-based hot reload, please switch to content-based polling by enabling --watch flag and configuring -configCheckInterval as needed.
How it works #
It works by checking watched .yml|.yaml file contents in the specified files or directories on the configured interval -configCheckInterval (default is 30s)
Available from v1.29.5
. When a content change is detected, the service will attempt to reload the configuration files after the existing debounce window, rebuild the
global config
and reinitialize the components. If the reload is successful, the vmanomaly_config_reloads_total metric will be incremented for status="success" label, otherwise it will be incremented with status="failure" label and a respective error message on config validation failure(s) will be logged.
If the reload fails, the service will log an error message indicating the reason for the failure, and the previous configuration will remain active until a successful reload occurs to preserve the service’s stability. This means that if there are errors in the new configuration, the service will continue to operate with the last valid configuration until the issues are resolved.
If used on sharded setup , upon global config change, all shards will be reinitialized with the new configurations.
Please note, that even if state restoration is enabled, the models, queries and schedulers might “migrate” to new shards if the order or the amount of sub-configs changes after new config is hot-reloaded, so the state restoration won’t be fully efficient in this case.
Example #
For simplicity, let a service be run on a config file named config.yaml with the following content:
      settings:
  n_workers: 4  # number of workers to run models in parallel
  anomaly_score_outside_data_range: 5.0  # default anomaly score for anomalies outside expected data range
  restore_state: True  # restore state from previous run, if available

schedulers:
  periodic:
    class: 'periodic'
    infer_every: "30s"
    fit_every: "365d"
    fit_window: "24h"

reader:
  datasource_url: "https://play.victoriametrics.com/"
  tenant_id: "0:0"
  class: 'vm'
  sampling_period: "30s"
  queries:
    cpu_seconds_total:
      expr: 'avg(rate(node_cpu_seconds_total[5m])) by (mode)'
      data_range: [0, 'inf']
      # step: '30s'  # if not set, will be equal to reader-level sampling_period
    host_network_receive_errors:
      expr: 'rate(node_network_receive_errs_total[3m]) / rate(node_network_receive_packets_total[3m])'
      step: '15s'
      data_range: [0, 'inf']

models:
  zscore:
    class: 'zscore_online'
    z_threshold: 3.5
    decay: 0.99  # gives more weight to recent data points, value should be in (0, 1], 1 means to give equal weight to all data
    provide_series: ['anomaly_score']
    # if queries are not specified, all queries from reader will be used
    # if schedulers are not specified, all schedulers will be used

writer:
  datasource_url: "http://victoriametrics:8428/"

monitoring:
  push:
    url: "http://victoriametrics:8428"
    push_frequency: "15m"
Suppose after 15m since service startup, there was a change to the query expression and frequency for node_cpu_seconds_total query in reader.queries:
      # ... (rest of the config remains unchanged)
reader:
  # ... (rest of the reader config remains unchanged)
  queries:
    cpu_seconds_total:
      expr: 'avg(rate(node_cpu_seconds_total[10m])) by (mode)'  # changed lookback period
      data_range: [0, 'inf']
      step: '60s'  # changed step
# ... (rest of the config remains unchanged)
After saving the changes, hot reload will automatically detect the changes in config.yaml and attempt to reload the configuration. As the changes are valid, the service will log a success message and increment the vmanomaly_config_reloads_total metric with status="success" label:
- All the model instances of class
zscore_online, that were trained onhost_network_receive_errorscan be reused as they are still valid and “fresh” for making inference on new datapoints until the nextfit_everyhappens. - All the model instances of class
zscore_online, that were trained oncpu_seconds_totalwill be re-trained with the new query expression and frequency, as old model instances are not valid anymore.
Environment variables #
Available from v1.25.0
Environment variables can be referenced directly in the configuration files using scalar string placeholders %{ENV_NAME}. This allows for dynamic configuration based on environment variables, which is particularly useful for managing sensitive information like API keys or database credentials while still making it accessible to the service.
For example, VMANOMALY_URL environment variable can be set to http://localhost:8428 and then used in the configuration file in reader
section
as datasource_url: %{VMANOMALY_URL}.
If referenced environment variable is not set or there is a typo, the placeholder will not be replaced which may lead to errors during configuration validation or endpoints probing failure. It is recommended to ensure that all required environment variables are set before starting the service.
Example #
      reader:
  class: 'vm'
  datasource_url: %{VMANOMALY_URL}  # will be replaced with the value of VMANOMALY_URL environment variable
  tenant_id: %{VMANOMALY_TENANT_ID}  # will be replaced with the value of VMANOMALY_TENANT_ID environment variable
  bearer_token: %{VMANOMALY_BEARER_TOKEN}  # will be replaced with the value of VMANOMALY_BEARER_TOKEN environment variable
  sampling_period: "30s"

writer:
  datasource_url: %{VMANOMALY_URL}  # will be replaced with the value of VMANOMALY_URL environment variable
  tenant_id: %{VMANOMALY_TENANT_ID}  # will be replaced with the value of VMANOMALY_TENANT_ID environment variable
  bearer_token: %{VMANOMALY_BEARER_TOKEN}  # will be replaced with the value of VMANOMALY_BEARER_TOKEN environment variable

# other config sections ...