This section covers the Models component of VictoriaMetrics Anomaly Detection (commonly referred to as
vmanomaly
) and provides a guide on how to configure the service.
vmanomalyincludes various built-in models .- You can also integrate a custom model—see the custom model guide for more details.
- Models have different types and properties—refer to the model types section for more information.
Models can be dumped to disk Available from v1.13.0 instead of being stored in RAM. This option slightly reduces inference speed but significantly decreases RAM usage, particularly useful for larger setups. For more details, see the relevant FAQ section .
Model section in config supports multiple models via aliasing
Available from v1.10.0
.
Also, vmanomaly expects model section to be named models. Using old (flat) format with model key is deprecated and will be removed in future versions. Having model and models sections simultaneously in a config will result in only models being used:
      models:
  model_univariate_1:
    class: 'zscore' # or 'model.zscore.ZscoreModel' until v1.13.0
    z_threshold: 2.5
    queries: ['query_alias2']  # referencing queries defined in `reader` section
  model_multivariate_1:
    class: 'isolation_forest_multivariate'  # or model.isolation_forest.IsolationForestMultivariateModel until v1.13.0
    contamination: 'auto'
    args:
      n_estimators: 100
      # i.e. to assure reproducibility of produced results each time model is fit on the same input
      random_state: 42
    # if there is no explicit `queries` arg, then the model will be run on ALL queries found in reader section
# ...
Old-style configs (< 1.10.0 )
      model:
    class: "zscore"  # or 'model.zscore.ZscoreModel' until v1.13.0
    z_threshold: 3.0
    # no explicit `queries` arg is provided
# ...
will be implicitly converted to
      models:
  default_model:  # default model alias, backward compatibility
    class: "model.zscore.ZscoreModel"
    z_threshold: 3.0
    # queries arg is created and propagated with all query aliases found in `queries` arg of `reader` section
    queries: ['q1', 'q2', 'q3']  # i.e., if your `queries` in `reader` section has exactly q1, q2, q3 aliases
# ...
Common args #
From 1.10.0 , common args, supported by every model (and model type) were introduced.
Queries #
As a part to support multi-model configs
Available from v1.10.0
, queries arg is meant to define
queries from VmReader
particular model should be run on (meaning, all the series returned by each of these queries will be used in such model for fitting and inferencing).
queries arg is supported for all
the built-in
(as well as for
custom
) models.
This arg is backward compatible - if there is no explicit queries arg, then the model, defined in a config, will be run on ALL queries found in reader section:
      models:
  model_alias_1:
    # ...
    # no explicit `queries` arg is provided
will be implicitly converted to
      models:
  model_alias_1:
    # ...
    # if not set, `queries` arg is created and propagated with all query aliases found in `queries` arg of `reader` section
    queries: ['q1', 'q2', 'q3']  # i.e., if your `queries` in `reader` section has exactly q1, q2, q3 aliases
Schedulers #
As a part to support multi-scheduler configs
Available from v1.11.0
, schedulers arg is meant to define
schedulers
particular model should be attached to.
schedulers arg is supported for all
the built-in
(as well as for
custom
) models.
This arg is backward compatible - if there is no explicit schedulers arg, then the model, defined in a config, will be attached to ALL the schedulers found in scheduler section:
      models:
  model_alias_1:
    # ...
    # no explicit `schedulers` arg is provided
will be implicitly converted to
      models:
  model_alias_1:
    # ...
    # if not set, `schedulers` arg is created and propagated with all scheduler aliases found in `schedulers` section
    schedulers: ['s1', 's2', 's3']  # i.e., if your `schedulers` section has exactly s1, s2, s3 aliases
Provide series #
provide_series
Available from v1.12.0
arg limit the
output generated
by vmanomaly for writing. I.e. if the model produces default output series ['anomaly_score', 'yhat', 'yhat_lower', 'yhat_upper'] by specifying provide_series section as below, you limit the data being written to only ['anomaly_score'] for each metric received as a subject to anomaly detection.
      models:
  model_alias_1:
    # ...
    provide_series: ['anomaly_score']  # only `anomaly_score` metric will be available for writing back to the database
If provide_series is not specified in model config, the model will produce its default
model-dependent output
. The output can’t be less than ['anomaly_score']. Even if timestamp column is omitted, it will be implicitly added to provide_series list, as it’s required for metrics to be properly written.
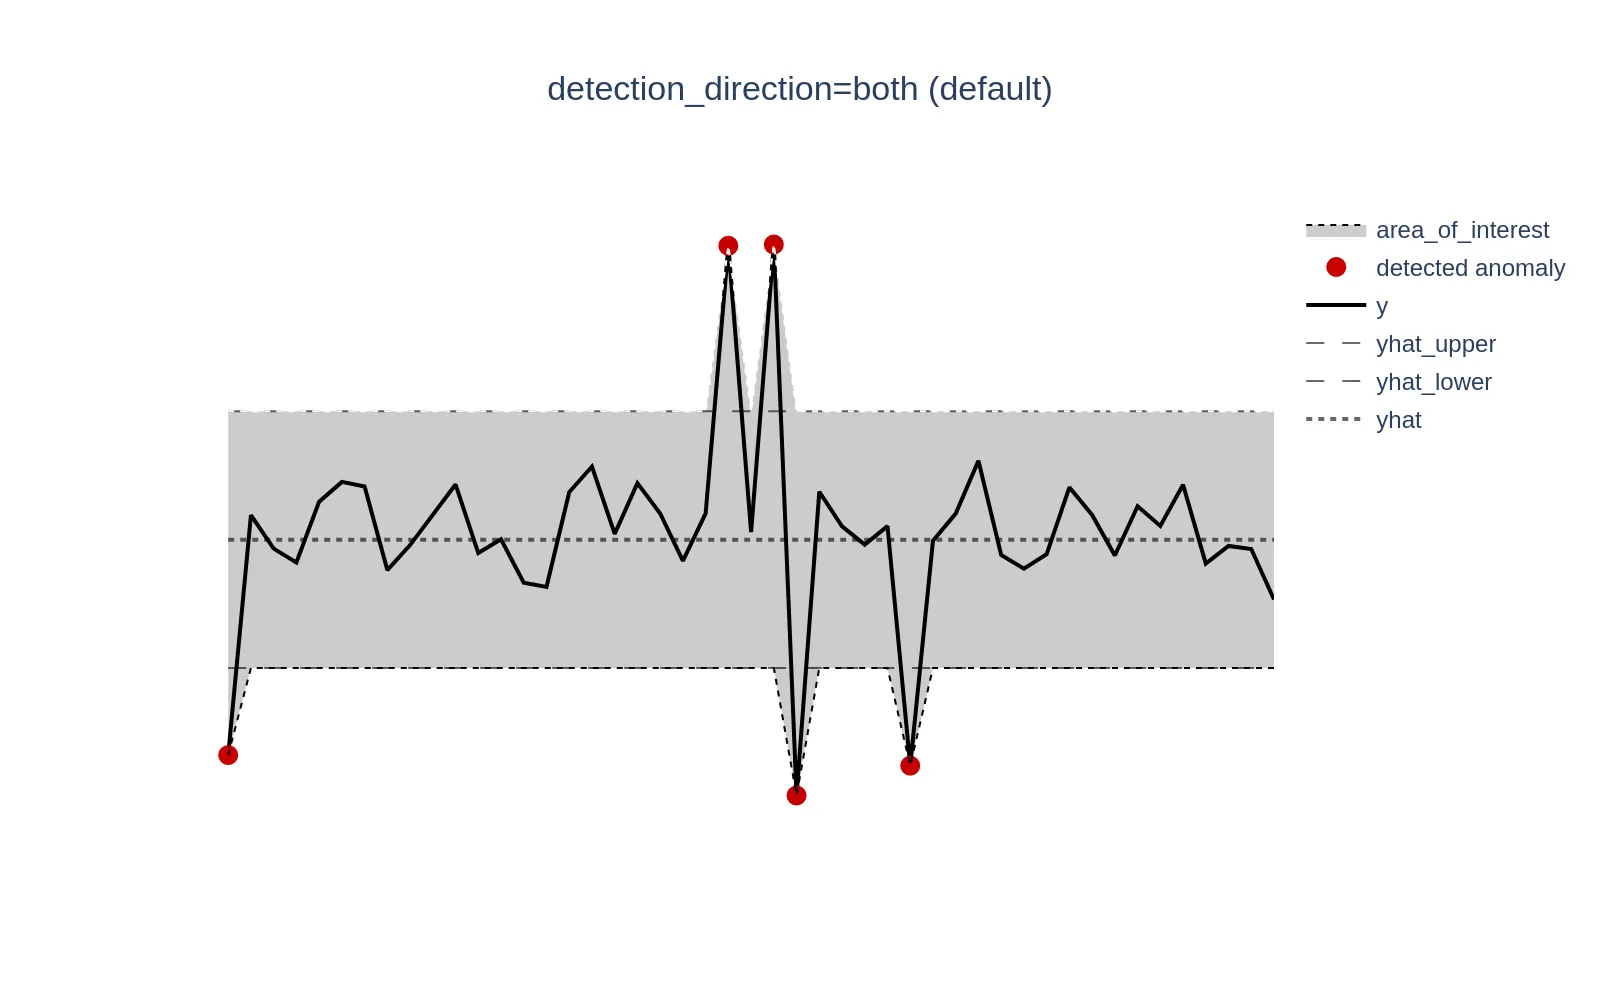
Detection direction #
detection_direction
Available from v1.13.0
arg can help in reducing the number of false positives
and increasing the accuracy, when domain knowledge suggest to identify anomalies occurring when actual values (y) are above, below, or in both directions relative to the expected values (yhat). Available choices are: both, above_expected, below_expected.
Here’s how default (backward-compatible) behavior looks like - anomalies will be tracked in both directions (y > yhat or y < yhat). This is useful when there is no domain expertise to filter the required direction.
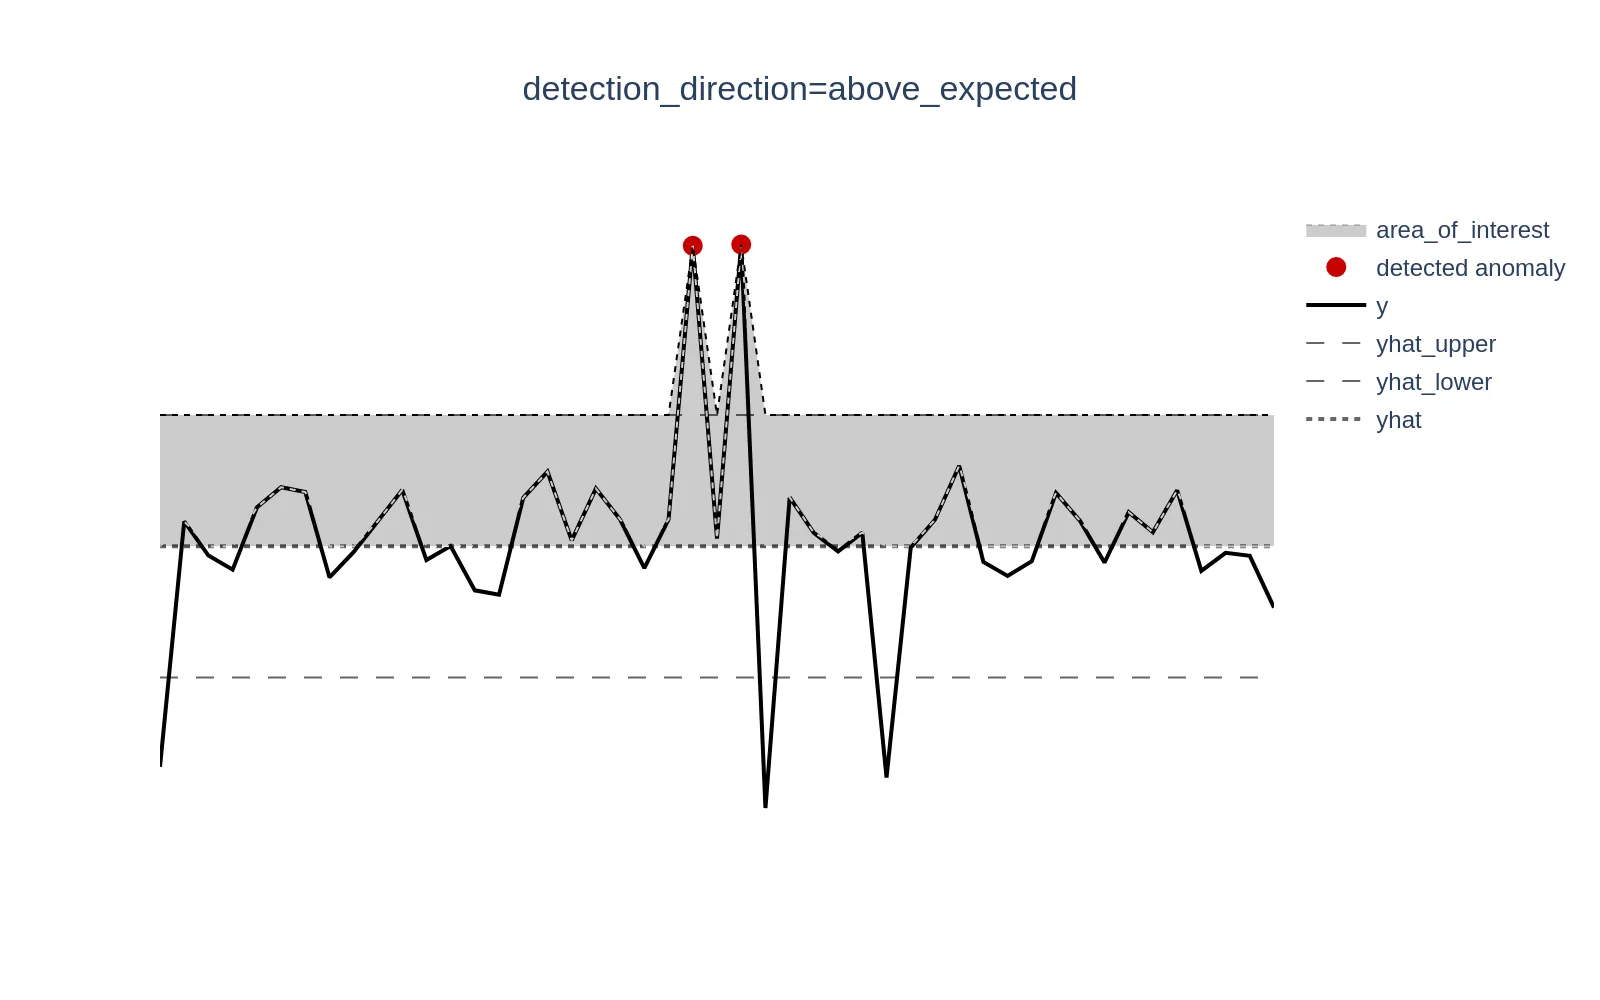
When set to above_expected, anomalies are tracked only when y > yhat.
Example metrics: Error rate, response time, page load time, number of failed transactions - metrics where lower values are better, so higher values are typically tracked.
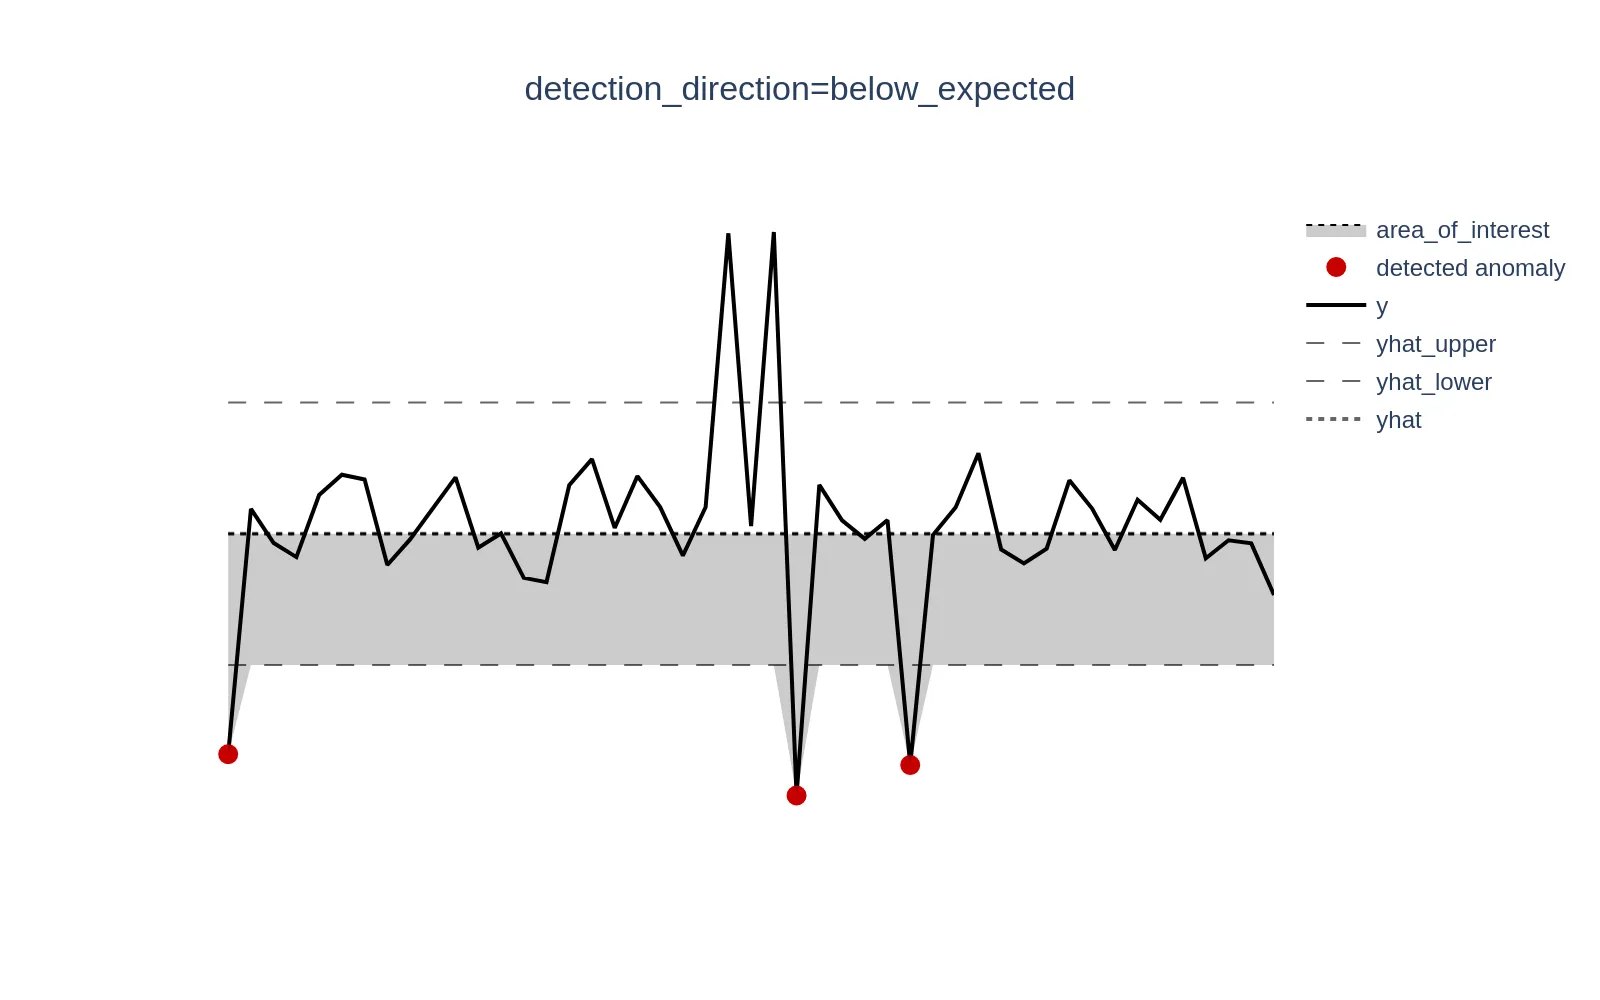
When set to below_expected, anomalies are tracked only when y < yhat.
Example metrics: Service Level Agreement (SLA) compliance, conversion rate, Customer Satisfaction Score (CSAT) - metrics where higher values are better, so lower values are typically tracked.
Config with a split example:
      models:
  model_above_expected:
    class: 'zscore_online'
    z_threshold: 3.0
    # track only cases when y > yhat, otherwise anomaly_score would be explicitly set to 0
    detection_direction: 'above_expected'
    # for this query we do not need to track lower values, thus, set anomaly detection tracking for y > yhat (above_expected)
    queries: ['query_values_the_lower_the_better']
  model_below_expected:
    class: 'zscore_online'
    z_threshold: 3.0
    # track only cases when y < yhat, otherwise anomaly_score would be explicitly set to 0
    detection_direction: 'below_expected'
    # for this query we do not need to track higher values, thus, set anomaly detection tracking for y < yhat (above_expected)
    queries: ['query_values_the_higher_the_better']
  model_bidirectional_default:
    class: 'zscore_online'
    z_threshold: 3.0
    # track in both direction, same backward-compatible behavior in case this arg is missing
    detection_direction: 'both'
    # for this query both directions can be equally important for anomaly detection, thus, setting it bidirectional (both)
    queries: ['query_values_both_direction_matters']
reader:
  # ...
  queries:
    query_values_the_lower_the_better:
      expr: metricsql_expression1
    query_values_the_higher_the_better:
      expr: metricsql_expression2
    query_values_both_direction_matters:
      expr: metricsql_expression3
# other components like writer, schedule, monitoring
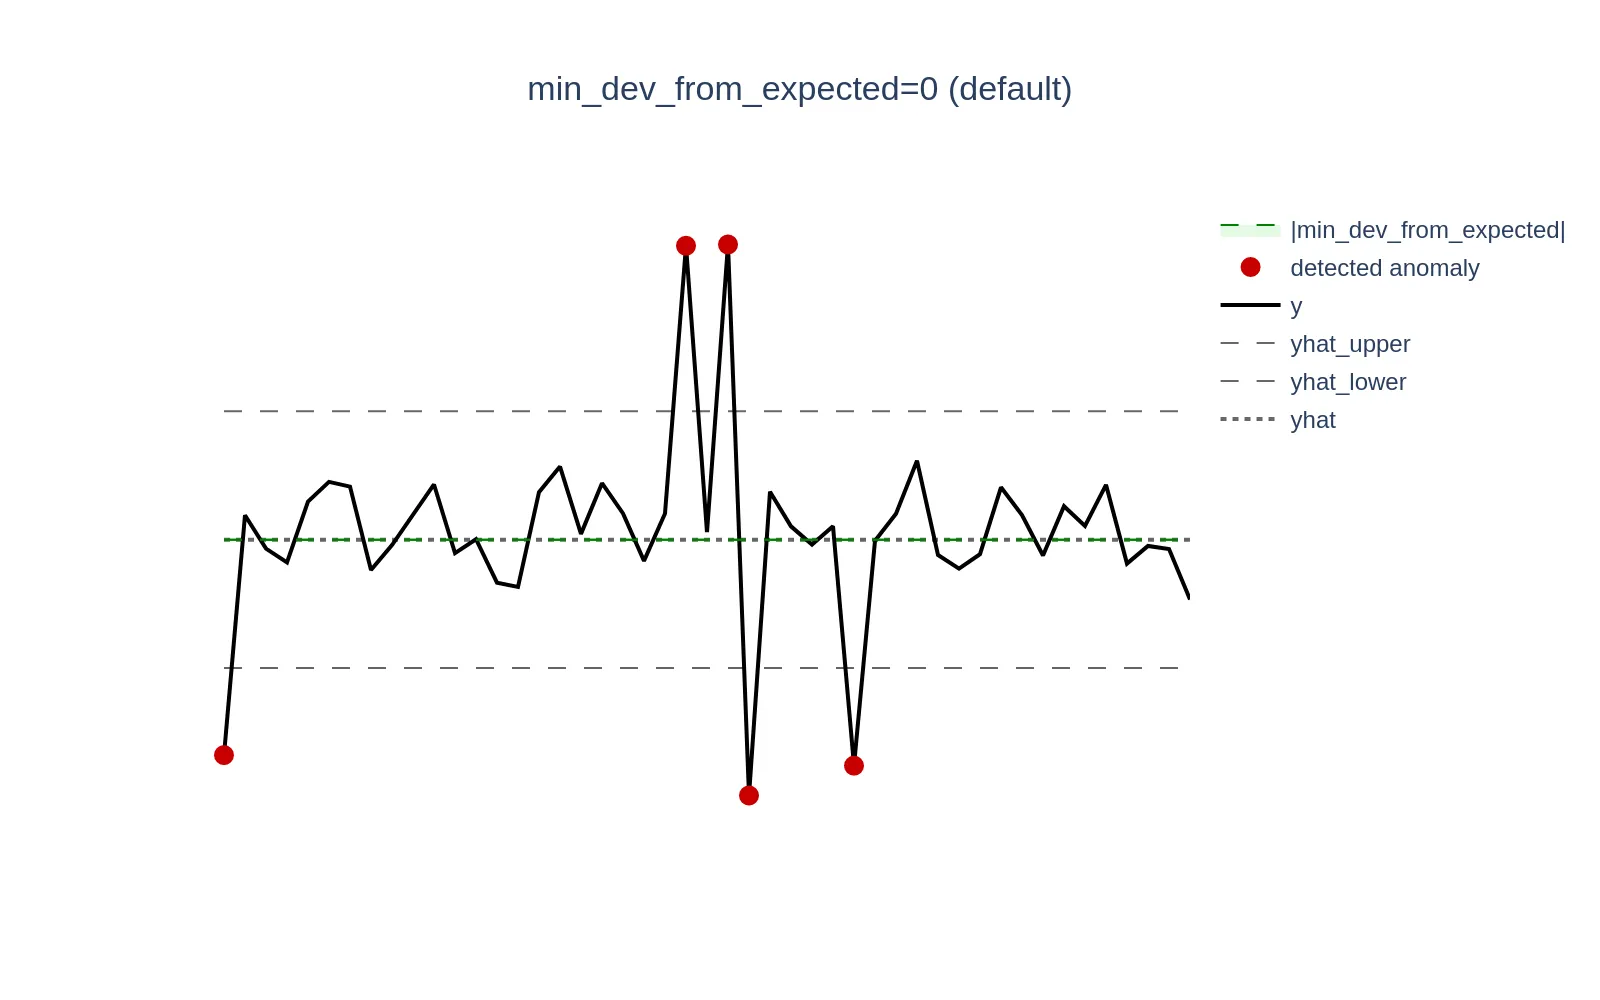
Minimal deviation from expected #
min_dev_from_expected
Available from v1.13.0
argument is designed to reduce false positives
in scenarios where deviations between the actual value (y) and the expected value (yhat) are relatively high. Such deviations can cause models to generate high
anomaly scores
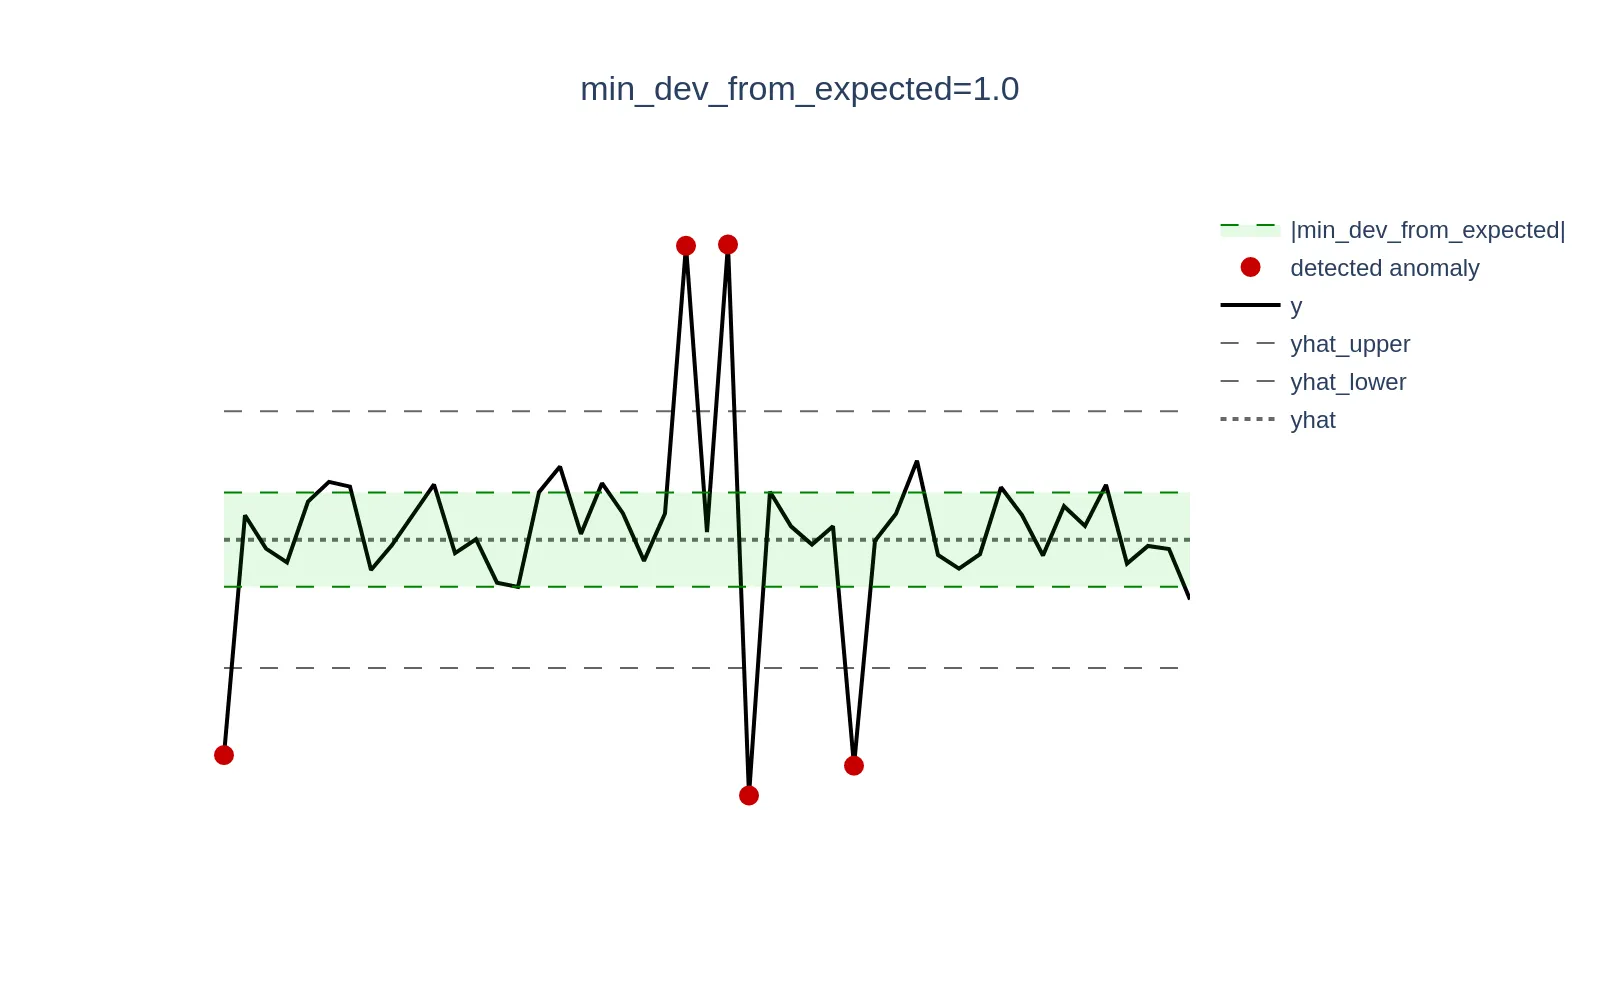
. However, these deviations may not be significant enough in absolute values from a business perspective to be considered anomalies. This parameter ensures that anomaly scores for data points where |y - yhat| < min_dev_from_expected are explicitly set to 0. By default, if this parameter is not set, it is set to 0 to maintain backward compatibility.
Available from v1.23.0
The min_dev_from_expected argument can be a list of two float values, allowing separate thresholds for upper and lower deviations. This is useful when the acceptable deviation varies in different directions (e.g., min_dev_from_expected: [0.01, 0.02] means that the lower bound is 0.01 when y is less than yhat and the upper bound is 0.02 when y is greater than yhat). If only one value is provided, it is broadcasted to both directions, meaning that the same threshold is applied for both upper and lower deviations (e.g., min_dev_from_expected: 0.01 means that the lower bound is 0.01 when y is less than yhat and the upper bound is also 0.01 when y is greater than yhat).
min_dev_from_expected must be >= 0. The higher the value of min_dev_from_expected is, the more significant the deviation must be to generate an anomaly score != 0. This helps in filtering out small absolute deviations that may not be meaningful in the context of the monitored metric.
Example: Consider a scenario where CPU utilization in specific mode is low and oscillates around 0.3% (0.003). A sudden spike to 1.3% (0.013) represents a +333% increase in relative terms, but only a +1 percentage point (0.01) increase in absolute terms, which may be negligible and not warrant an alert. Setting the min_dev_from_expected argument to 0.01 (1%) will ensure that all anomaly scores for deviations <= 0.01 are set to 0.
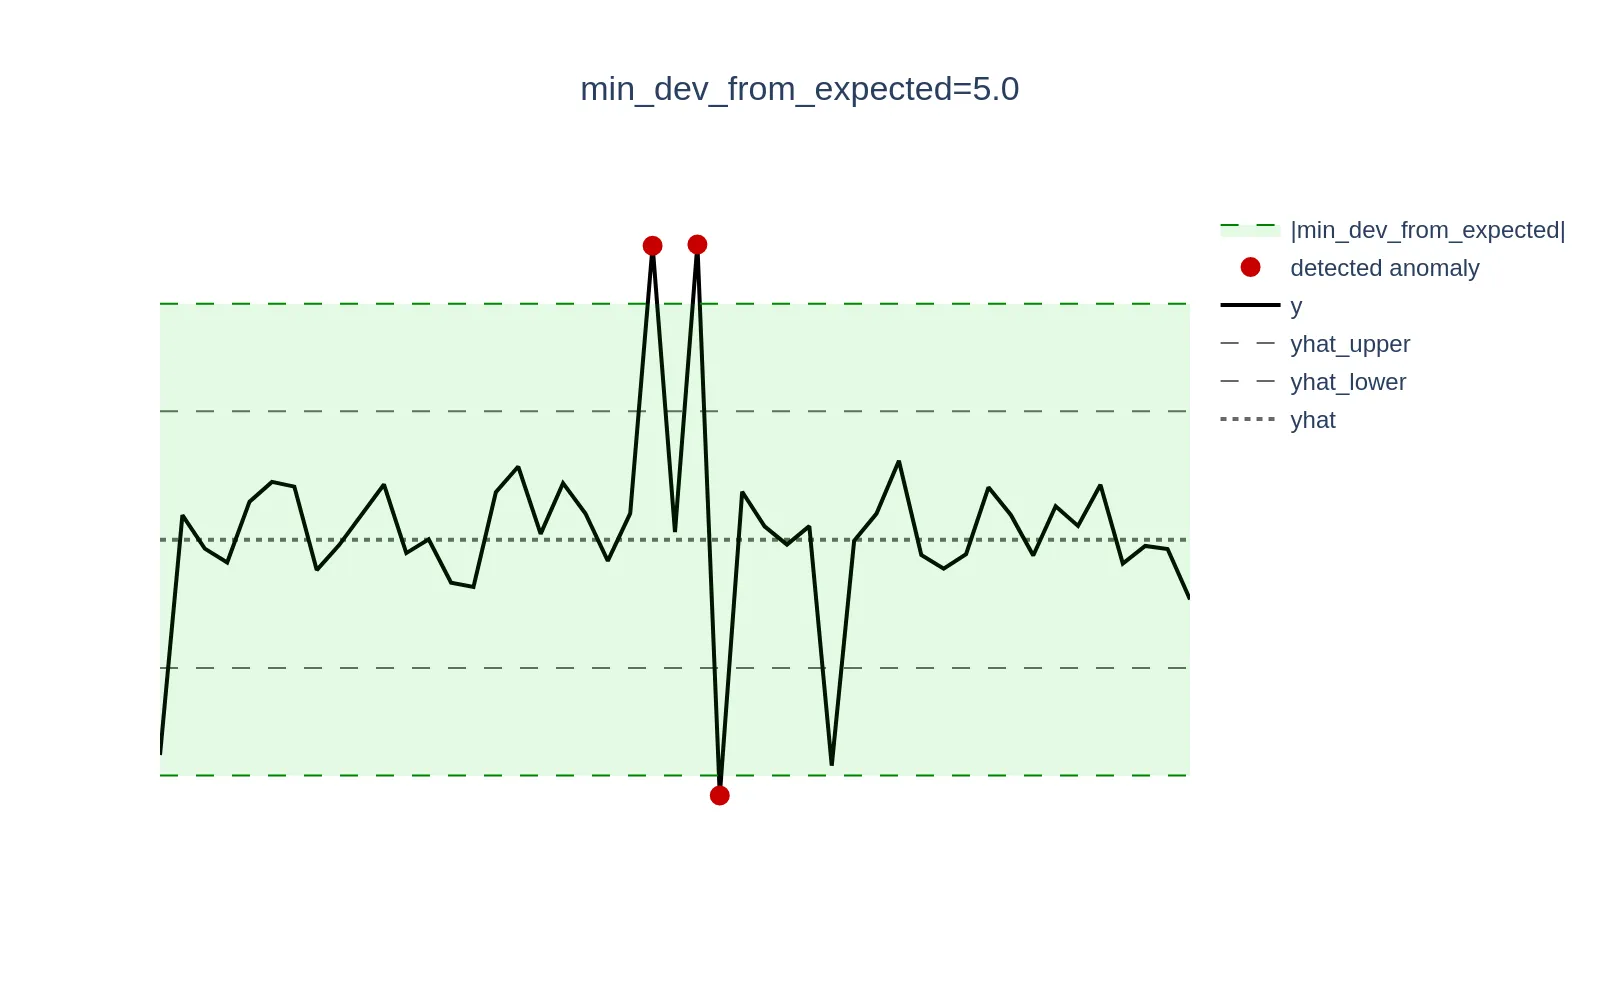
Visualizations below demonstrate this concept; the green zone defined as the [yhat - min_dev_from_expected, yhat + min_dev_from_expected] range excludes actual data points (y) from generating anomaly scores if they fall within that range.
Example config of how to use this param based on query results:
      # other components like writer, schedulers, monitoring ...
reader:
  # ...
  queries:
    # the usage of min_dev should reduce false positives here
    need_to_include_min_dev:
      expr: small_abs_values_metricsql_expression
    # min_dev is not really needed here
    normal_behavior:
      expr: no_need_to_exclude_small_deviations_metricsql_expression
models:
  zscore_with_min_dev:
    class: 'zscore_online'
    z_threshold: 3
    min_dev_from_expected: [5.0, 5.0]  # set the same threshold for both directions, meaning that deviations less than 5.0 in absolute values won't be considered anomalous, even if they are relatively significant
    queries: ['need_to_include_min_dev']  # use such models on queries where domain experience confirm usefulness
  zscore_wo_min_dev:
    class: 'zscore_online'
    z_threshold: 3
    # if not set, equals to setting min_dev_from_expected == 0 (meaning no filtering is applied)
    # min_dev_from_expected: [0.0, 0.0]
    queries: ['normal_behavior']  # use the default where it's not needed
Minimal relative deviation from expected #
Available from v1.29.1
min_rel_dev_from_expected argument serves a similar purpose to min_dev_from_expected (see
section above
), but focuses on relative deviations rather than absolute ones. It is designed to reduce false positives
in scenarios where the relative deviation between the actual value (y) and the expected value (yhat) is high, but the absolute deviation is not significant enough to be considered an anomaly from a business perspective. This parameter ensures that anomaly scores for data points where |y - yhat| / |yhat| < min_rel_dev_from_expected are explicitly set to 0. By default, if this parameter is not set, it is set to 0 to maintain backward compatibility.
Parameter can be a list of two float values, allowing separate thresholds for upper and lower relative deviations. If only one value is provided, it is broadcasted to both directions.
If both min_dev_from_expected
arg
and min_rel_dev_from_expected are set, the model will combine both filters. A data point will be considered anomalous (i.e., have an anomaly score != 0) only if it exceeds both the absolute deviation threshold defined by min_dev_from_expected and the relative deviation threshold defined by min_rel_dev_from_expected. This allows for more granular control over anomaly detection, ensuring that only significant deviations in both absolute and relative terms are flagged as anomalies.
Example: Consider a scenario of monitoring incoming traffic to websites that typically receives unknown in advance requests per second (from tens to thousands). Setting absolute deviation threshold with min_dev_from_expected may not be effective in reducing false positives, as even a small increase in traffic (e.g., from 10 to 20 requests per second) can represent a 100% relative increase, which may be significant for that website. Instead, setting min_rel_dev_from_expected to smaller relative value - [20, 40] (20/40%) - will ensure that traffic drop from 10 to 8 requests per second (20% decrease) and traffic spike from 10 to 14 requests per second (40% increase) won’t be considered anomalous, even if they exceed confidence intervals, thus, reducing false positives for small absolute deviations that are relatively significant.
Example of how to use this parameter in config:
      # other components like writer, schedulers, monitoring ...
reader:
  # ...
  queries:
    # the usage of min_rel_dev should reduce false positives here
    need_to_include_min_rel_dev:
      expr: small_abs_values_metricsql_expression
    # min_rel_dev is not really needed here
    normal_behavior:
      expr: no_need_to_exclude_small_deviations_metricsql_expression
models:
  zscore_with_min_rel_dev:
    class: 'zscore_online'
    z_threshold: 3
    min_rel_dev_from_expected: [10, 20]  # set different thresholds for both directions, meaning that relative deviations less than 10% when y < yhat and less than 20% when y > yhat won't be considered anomalous, even if they exceed confidence intervals, thus, reducing false positives for small absolute deviations that are relatively significant
    queries: ['need_to_include_min_rel_dev']  # use such models on queries where domain experience confirm usefulness
  zscore_wo_min_rel_dev:
    class: 'zscore_online'
    z_threshold: 3
    # if not set, equals to setting min_rel_dev_from_expected == 0 (meaning no filtering is applied)
    # min_rel_dev_from_expected: [0, 0]
    queries: ['normal_behavior']  # use the default where it's not needed
Group by #
The groupby argument works only in combination with
multivariate models
.
The groupby argument
Available from v1.13.0
(list[string]) enables logical grouping within
multivariate models
. When specified, a separate multivariate model is trained for each unique combination of label values present in the groupby columns.
For example, to perform multivariate anomaly detection at the machine level while avoiding interference between different entities, you can set groupby: [host] or groupby: [instance]. This ensures that a separate multivariate model is trained for each individual entity (e.g., per host). Below is a simplified example illustrating how to track multivariate anomalies using CPU, RAM, and network data for each host.
      # other config sections ...
reader:
  # other reader params ...
  # assume there are M unique hosts identified by the `host` label
  queries:
    # return one timeseries for each CPU mode per host, total = N*M timeseries
    cpu: sum(rate(node_cpu_seconds_total[5m])) by (host, mode)
    # return one timeseries per host, total = 1*M timeseries
    ram: |
      (
       (node_memory_MemTotal_bytes - node_memory_MemAvailable_bytes)
       / node_memory_MemTotal_bytes
      ) * 100 by (host)
    # return one timeseries per host for both network receive and transmit data, total = 1*M timeseries
    network: |
      sum(rate(node_network_receive_bytes_total[5m])) by (host)
      + sum(rate(node_network_transmit_bytes_total[5m])) by (host)

models:
  iforest: # alias for the model
    class: isolation_forest_multivariate
    contamination: 0.01
    # the multivariate model can be trained on 2+ timeseries returned by 1+ queries
    queries: [cpu, ram, network]
    # train a distinct multivariate model for each unique value found in the `host` label
    # a single multivariate model will be trained on (N + 1 + 1) timeseries, total = M models
    groupby: [host]
Scale #
Previously available only to
ProphetModel
and
OnlineQuantileModel
, the scale
Available from v1.20.0
parameter is now applicable to all models that support generating predictions (yhat, yhat_lower, yhat_upper). Also, it is two-sided now, represented as a list of two positive float values, allowing separate scaling for the intervals [yhat, yhat_upper] and [yhat_lower, yhat]. The new margins are calculated as:
- Upper margin:
|yhat_upper - yhat| * scale_upper - Lower margin:
|yhat - yhat_lower| * scale_lower
For backward compatibility, the previous format (scale: x) remains supported and will be automatically converted to scale: [x, x].
For example, setting scale: [1.2, 0.75] for particular model will:
- Increase the width of the lower confidence interval by 20%.
- Decrease the width of the upper confidence boundary by 25%.
The most common use case is when there is a preference to widen one side to blacklist smaller false positives (which otherwise would have anomaly scores only slightly higher than 1.0, still making such data points anomalous), while tightening the other side to avoid missing true positives due to an overly loose margin (leading to anomaly scores being slightly less than 1.0, making such data points non-anomalous).
      # other components like reader, writer, schedulers, monitoring ...
models:
  zscore_no_scale:
    class: 'zscore_online'
    z_threshold: 3
    # if not set, equals to [1.0, 1.0], meaning no scaling is applied
    # scale: [1.0, 1.0]
  zscore_scaled:
    class: 'zscore_online'
    z_threshold: 3
    # vs `zscore_no_scale`, increase lower confidence interval width by 1.2x, decrease upper confidence width by 25% (1.0 - 0.25 = 0.75), thus, making the model more conservative in flagging anomalies when y < yhat and more aggressive when y > yhat
    scale: [1.2, 0.75]
Clip predictions #
A post-processing step to clip model predictions (yhat, yhat_lower, and yhat_upper series) to the configured
data_range values
in VmReader is available.
This behavior is controlled by the boolean argument clip_predictions
Available from v1.20.0
:
- Disabled by default for backward compatibility.
- Works for models that generate predictions and estimates (e.g.,
ProphetModel) by settingclip_predictionstoTruefor respective model inmodelssection.
The primary use case is to align domain knowledge about data behavior (defined via data_range) with what is shown in visualizations, such as in the
Grafana dashboard
. This ensures that predictions (yhat, yhat_lower, yhat_upper) are plotted consistently alongside real metric values (y) and remain within reasonable expected bounds.
This parameter does not impact the generation of anomaly scores > 1 for datapoints where y falls outside the defined data_range.
      # other components like writer, schedulers, monitoring ...
reader:
  # ...
  queries:
    q1_clipped:
      expr: 'q1_metricsql'
      data_range: [0, "inf"]
    q2_no_clip:
      expr: 'q2_metricsql'
      # if no data range defined, it will be implicitly converted to ["-inf", "inf"]
models:
  zscore_mixed:
    class: 'zscore_online'
    z_threshold: 3
    clip_predictions: True
    queries: [
      # `yhat`, `yhat_lower`, `yhat_upper` will be within [0, inf]
      # for all `zscore_mixed` instances that are fit on series returned by `q1_clipped` query
      # anomaly scores > 1 will still be produced for `y` outside of data_range
      'q1_clipped',
      # there will be no (explicit) clip of `yhat`, `yhat_lower`, `yhat_upper`
      # for all `zscore_mixed` instances that are fit on series returned by `q2_no_clip` query
      # even when `clip_predictions` arg is set, because data_range was not set for `q2_no_clip`
      'q2_no_clip',
    ]
  zscore_no_clip:
    class: 'zscore_online'
    z_threshold: 3
    # if not set, by default resolved to `clip_predictions: False`
    queries: [
      # `yhat`, `yhat_lower`, `yhat_upper` won't be clipped to [0, inf]
      # even though `data_range` for `q1_clipped` is set
      # however, anomaly scores > 1 will still be produced for y outside of data_range
      'q1_clipped',
      # there will be no (explicit) clip of yhat, yhat_lower, yhat_upper
      # for all `zscore_mixed` instances that are fit on series returned by `q2_no_clip` query
      # as `clip_predictions` arg is not set, regardless of data_range for `q2_no_clip`
      'q2_no_clip',
    ]
Score outside data range #
The anomaly_score_outside_data_range
Available from v1.20.0
parameter allows overriding the default anomaly score (1.01) assigned when actual values (y) fall outside the defined data_range if defined in
reader
. This provides greater flexibility for alerting rule configurations and enables clearer visual differentiation between different types of anomalies:
- By default,
yvalues outsidedata_rangetrigger an anomaly score of1.01, which serves as a basic alerting rule. - However, some users may require higher anomaly scores (e.g.,
> 1.2) to trigger alerts reliably in their monitoring setups.
How it works
- If not set, the default value (
1.01) is used for backward compatibility. - If defined at the service level (
settingssection ), it applies to all models unless overridden at the model level. - If set per model, it takes priority over the global setting.
Example (override)
      settings:
  # other parameters ...
  # all the models in `models` section will inherit this value unless overridden at the model level
  anomaly_score_outside_data_range: 1.2

models:
  model_score_override:
    class: 'zscore_online'
    # explicitly set, takes priority over `settings`'s value
    anomaly_score_outside_data_range: 1.5
  model_score_from_settings_level:
    class: 'zscore_online'
    # inherits from `settings`, will be `1.2`, same as setting
    # anomaly_score_outside_data_range: 1.2
Example (default vs custom)
      models:
  model_default_score:
    class: 'zscore_online'
    # default anomaly score (1.01) is applied when y is outside data_range, same as setting
    # anomaly_score_outside_data_range: 1.01
  model_higher_out_of_data_range_score:
    class: 'zscore_online'
    # explicitly set, takes priority over `settings`'s value
    anomaly_score_outside_data_range: 3.0
Decay #
The decay argument works only in combination with
online models
like
ZScoreOnlineModel
or
OnlineQuantileModel
.
The decay
Available from v1.23.0
argument is used to control the (exponential) decay factor for online models, which determines how quickly the model adapts to new data. It is a positive float value from (0.0, 1.0] interval, where:
- Value
1.0means no decay (the model treats all data points equally, without giving more weight to recent ones). This is the default value for backward compatibility. - Values less than
1.0mean that the model will give more weight to recent data, effectively “forgetting” older data over time.
Roughly speaking, for the recent N datapoints model processes decay = d means that these datapoints will contribute to the model as [1 - d^X] percent of total importance, for example decay of
0.99means that 100 recent datapoints will contribute as [1 - 0.99^100] = 63.23% of total importance0.999means that 1000 recent datapoints will contribute as [1 - 0.999^1000] = 63.23% of total importance
For example, if the model is updated every 5 minutes (scheduler.infer_every), on five 1-minute datapoints and there is a need to keep the last 1 day of data as the most impactful, setting decay: 0.996 will ensure that the model has the last (86400/60) = 1440 datapoints contributing as [1 - 0.996^1440] = 99.6% of total importance, without the need to re-train the model on all 1440 datapoints every day with fit_every: 1d (which would be the limitation for
offline models
).
Example config:
      # other components like writer, schedulers, monitoring ...
reader:
  # ...
  queries:
    q1: metricsql_expression1
    # ...

models:
  online_zscore:
    class: 'zscore_online'
    z_threshold: 3.0
    decay: 0.996  # decay factor for online model, default is 1.0
    queries: ['q1']
Model types #
There are 2 model types, supported in vmanomaly, resulting in 4 possible combinations:
By input data handling:
- Univariate models - models fit/used per each individual time series, producing individual output
- Multivariate models - models fit/used on a set of time series simultaneously, producing shared output
By update strategy:
- Offline models
- models that require full re-fit on a defined
fit_windowof data to update their parameters defined byfit_everyschedule in scheduler - Online (incremental) models
Available from v1.15.0
- models that support incremental updates of their parameters on each
infer_everystep, even on a single datapoint, without the need for a full re-fit on afit_windowof data. This is a recommended approach to reduce data burden from VictoriaMetrics or other data sources.
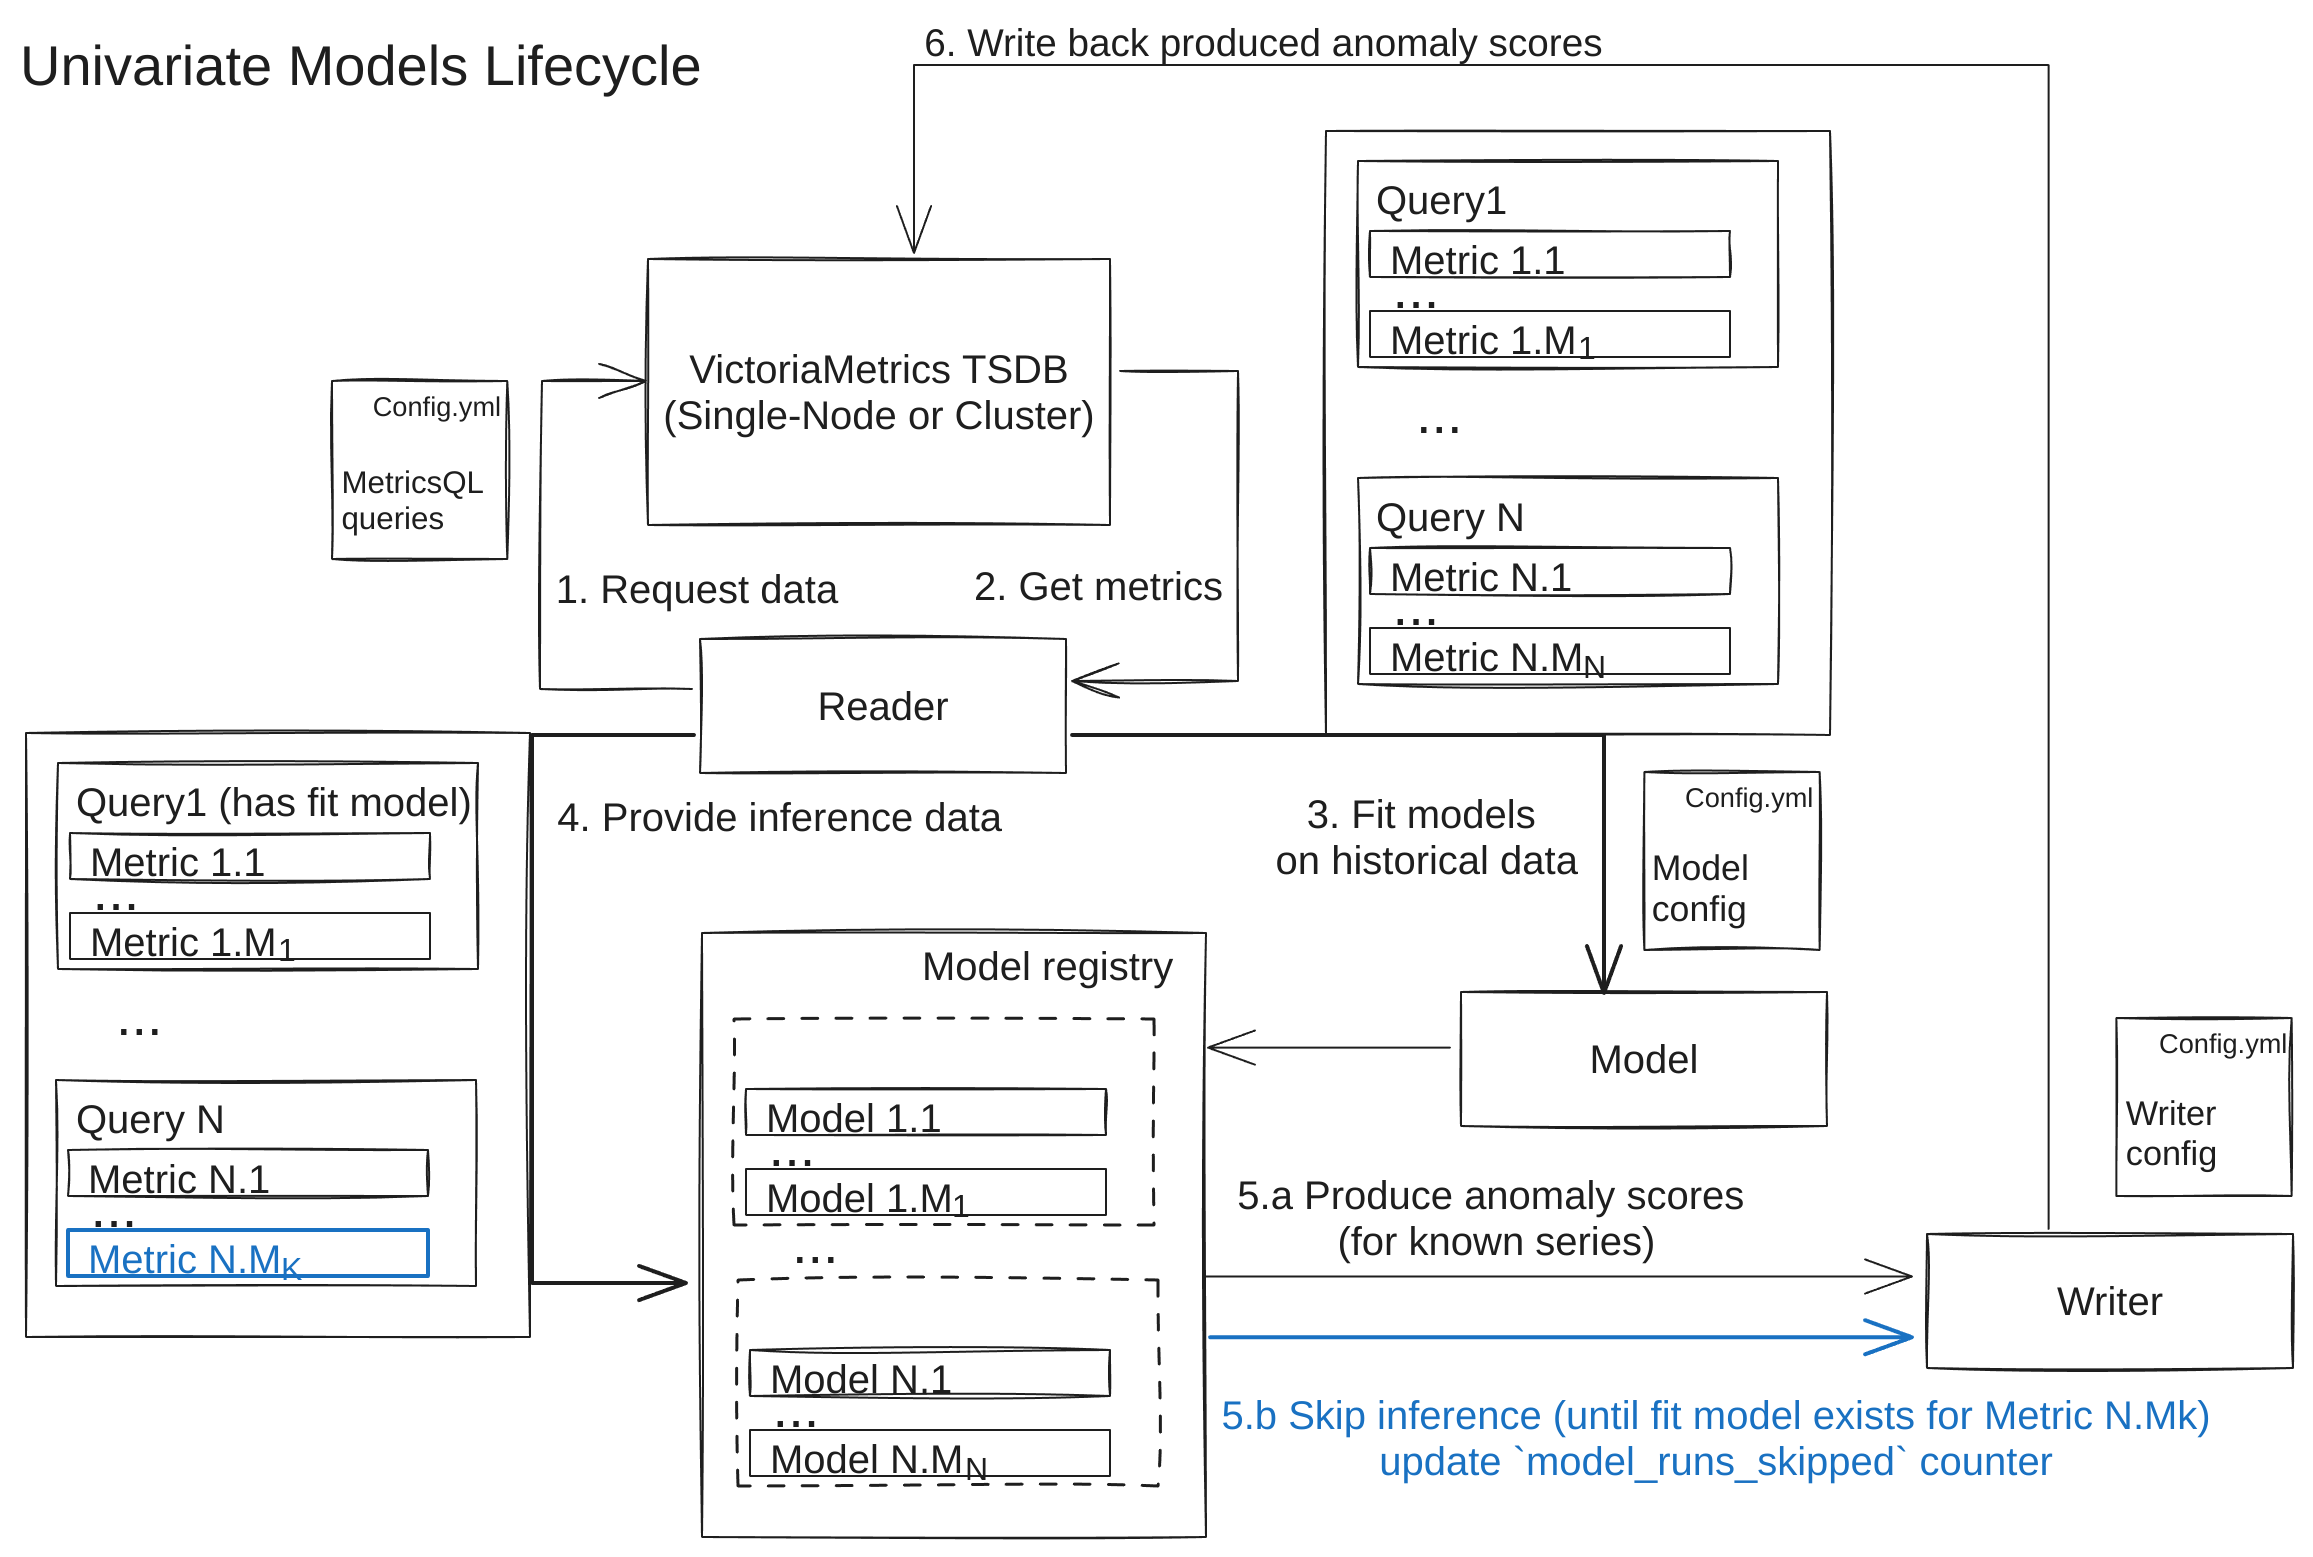
Univariate Models #
For a univariate type, one separate model is fit/used for inference per each time series, defined in its queries arg.
For example, if you have some univariate model, defined to use 3 MetricQL queries , each returning 5 time series, there will be 3*5=15 models created in total. Each such model produce individual output for each of time series.
If during an inference, you got a series having new labelset (not present in any of fitted models), the inference will be skipped until you get a model, trained particularly for such labelset during forthcoming re-fit step.
Implications: Univariate models are a go-to default, when your queries returns changing amount of individual time series of different magnitude, trend or seasonality , so you won’t be mixing incompatible data with different behavior within a single fit model (context isolation).
Examples: Prophet , Holt-Winters
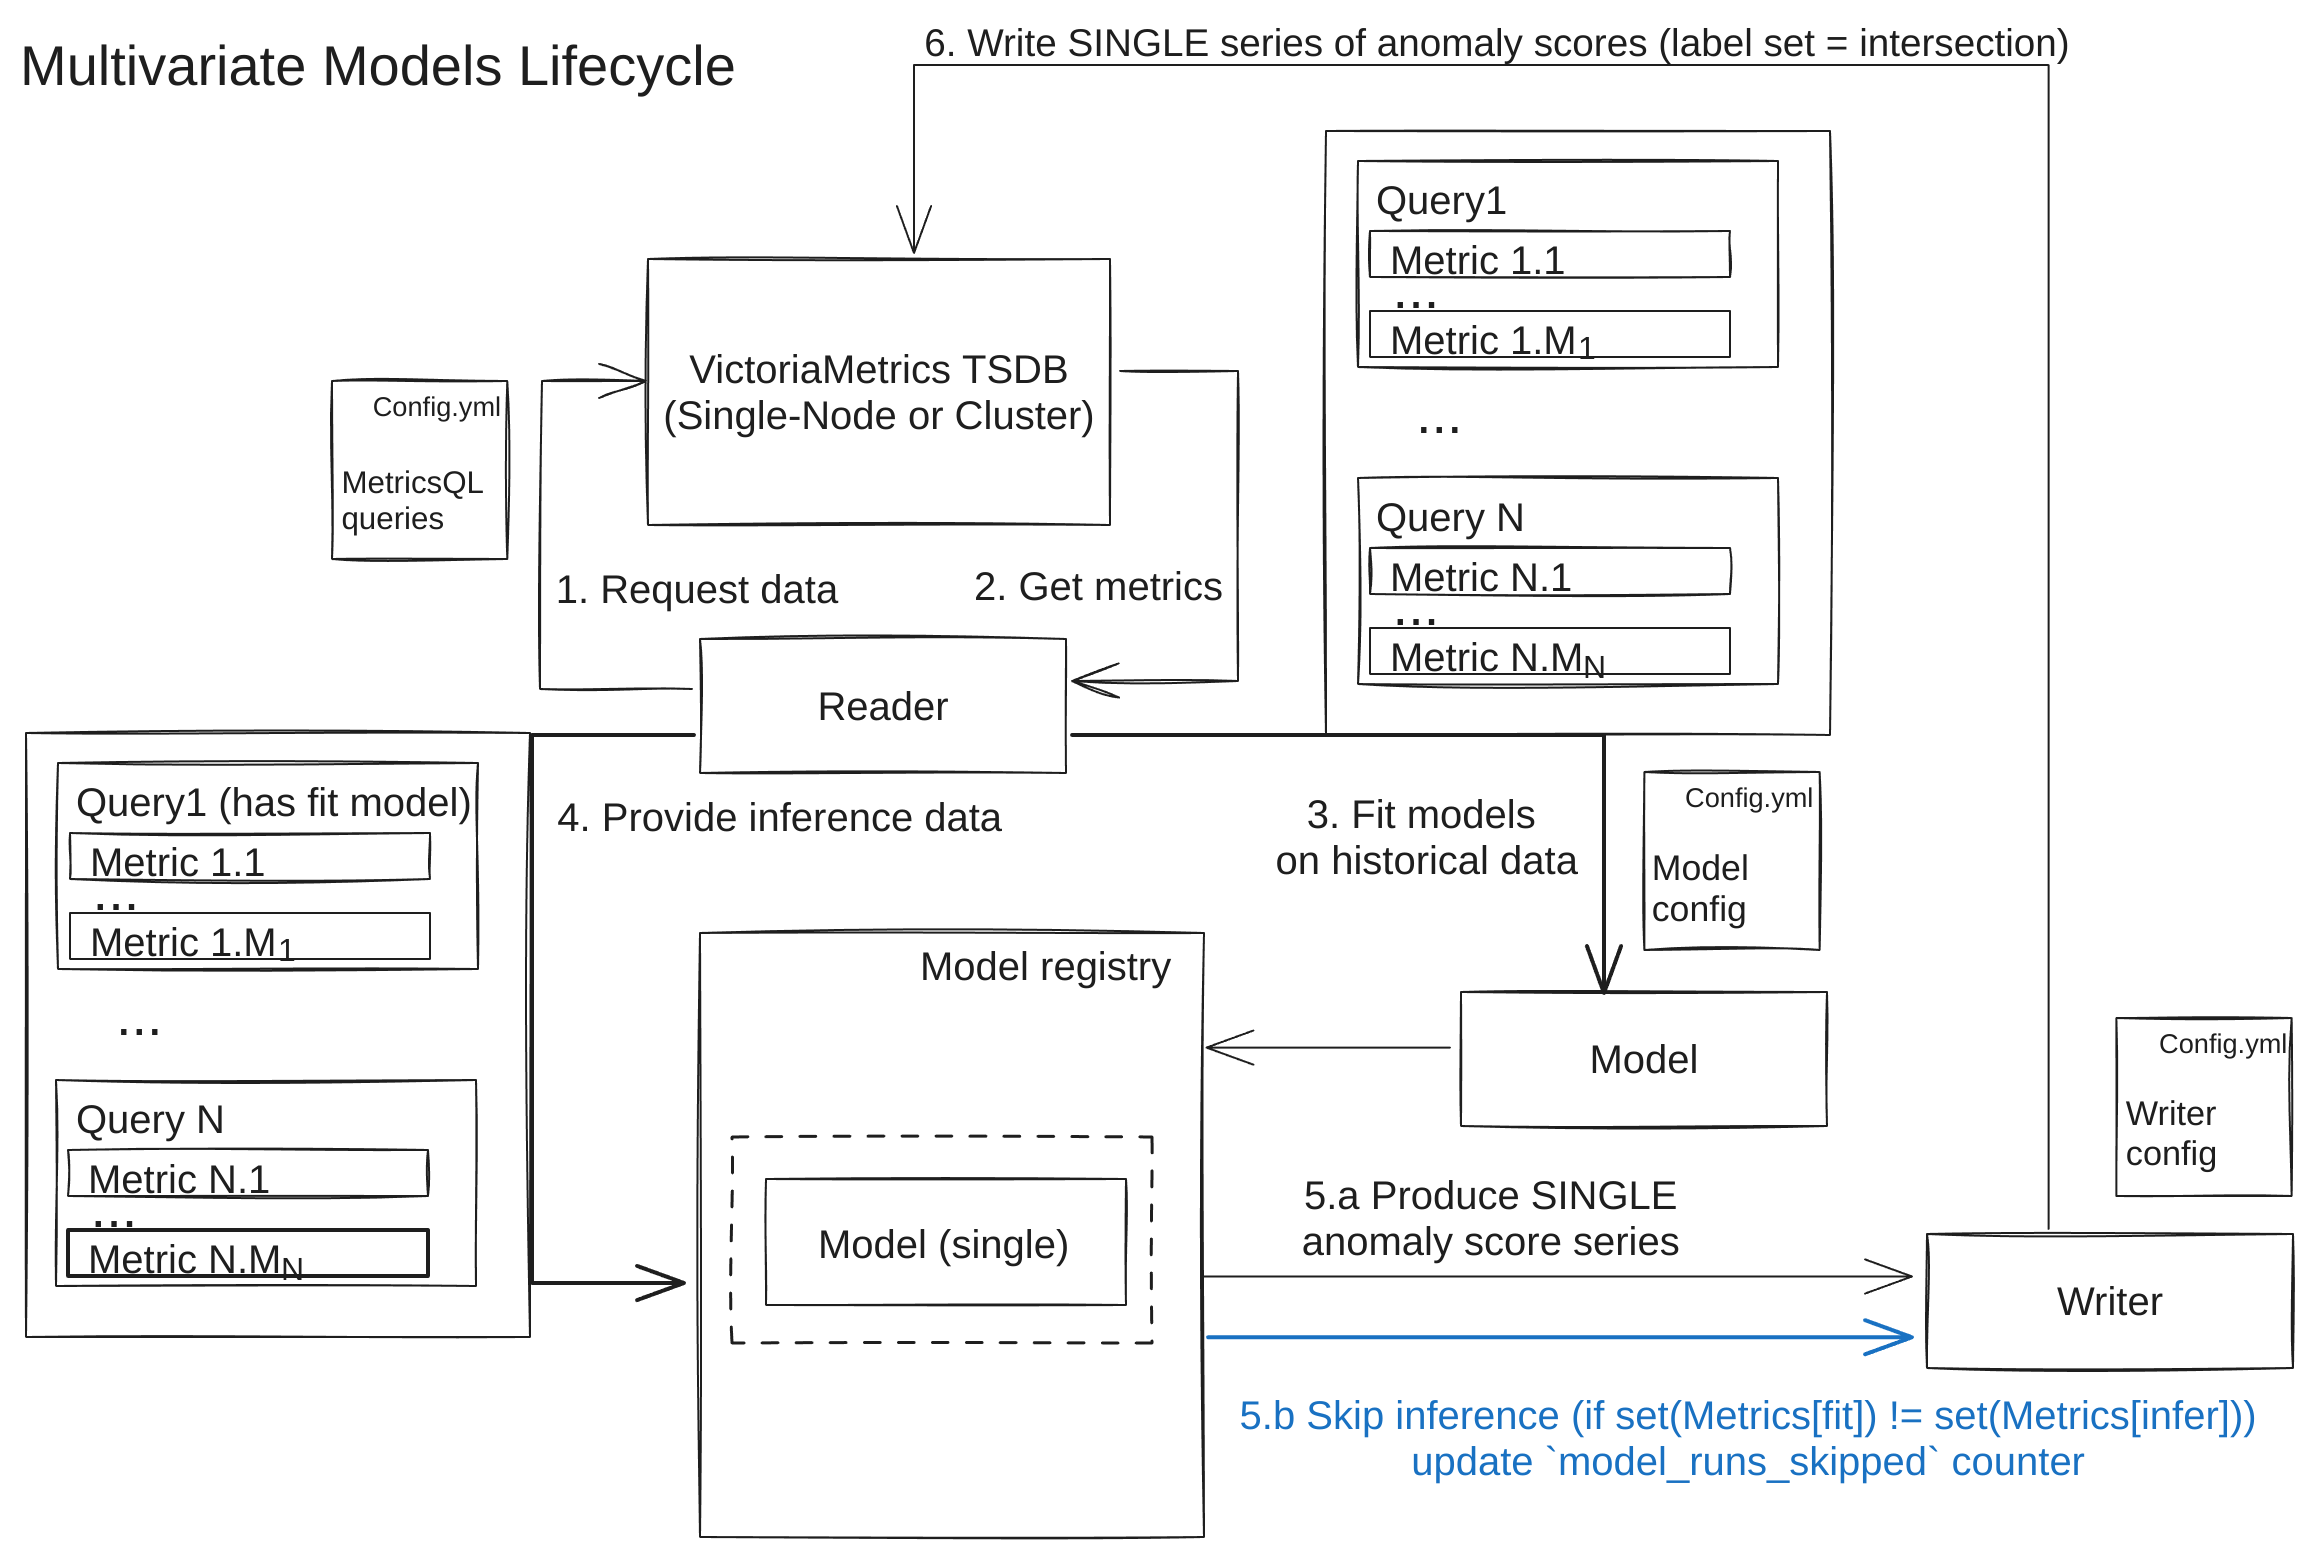
Multivariate Models #
For a multivariate type, one shared model is fit/used for inference on all time series simultaneously, defined in its queries arg.
For example, if you have some multivariate model to use 3 MetricQL queries , each returning 5 time series, there will be one shared model created in total. Once fit, this model will expect exactly 15 time series with exact same labelsets as an input. This model will produce one shared output .
Available from v1.16.0
N models — one for each N unique combinations of label values specified in the groupby
common argument
— can be trained. This allows for context separation (e.g., one model per host, region, or other relevant grouping label), leading to improved accuracy and faster training. See an example
here
.
If during an inference, you got a different amount of series or some series having a new labelset (not present in any of fitted models), the inference will be skipped until you get a model, trained particularly for such labelset during forthcoming re-fit step.
Implications: Multivariate models are a go-to default, when your queries returns fixed amount of individual time series (say, some aggregations), to be used for adding cross-series (and cross-query) context, useful for catching collective anomalies
or novelties
(expanded to multi-input scenario). For example, you may set it up for anomaly detection of CPU usage in different modes (idle, user, system, etc.) and use its cross-dependencies to detect unseen (in fit data) behavior.
Examples: IsolationForest
Online Models #
Online models are best used in combination with stateful service Available from v1.24.0 to ensure that the model state is preserved if the service restarts and any aggregated model updates are not lost. E.g. if the model was already trained on many weeks of data and is being updated on new datapoints every minute, there is no need to re-train it from scratch on the same data after each restart, as it can continue to update restored state on new datapoints. Also it is worth setting retention policy Available from v1.28.1 for such models to periodically clean up outdated artifacts, e.g. due to high churn rate of unique labelsets in input data.
Online (incremental) models
Available from v1.15.0
allow defining a smaller frame fit_window and less frequent fit calls to reduce the data burden from VictoriaMetrics. They make incremental updates to model parameters during each infer_every call, even on a single datapoint.
If the model doesn’t support online mode, it’s called offline (its parameters are only updated during fit calls).
Main differences between offline and online:
Fit stage
- Both types have a
fitstage, run on thefit_windowdata frame. - For offline models,
fit_windowshould contain enough data to train the model (e.g., 2 seasonal periods). - For online models, training can start gradually from smaller chunks (e.g., 1 hour).
Infer stage
- Both types have an
inferstage, run on new datapoints (timestamps > last seen timestamp of the previousinfercall). - Offline models use a pre-trained (during
fitcall) static model to make everyinfercall until the nextfitcall, when the model is completely re-trained. - Online models use a pre-trained (during
fitcall) dynamic model, which is gradually updated during eachinfercall with new datapoints. However, to prevent the model from accumulating outdated behavior, eachfitcall resets the model from scratch.
Strengths:
- The ability to distribute the data load evenly between the initial
fitand subsequentinfercalls. For example, an online model can be fit on 101mdatapoints during the initialfitstage once per month and then be gradually updated on the same 101mdatapoints during eachinfercall each 10 minutes. - The model can adapt to new data patterns (gradually updating itself during each
infercall) without needing to wait for the nextfitcall and one big re-training. - Slightly faster training/updating times compared to similar offline models.
- Please refer to additional benefits for data-intensive setups in correspondent FAQ section.
Limitations:
- Until the online model sees enough data (especially if the data shows strong seasonality), its predictions might be unstable, producing more false positives
(
anomaly_score > 1) or making false negative predictions, skipping real anomalies . - Not all models (e.g., complex ones like Prophet ) have a direct online alternative, thus their applicability can be somewhat limited.
Each of the (
built-in
or
custom
) online models (like
OnlineZscoreModel
) shares the following common parameters and properties:
n_samples_seen_(int) - this model property refers to the number of datapoints the model was trained on and increases from 0 (before the firstfit) with each consecutiveinfercall.min_n_samples_seen(int), optional - this parameter defines the minimum number of samples to be seen before reliably computing the anomaly score . Otherwise, the anomaly score will be 0 untiln_samples_seen_>min_n_samples_seen, as there is not enough data to trust the model’s predictions. For example, if your data has hourly seasonality and ‘1m’ frequency, settingmin_n_samples_seen_to 288 (1440 minutes in a day / 5 minutes) should be sufficient.
Offline models #
Every other model that isn’t
online
. Offline models are completely re-trained during fit call and aren’t updated during consecutive infer calls.
Built-in Models #
Overview #
Built-in models support 2 groups of arguments:
vmanomaly-specific arguments - please refer to Parameters specific for vmanomaly and Default model parameters subsections for each of the models below.- Arguments to inner model (say, Facebook’s Prophet
), passed inside
argsargument as key-value pairs, that will be directly given to the model during initialization to allow granular control. Optional.
For users who may not be familiar with Python data types such as list[dict], a dictionary
in Python is a data structure that stores data values in key-value pairs. This structure allows for efficient data retrieval and management.
Models:
- AutoTuned
- designed to take the cognitive load off the user, allowing any of built-in models below to be re-tuned for best hyperparameters on data seen during each
fitphase of the algorithm. Tradeoff is between increased computational time and optimized results / simpler maintenance. - Prophet - the most versatile one for production usage, especially for complex data (trends , change points , multi-seasonality )
- Online Z-score - useful for initial testing and for simpler data (de-trended data without strict seasonality and with anomalies of similar magnitude as your “normal” data)
- MAD - similarly to Z-score , is effective for identifying outliers in relatively consistent data. Useful for detecting sudden, stark deviations from the median, being less prone to outlier’s magnitude than z-score.
- Rolling Quantile - best for data with evolving patterns, as it adapts to changes over a rolling window.
- Online Seasonal Quantile
- best used on de-trended
data with strong (possibly multiple) seasonalities
. Can act as a (slightly less powerful)
online
replacement to
ProphetModel. - Seasonal Trend Decomposition - similarly to Holt-Winters, is best for data with pronounced seasonal and trend components
- Isolation forest (Multivariate) - useful for metrics data interaction (several queries/metrics -> single anomaly score) and efficient in detecting anomalies in high-dimensional datasets
- Holt-Winters - well-suited for data with moderate complexity, exhibiting distinct trends and/or single seasonal pattern .
- Custom model - benefit from your own models and expertise to better support your unique use case.
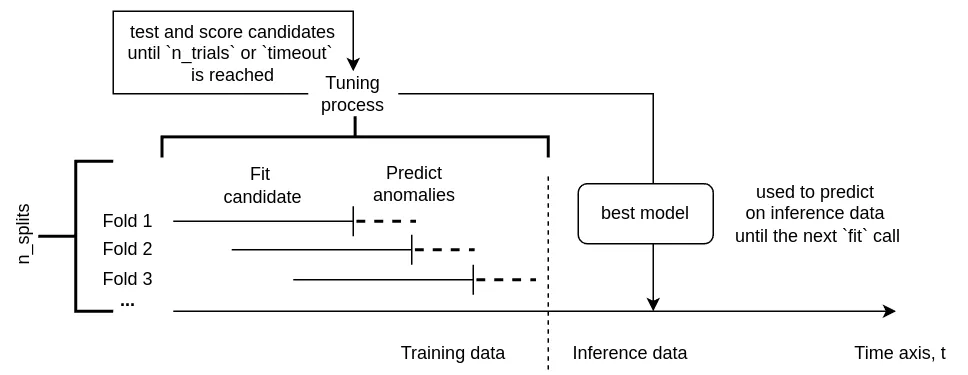
AutoTuned #
Tuning hyperparameters
of a model can be tricky and often requires in-depth knowledge of Machine Learning or underlying model specific. AutoTunedModel wrapper is designed specifically to take off the cognitive load from the user, allowing any of built-in models below to be re-tuned for best hyperparameters on data seen during each fit phase of the algorithm - specify as little as anomaly_percentage param from [0, 0.5) interval and tuned_model_class (i.e.
zscore
) to get it working with best settings that match your expectations.
Using autotune on tuned_model_class if run on a
query
that returns more than 1 timeseries, will result in one model per each unique labelset with probably different hyperparameters
found for each of them. This is useful for further context separation in contrast to using tuned_model_class directly, which will result in the same amount of models as there are timeseries returned by the query, but with the same hyperparameters for each of them. E.g.
      models:
  # this may result in 1 model per each unique labelset with different hyperparameters, such as z_threshold
  autotuned_model:
    class: 'auto'
    tuned_class_name: 'zscore_online'
    optimization_params:
      anomaly_percentage: 0.01
    queries: ['your_query']
will produce one model per each unique labelset found in your_query results, with different hyperparameters, such as z_threshold, while
      models:
  # this will result in 1 model per each timeseries returned by the query,
  # with the same hyperparameters, such as z_threshold
  zscore_model:
    class: 'zscore_online'
    z_threshold: 3  # all models will have the same z_threshold, but different parameters, such as mean, std, etc.
    queries: ['your_query']
will produce one model per each timeseries returned by your_query, with the same hyperparameters, such as z_threshold, but different parameters, such as mean, std, etc.
Parameters specific for vmanomaly:
class(string) - model class name"model.auto.AutoTunedModel"(orautowith class alias support Available from v1.13.0 )tuned_class_name(string) - Built-in model class to wrap, i.e.zscore_onlineoptimization_params(dict) - Optimization parameters for unsupervised model tuning. Control percentage of found anomalies, as well as a tradeoff between time spent and the accuracy. The highertimeoutandn_trialsare, the better model configuration can be found fortuned_class_name, but the longer it takes and vice versa. Setn_jobsto-1to use all the CPUs available, it makes sense if only you have a big dataset to train on duringfitcalls, otherwise overhead isn’t worth it.anomaly_percentage(float) - Expected percentage of anomalies that can be seen in training data, from[0, 0.5)interval (i.e. 0.01 means it’s expected ~ 1% of anomalies to be present in training data). This is a required parameter.optimized_business_params(list[string]) - Available from v1.15.0 this argument allows particular business-specific parameters such asdetection_directionormin_dev_from_expectedto remain unchanged during optimizations, retaining their initial values. I.e. settingoptimized_business_paramsto['detection_direction']will allow to optimize onlydetection_directionbusiness-specific arg, whilemin_dev_from_expectedwill retain its default value of (e.g. [1, 2] if set to that value in model config). By default and if not set, will be equal to[](empty list), meaning no business params will be optimized. A recommended option is to leave it empty as this feature is still experimental and may lead to unexpected results.seed(int) - Random seed for reproducibility and deterministic nature of underlying optimizations.validation_scheme(string) - Available from v1.25.1 the validation scheme to use for hyperparameter tuning, eitherregular(time-based default) orleaky(regular cross-validation withn_splitsfolds, where each fold is a time-based split of the data). Theleakyscheme is recommended foranomaly_percentage~ 0%, as it allows the model to “see” all the datapoints at least once during the optimization process, which can lead to better results in such cases. Defaults toregular.n_splits(int) - How many folds to create for hyperparameter tuning out of your data. The higher, the longer it takes but the better the results can be. Defaults to 3.train_val_ratio(float) - Available from v1.25.1 the ratio of training to validation data size when constructing folds, e.g. setting it to 2 will result in 2/3 of the data being used for training and 1/3 for validation in each of the splits. Defaults to 3 (3/4 of the data for training and 1/4 for validation). Isn’t used whenvalidation_schemeis set toleaky.n_trials(int) - How many trials to sample from hyperparameter search space. The higher, the longer it takes but the better the results can be. Defaults to 128.timeout(float) - How many seconds in total can be spent on each model to tune hyperparameters. The higher, the longer it takes, allowing to test more trials out of definedn_trials, but the better the results can be.
      # ...
models:
  your_desired_alias_for_a_model:
    class: 'auto'  # or 'model.auto.AutoTunedModel' until v1.13.0
    tuned_class_name: 'zscore_online'
    optimization_params:
      anomaly_percentage: 0.004  # required. i.e. we expect <= 0.4% of anomalies to be present in training data
      seed: 42  # fix reproducibility & determinism
      n_splits: 3  # how much folds are created for internal cross-validation
      validation_scheme: 'regular'  # either 'regular' (time-based default) or 'leaky' (cross-validation with n_splits folds)
      train_val_ratio: 3  # how much training data to use in each fold vs validation, e.g. 3 means 3/4 of the data for fit and 1/4 for infer

      n_trials: 128  # how many configurations to sample from search space during optimization
      timeout: 10  # how many seconds to spend on optimization for each trained model during `fit` phase call
      n_jobs: 1  # how many jobs in parallel to launch. Consider making it > 1 only if you have fit window containing > 10000 datapoints for each series
      optimized_business_params: []  # business-specific params to include in optimization, if not set - defaults to empty list, meaning no business params will be optimized, which is a recommended option as business arguments are better set by stakeholders rather than algorithms
  # ...
There are some expected limitations of Autotune mode:
- It can’t be made on your custom model .
- It can’t be applied to itself (like
tuned_class_name: 'model.auto.AutoTunedModel') AutoTunedModelcan’t be used on rolling models likeRollingQuantilein combination with on-disk model storage mode , as the rolling models exists only duringinfercalls and aren’t persisted neither in RAM, nor on disk.
Prophet #
vmanomaly uses the Facebook Prophet implementation for time series forecasting, with detailed usage provided in the Prophet library documentation
. All original Prophet parameters are supported and can be directly passed to the model via args argument.
ProphetModel is a
univariate
,
offline
model.
Available from v1.25.3
Producing forecasts for future timestamps is now supported. To enable this, set the forecast_at argument to a list of relative future offsets (e.g., ['1h', '1d']). The model will then generate forecasts for these future timestamps, which can be useful for planning and resource allocation. Output series are affected by
provide_series
argument, which need to include at least yhat for point-wise forecasts (and yhat_lower or/and yhat_upper for respective confidence intervals). See the example below for more details.
Parameters specific for vmanomaly:
class(string) - model class name"model.prophet.ProphetModel"(orprophetwith class alias support Available from v1.13.0 )seasonalities(list[dict], optional): Additional seasonal components to include in Prophet. See Prophet’sadd_seasonality()documentation for details.scaleAvailable from v1.18.0 (float): Is used to adjust the margins betweenyhatand [yhat_lower,yhat_upper]. New margin =|yhat_* - yhat_lower| * scale. Defaults to 1 (no scaling is applied). Seescalecommon arg section for detailed instructions and 2-sided option.tz_awareAvailable from v1.18.0 (bool): Enables handling of timezone-aware timestamps. Default isFalse. Should be used withtz_seasonalitiesandtz_use_cyclical_encodingparameters.tz_seasonalitiesAvailable from v1.18.0 (list[dict]): Specifies timezone-aware seasonal components. Requirestz_aware=True. Supported options includeminute,hod(hour of day),dow(day of week), andmonth(month of year). Available from v1.18.2 users can configure additional parameters for each seasonality, such asfourier_order,prior_scale, andmode. For more details, please refer to the Timezone-unaware configuration example below.Available from v1.18.2 the format for
tz_seasonalitieshas been updated to enhance flexibility. Previously, it accepted a list of strings (e.g.,['hod', 'minute']). Now, it follows the same structure as custom seasonalities defined in theseasonalitiesargument (e.g.,{"name": "hod", "fourier_order": 5, "mode": "additive"}). This change is backward-compatible, so older configurations will be automatically converted to the new format using default values.tz_use_cyclical_encodingAvailable from v1.18.0 (bool): If set toTrue, applies cyclical encoding technique to timezone-aware seasonalities. Should be used withtz_aware=Trueandtz_seasonalities.forecast_atAvailable from v1.25.3 (list[str]): Specifies future relative offsets for which forecasts should be generated (e.g.,['1h', '1d']). Works similarly to predict_linear in MetricQL, but with more flexibility and seasonality support - produced series will have the same timestamp as the other output series, but with the forecasted value for the future timestamp. Defaults to[](empty list, meaning no future forecasts are produced). If set,provide_seriesmust include at leastyhatfor point-wise forecasts (andyhat_loweror/andyhat_upperfor respective confidence intervals). For example, ifforecast_atis set to['1h', '1d'], the model will produce forecasts for both the next hour and the next day, and these series can be accessed byyhat_1h,yhat_lower_1h,yhat_upper_1h,yhat_1d,yhat_lower_1d, andyhat_upper_1din the output, respectively. See FAQ for more details.
forecast_at parameter can lead to significant increase in active timeseries if you have a lot of time series returned by your queries, as it will produce additional series for each of the future timestamps specified in forecast_at (optionally multiplied by 1-3 if interval forecasts are included). For example, if you have 1000 time series returned by your query and set forecast_at to [1h, 1d, 1w], and provide_series includes yhat_lower and yhat_upper, it will produce 1000 (series) * 3 (intervals) * 3 (predictions, point + interval) = 9000 additional timeseries. Consider using it only on small subset of metrics (e.g. grouped by host or region) to avoid this issue, as it also proportionally (to the number of forecast_at elements) increases the timings of inference calls.
compressionAvailable from v1.28.1 (dict, optional): Configuration for downsampling input data before fitting the model. Useful for high-frequency data to reduce CPU and RAM/disk load and improve model performance. Thecompressionblock supports the following parameters:window(str, required): Time window for downsampling (e.g., “5m”, “1h”).agg_method(str, optional, default=“mean”): Aggregation function to apply within each window. Supported values: “mean”, “median”.adjust_boundaries(bool, optional, default=true): Whether to adjust confidence interval boundaries after downsampling. If true,yhat_lowerandyhat_upperwill be adjusted based on the aggregated vs original data variability.
Apart from standard
vmanomaly output
, Prophet model can provide additional metrics.
Additional output metrics produced by FB Prophet
Depending on chosen seasonality parameter FB Prophet can return additional metrics such as:
trend,trend_lower,trend_upperadditive_terms,additive_terms_lower,additive_terms_upper,multiplicative_terms,multiplicative_terms_lower,multiplicative_terms_upper,daily,daily_lower,daily_upper,hourly,hourly_lower,hourly_upper,holidays,holidays_lower,holidays_upper,- and a number of columns for each holiday if
holidaysparam is set
Config Example
Timezone-unaware example:
      models:
  your_desired_alias_for_a_model:
    class: 'prophet'  # or 'model.prophet.ProphetModel' until v1.13.0
    provide_series: ['anomaly_score', 'yhat', 'yhat_lower', 'yhat_upper', 'trend']
    # Common arguments for built-in model, if not set, default to
    # See https://docs.victoriametrics.com/anomaly-detection/components/models/#common-args
    #
    # provide_series: ['anomaly_score', 'yhat', 'yhat_lower', 'yhat_upper', 'trend']
    # schedulers: [all scheduler aliases defined in `scheduler` section]
    # queries: [all query aliases defined in `reader.queries` section]
    # detection_direction: 'both'  # meaning both drops and spikes will be captured
    # min_dev_from_expected: [0.0, 0.0]  # meaning, no minimal threshold is applied to prevent smaller anomalies
    # scale: [1.0, 1.0]  # if needed, prediction intervals' width can be increased (>1) or narrowed (<1)
    # clip_predictions: False  # if data_range for respective `queries` is set in reader, `yhat.*` columns will be clipped
    # anomaly_score_outside_data_range: 1.01  # auto anomaly score (1.01) if `y` (real value) is outside of data_range, if set
    seasonalities:
      - name: 'hourly'
        period: 0.04166666666
        fourier_order: 30
        prior_scale: 20
    compression:  # downsample input data to reduce CPU/RAM load
      window: '30m'  # downsample to 30-minute intervals
      agg_method: 'mean'  # use mean aggregation within each window
      adjust_boundaries: true  # adjust yhat_lower/yhat_upper after downsampling
    # inner model args (key-value pairs) accepted by
    # https://facebook.github.io/prophet/docs/quick_start#python-api
    args:
      interval_width: 0.98  # see https://facebook.github.io/prophet/docs/uncertainty_intervals
      country_holidays: 'US'
Timezone-aware example:
      models:
  your_desired_alias_for_a_model:
    class: 'prophet'  # or 'model.prophet.ProphetModel' until v1.13.0
    provide_series: ['anomaly_score', 'yhat', 'yhat_lower', 'yhat_upper', 'trend']
    # Common arguments for built-in model, if not set, default to
    # See https://docs.victoriametrics.com/anomaly-detection/components/models/#common-args
    #
    # provide_series: ['anomaly_score', 'yhat', 'yhat_lower', 'yhat_upper', 'trend']
    # schedulers: [all scheduler aliases defined in `scheduler` section]
    # queries: [all query aliases defined in `reader.queries` section]
    # detection_direction: 'both'  # meaning both drops and spikes will be captured
    # min_dev_from_expected: [0.0, 0.0]  # meaning, no minimal threshold is applied to prevent smaller anomalies
    # scale: [1.0, 1.0]  # if needed, prediction intervals' width can be increased (>1) or narrowed (<1)
    # clip_predictions: False  # if data_range for respective `queries` is set in reader, `yhat.*` columns will be clipped
    # anomaly_score_outside_data_range: 1.01  # auto anomaly score (1.01) if `y` (real value) is outside of data_range, if set
    tz_aware: True
    tz_use_cyclical_encoding: True
    tz_seasonalities: # intra-day + intra-week seasonality, no intra-year / sub-hour seasonality
      - name: 'hod'  # intra-day seasonality, hour of the day
        fourier_order: 5  # keep it 3-8 based on intraday pattern complexity
        prior_scale: 10
      - name: 'dow'  # intra-week seasonality, time of the week
        fourier_order: 2  # keep it 2-4, as dependencies are learned separately for each weekday
    compression:  # downsample input data to reduce CPU/RAM load
      window: '30m'  # downsample to 30-minute intervals
      agg_method: 'mean'  # use mean aggregation within each window
      adjust_boundaries: true  # adjust yhat_lower/yhat_upper after downsampling
    # inner model args (key-value pairs) accepted by
    # https://facebook.github.io/prophet/docs/quick_start#python-api
    args:
      interval_width: 0.98  # see https://facebook.github.io/prophet/docs/uncertainty_intervals
      country_holidays: 'US'
Resulting metrics of the model are described here
Online Z-score #
OnlineZscoreModel is a
univariate
,
online
model.
Online version of existing Z-score implementation with the same exact behavior and implications Available from v1.15.0 .
Parameters specific for vmanomaly:
class(string) - model class name"model.online.OnlineZscoreModel"(orzscore_onlinewith class alias support Available from v1.13.0 )z_threshold(float, optional) - standard score for calculation boundaries and anomaly score. Defaults to2.5.min_n_samples_seen(int, optional) - the minimum number of samples to be seen (n_samples_seen_property) before computing the anomaly score. Otherwise, the anomaly score will be 0, as there is not enough data to trust the model’s predictions. Defaults to 16.
Config Example
      models:
  your_desired_alias_for_a_model:
    class: "zscore_online"  # or 'model.online.OnlineZscoreModel'
    z_threshold: 3.5
    min_n_samples_seen: 128  # i.e. calculate it as full seasonality / data freq
    provide_series: ['anomaly_score', 'yhat']  # common arg example
    # Common arguments for built-in model, if not set, default to
    # See https://docs.victoriametrics.com/anomaly-detection/components/models/#common-args
    #
    # provide_series: ['anomaly_score', 'yhat', 'yhat_lower', 'yhat_upper']
    # schedulers: [all scheduler aliases defined in `scheduler` section]
    # queries: [all query aliases defined in `reader.queries` section]
    # detection_direction: 'both'  # meaning both drops and spikes will be captured
    # min_dev_from_expected: [0.0, 0.0]  # meaning, no minimal threshold is applied to prevent smaller anomalies
    # scale: [1.0, 1.0]  # if needed, prediction intervals' width can be increased (>1) or narrowed (<1)
    # clip_predictions: False  # if data_range for respective `queries` is set in reader, `yhat.*` columns will be clipped
    # anomaly_score_outside_data_range: 1.01  # auto anomaly score (1.01) if `y` (real value) is outside of data_range, if set
Resulting metrics of the model are described here .
Online MAD #
OnlineMADModel is a
univariate
,
online
model.
The MAD model is a robust method for anomaly detection that is less sensitive to outliers in data compared to standard deviation-based models. It considers a point as an anomaly if the absolute deviation from the median is significantly large. This is the online approximate version, based on t-digests for online quantile estimation Available from v1.15.0 .
Parameters specific for vmanomaly:
class(string) - model class name"model.online.OnlineMADModel"(ormad_onlinewith class alias support Available from v1.13.0 )threshold(float, optional) - The threshold multiplier for the MAD to determine anomalies. Defaults to2.5. Higher values will identify fewer points as anomalies.min_n_samples_seen(int, optional) - the minimum number of samples to be seen (n_samples_seen_property) before computing the anomaly score. Otherwise, the anomaly score will be 0, as there is not enough data to trust the model’s predictions. Defaults to 16.compression(int, optional) - the compression parameter for underlying t-digest . Higher values mean higher accuracy but higher memory usage. By default 100.
Config Example
      models:
  your_desired_alias_for_a_model:
    class: "mad_online"  # or 'model.online.OnlineMADModel'
    threshold: 2.5
    min_n_samples_seen: 128  # i.e. calculate it as full seasonality / data freq
    compression: 100  # higher values mean higher accuracy but higher memory usage
    provide_series: ['anomaly_score', 'yhat']  # common arg example
    # Common arguments for built-in model, if not set, default to
    # See https://docs.victoriametrics.com/anomaly-detection/components/models/#common-args
    #
    # provide_series: ['anomaly_score', 'yhat', 'yhat_lower', 'yhat_upper']
    # schedulers: [all scheduler aliases defined in `scheduler` section]
    # queries: [all query aliases defined in `reader.queries` section]
    # detection_direction: 'both'  # meaning both drops and spikes will be captured
    # min_dev_from_expected: [0.0, 0.0]  # meaning, no minimal threshold is applied to prevent smaller anomalies
    # scale: [1.0, 1.0]  # if needed, prediction intervals' width can be increased (>1) or narrowed (<1)
    # clip_predictions: False  # if data_range for respective `queries` is set in reader, `yhat.*` columns will be clipped
    # anomaly_score_outside_data_range: 1.01  # auto anomaly score (1.01) if `y` (real value) is outside of data_range, if set
Resulting metrics of the model are described here .
Rolling Quantile #
RollingQuantileModel is
Available from v1.28.0
a
univariate
,
online
model. It was
Deprecated from v1.28.0
a
univariate
,
rolling
,
offline
model.
This model is best used on data with short evolving patterns (i.e. 10-100 datapoints of particular frequency), as it adapts to changes over a rolling window.
Parameters specific for vmanomaly:
class(string) - model class name"model.rolling_quantile.RollingQuantileModel"(orrolling_quantilewith class alias support Available from v1.13.0 )quantile(float) - quantile value, from 0.5 to 1.0. This constraint is implied by 2-sided confidence interval.window_steps(integer) - size of the moving window. (see ‘sampling_period’)
Config Example
      models:
  your_desired_alias_for_a_model:
    class: "rolling_quantile"
    quantile: 0.9
    window_steps: 96
    # Common arguments for built-in model, if not set, default to
    # See https://docs.victoriametrics.com/anomaly-detection/components/models/#common-args
    #
    # provide_series: ['anomaly_score', 'yhat', 'yhat_lower', 'yhat_upper']
    # schedulers: [all scheduler aliases defined in `scheduler` section]
    # queries: [all query aliases defined in `reader.queries` section]
    # detection_direction: 'both'  # meaning both drops and spikes will be captured
    # min_dev_from_expected: [0.0, 0.0]  # meaning, no minimal threshold is applied to prevent smaller anomalies
    # scale: [1.0, 1.0]  # if needed, prediction intervals' width can be increased (>1) or narrowed (<1)
    # clip_predictions: False  # if data_range for respective `queries` is set in reader, `yhat.*` columns will be clipped
    # anomaly_score_outside_data_range: 1.01  # auto anomaly score (1.01) if `y` (real value) is outside of data_range, if set
Resulting metrics of the model are described here .
Online Seasonal Quantile #
OnlineQuantileModel is a
univariate
,
online
model.
Online (seasonal) quantile utilizes a set of approximate distributions, based on t-digests for online quantile estimation Available from v1.15.0 .
Best used on de-trended
data with strong (potentially multiple) seasonalities
. Can act as a (slightly less flexible) replacement to
ProphetModel
.
It uses the quantiles triplet to calculate yhat_lower, yhat, and yhat_upper
output
, respectively, for each of the min_subseasons sub-intervals contained in seasonal_interval. For example, with ‘4d’ + ‘2h’ seasonality patterns (multiple), it will hold and update 24*4 / 2 = 48 consecutive estimates (each 2 hours long).
Parameters specific for vmanomaly:
class(string) - model class name"model.online.OnlineQuantileModel"(orquantile_onlinewith class alias support Available from v1.13.0 )quantiles(list[float], optional) - The quantiles to estimate.yhat_lower,yhat,yhat_upperare the quantile order. By default (0.01, 0.5, 0.99).iqr_threshold(float, optional) - Available from v1.25.0 The interquartile range (IQR) multiplier to increase the width of the prediction intervals. Defaults to 0 (no adjustment) for backward compatibility. If set > 0, the model will add IQR *iqr_thresholdtoyhat_lowerandyhat_upper(respectingmin_subseasonseasonal buckets). This is useful for data with high variance or outliers, as it helps to avoid false positives in anomaly detection. Best used with robustquantilesset to (0.25, 0.5, 0.75) or similar.seasonal_interval(string, optional) - the interval for the seasonal adjustment. If not set, the model will equal to a simple online quantile model. By default not set.min_subseason(str, optional) - the minimum interval to estimate quantiles for. By default not set. Note that the minimum interval should be a multiple of the seasonal interval, i.e. if seasonal_interval=‘2h’, then min_subseason=‘15m’ is valid, but ‘37m’ is not.use_transform(bool, optional) - whether to internally apply alog1p(abs(x)) * sign(x)transformation to the data to stabilize internal quantile estimation. Does not affect the scale of produced output (i.e.yhat) By default False.global_smoothing(float, optional) - the smoothing parameter for the global quantiles. i.e. the output is a weighted average of the global and seasonal quantiles (ifseasonal_intervalandmin_subseasonargs are set). Should be from[0, 1]interval, where 0 means no smoothing and 1 means using only global quantile values.scale(float, optional) - Is used to adjust the margins betweenyhatand [yhat_lower,yhat_upper]. New margin =|yhat_* - yhat_lower| * scale. Defaults to 1 (no scaling is applied). Seescalecommon arg section for detailed instructions and 2-sided option.season_starts_from(str, optional) - the start date for the seasonal adjustment, as a reference point to start counting the intervals. By default ‘1970-01-01’.min_n_samples_seen(int, optional) - the minimum number of samples to be seen (n_samples_seen_property) before computing the anomaly score. Otherwise, the anomaly score will be 0, as there is not enough data to trust the model’s predictions. Defaults to 16.compression(int, optional) - the compression parameter for the underlying t-digests . Higher values mean higher accuracy but higher memory usage. By default 100.
Config Example
Suppose we have a data with strong intra-day (hourly) and intra-week (daily) seasonality, data granularity is ‘5m’ with up to 5% expected outliers present in data. Then you can apply similar config:
      models:
  your_desired_alias_for_a_model:
    class: "quantile_online"  # or 'model.online.OnlineQuantileModel'
    quantiles: [0.25, 0.5, 0.75]  # lowered to exclude anomalous edges, can be compensated by `scale` param > 1 and `iqr_threshold` > 0
    iqr_threshold: 2.5  # to increase prediction intervals' width to avoid false positives while still keeping the model robust
    seasonal_interval: '7d'  # longest seasonality (week, day) = week, starting from `season_starts_from`
    min_subseason: '1h'  # smallest seasonality (week, day, hour) = hour, will have its own quantile estimates
    min_n_samples_seen: 288 # 1440 / 5 - at least 1 full day, ideal = 1440 / 5 * 7 - one full week (seasonal_interval)
    scale: 1.1  # to compensate lowered quantile boundaries with wider intervals
    season_starts_from: '2024-01-01'  # interval calculation starting point, especially for uncommon seasonalities like '36h' or '12d'
    compression: 100  # higher values mean higher accuracy but higher memory usage
    provide_series: ['anomaly_score', 'yhat']  # common arg example
    # Common arguments for built-in model, if not set, default to
    # See https://docs.victoriametrics.com/anomaly-detection/components/models/#common-args
    #
    # provide_series: ['anomaly_score', 'yhat', 'yhat_lower', 'yhat_upper']
    # schedulers: [all scheduler aliases defined in `scheduler` section]
    # queries: [all query aliases defined in `reader.queries` section]
    # detection_direction: 'both'  # meaning both drops and spikes will be captured
    # min_dev_from_expected: [0.0, 0.0]  # meaning, no minimal threshold is applied to prevent smaller anomalies
    # scale: [1.0, 1.0]  # if needed, prediction intervals' width can be increased (>1) or narrowed (<1)
    # clip_predictions: False  # if data_range for respective `queries` is set in reader, `yhat.*` columns will be clipped
    # anomaly_score_outside_data_range: 1.01  # auto anomaly score (1.01) if `y` (real value) is outside of data_range, if set
Resulting metrics of the model are described here .
Seasonal Trend Decomposition #
StdModel is
Available from v1.28.0
a
univariate
,
online
model. It was
Deprecated from v1.28.0
a
univariate
,
rolling
,
offline
model.
Here we use Seasonal Decompose implementation from statsmodels library
. Parameters from this library can be passed to the model. Some parameters are specifically predefined in vmanomaly and can’t be changed by user (model=‘additive’, two_sided=False).
Parameters specific for vmanomaly:
class(string) - model class name"model.std.StdModel"(orstdwith class alias support Available from v1.13.0 )period(integer) - Number of datapoints in one season.z_threshold(float, optional) - standard score for calculating boundaries to define anomaly score. Defaults to2.5.
Config Example
      models:
  your_desired_alias_for_a_model:
    class: "std"  # or 'model.std.StdModel' starting from v1.13.0
    period: 2
    # Common arguments for built-in model, if not set, default to
    # See https://docs.victoriametrics.com/anomaly-detection/components/models/#common-args
    #
    # provide_series: ['anomaly_score', 'yhat', 'yhat_lower', 'yhat_upper']
    # schedulers: [all scheduler aliases defined in `scheduler` section]
    # queries: [all query aliases defined in `reader.queries` section]
    # detection_direction: 'both'  # meaning both drops and spikes will be captured
    # min_dev_from_expected: [0.0, 0.0]  # meaning, no minimal threshold is applied to prevent smaller anomalies
    # scale: [1.0, 1.0]  # if needed, prediction intervals' width can be increased (>1) or narrowed (<1)
    # clip_predictions: False  # if data_range for respective `queries` is set in reader, `yhat.*` columns will be clipped
    # anomaly_score_outside_data_range: 1.01  # auto anomaly score (1.01) if `y` (real value) is outside of data_range, if set
Resulting metrics of the model are described here .
Additional output metrics produced by Seasonal Trend Decomposition model
resid- The residual component of the data series.trend- The trend component of the data series.seasonal- The seasonal component of the data series.
Isolation forest (Multivariate) #
IsolationForestModel is a
univariate
,
offline
model.
IsolationForestMultivariateModel is a
multivariate
,
offline
model.
Detects anomalies using binary trees. The algorithm has a linear time complexity and a low memory requirement, which works well with high-volume data. It can be used on both univariate and multivariate data, but it is more effective in multivariate case.
Important: Be aware of the curse of dimensionality . Don’t use single multivariate model if you expect your queries to return many time series of less datapoints that the number of metrics. In such case it is hard for a model to learn meaningful dependencies from too sparse data hypercube.
Here we use Isolation Forest implementation from scikit-learn library
. All parameters from this library can be passed to the model.
Parameters specific for vmanomaly:
class(string) - model class name"model.isolation_forest.IsolationForestMultivariateModel"(orisolation_forest_multivariatewith class alias support Available from v1.13.0 )contamination(float or string, optional) - The amount of contamination of the data set, i.e. the proportion of outliers in the data set. Used when fitting to define the threshold on the scores of the samples. Default value - “auto”. Should be either"auto"or be in the range (0.0, 0.5]. Available from v1.29.5 Numeric strings, such as"0.01", are accepted, while invalid non-finite values, such asnan,inf, and-inf, are rejected during config validation.seasonal_features(list of string) - List of seasonality to encode through cyclical encoding , i.e.dow(day of week). Introduced in 1.12.0 .- Empty by default for backward compatibility.
- Example:
seasonal_features: ['dow', 'hod']. - Supported seasonalities:
- “minute” - minute of hour (0-59)
- “hod” - hour of day (0-23)
- “dow” - day of week (1-7)
- “month” - month of year (1-12)
args(dict, optional) - Inner model args (key-value pairs). See accepted params in model documentation . Defaults to empty (not provided). Example: {“random_state”: 42, “n_estimators”: 100}
Config Example
      models:
  your_desired_alias_for_a_model:
    # To use univariate model, substitute class argument with "model.isolation_forest.IsolationForestModel".
    class: "isolation_forest_multivariate" # or 'model.isolation_forest.IsolationForestMultivariateModel' until v1.13.0
    contamination: "0.01"
    provide_series: ['anomaly_score']
    seasonal_features: ['dow', 'hod']
    args:
      n_estimators: 100
      # i.e. to assure reproducibility of produced results each time model is fit on the same input
      random_state: 42
    # Common arguments for built-in model, if not set, default to
    # See https://docs.victoriametrics.com/anomaly-detection/components/models/#common-args
    #
    # provide_series: ['anomaly_score', 'yhat', 'yhat_lower', 'yhat_upper']
    # schedulers: [all scheduler aliases defined in `scheduler` section]
    # queries: [all query aliases defined in `reader.queries` section]
    # anomaly_score_outside_data_range: 1.01  # auto anomaly score (1.01) if `y` (real value) is outside of data_range, if set
Resulting metrics of the model are described here .
Holt-Winters #
HoltWinters is a
univariate
,
offline
model.
Here we use Holt-Winters Exponential Smoothing implementation from statsmodels library
. All parameters from this library can be passed to the model.
Parameters specific for vmanomaly:
class(string) - model class name"model.holtwinters.HoltWinters"(orholtwinterswith class alias support Available from v1.13.0 )frequency(string) - Must be set equal to sampling_period. Model needs to know expected data-points frequency (e.g. ‘10m’). If omitted, frequency is guessed during fitting as the median of intervals between fitting data timestamps. During inference, if incoming data doesn’t have the same frequency, then it will be interpolated. E.g. data comes at 15 seconds resolution, and our resample_freq is ‘1m’. Then fitting data will be downsampled to ‘1m’ and internal model is trained at ‘1m’ intervals. So, during inference, prediction data would be produced at ‘1m’ intervals, but interpolated to “15s” to match with expected output, as output data must have the same timestamps. As accepted by pandas.Timedelta (e.g. ‘5m’).seasonality(string, optional) - As accepted by pandas.Timedelta.If
seasonal_periodsis not specified, it is calculated asseasonality/frequencyUsed to compute “seasonal_periods” param for the model (e.g. ‘1D’ or ‘1W’).z_threshold(float, optional) - standard score for calculating boundaries to define anomaly score. Defaults to 2.5.
Default model parameters:
If parameter
seasonalis not specified, default value will beadd.If parameter
initialization_methodis not specified, default value will beestimated.args(dict, optional) - Inner model args (key-value pairs). See accepted params in model documentation . Defaults to empty (not provided). Example: {“seasonal”: “add”, “initialization_method”: “estimated”}
Config Example
      models:
  your_desired_alias_for_a_model:
    class: "holtwinters"  # or 'model.holtwinters.HoltWinters' until v1.13.0
    seasonality: '1d'
    frequency: '1h'
    # Inner model args (key-value pairs) accepted by statsmodels.tsa.holtwinters.ExponentialSmoothing
    args:
      seasonal: 'add'
      initialization_method: 'estimated'
    # Common arguments for built-in model, if not set, default to
    # See https://docs.victoriametrics.com/anomaly-detection/components/models/#common-args
    #
    # provide_series: ['anomaly_score', 'yhat', 'yhat_lower', 'yhat_upper']
    # schedulers: [all scheduler aliases defined in `scheduler` section]
    # queries: [all query aliases defined in `reader.queries` section]
    # detection_direction: 'both'  # meaning both drops and spikes will be captured
    # min_dev_from_expected: [0.0, 0.0]  # meaning, no minimal threshold is applied to prevent smaller anomalies
    # scale: [1.0, 1.0]  # if needed, prediction intervals' width can be increased (>1) or narrowed (<1)
    # clip_predictions: False  # if data_range for respective `queries` is set in reader, `yhat.*` columns will be clipped
    # anomaly_score_outside_data_range: 1.01  # auto anomaly score (1.01) if `y` (real value) is outside of data_range, if set
Resulting metrics of the model are described here .
vmanomaly output #
When vmanomaly is executed, it generates various metrics, the specifics of which depend on the model employed.
These metrics can be renamed in the writer’s section.
The default metrics produced by vmanomaly include:
anomaly_score: This is the primary metric.- It is designed in such a way that values from 0.0 to 1.0 indicate non-anomalous data.
- A value greater than 1.0 is generally classified as an anomaly, although this threshold can be adjusted in the alerting configuration.
- The decision to set the changepoint at 1 was made to ensure consistency across various models and alerting configurations, such that a score above 1 consistently signifies an anomaly.
yhat: This represents the predicted expected value.yhat_lower: This indicates the predicted lower boundary.yhat_upper: This refers to the predicted upper boundary.y: This is the original value obtained from the query result.
Important: Be aware that if NaN (Not a Number) or Inf (Infinity) values are present in the input data during infer model calls, the model will produce NaN as the anomaly_score for these particular instances.
vmanomaly monitoring metrics #
Each model exposes
several monitoring metrics
to its health_path endpoint:
Custom Model Guide #
Apart from vmanomaly
built-in models
, users can create their own custom models for anomaly detection.
Here in this guide, we will
- Make a file containing our custom model definition
- Define VictoriaMetrics Anomaly Detection config file to use our custom model
- Run service
The file containing the model should be written in Python language (3.12+)
1. Custom model #
By default, each custom model is created as
univariate
model. If you want to override this behavior, define models having is_multivariate class argument set to True (please refer to the code example below).
We’ll create custom_model.py file with CustomModel class that will inherit from vmanomaly’s Model base class.
In the CustomModel class, the following methods are required: - __init__, fit, infer, serialize and deserialize:
__init__method should initiate parameters for the model.if your model relies on configs that have
argkey-value pair argument, like Prophet , do not forget to use Python’s**kwargsin method’s signature and to explicitly callsuper().__init__(**kwargs)to initialize the base class each model derives from
fitmethod should contain the model training process.infershould return Pandas.DataFrame object with model’s inferences.serializemethod that saves the model on disk.deserializeload the saved model from disk.
For the sake of simplicity, the model in this example will return one of two values of anomaly_score - 0 or 1 depending on input parameter percentage.
      import numpy as np
import pandas as pd
import scipy.stats as st
import logging
from pickle import dumps

from model.model import (
  PICKLE_PROTOCOL,
  Model,
  deserialize_basic
)
# from model.model import RollingModel  # inherit from it for your model to be of rolling type
logger = logging.getLogger(__name__)


class CustomModel(Model):
  """
  Custom model implementation.
  """
  # by default, each `Model` will be created as a univariate one
  # uncomment line below for it to be of multivariate type
  # is_multivariate = True
  # by default, each `Model` will be created as offline
  # uncomment line below for it to be of type online
  # is_online = True

  def __init__(self, percentage: float = 0.95, **kwargs):
    super().__init__(**kwargs)
    self.percentage = percentage
    self._mean = np.nan
    self._std = np.nan

  def fit(self, df: pd.DataFrame):
    # Model fit process:
    y = df['y']
    self._mean = np.mean(y)
    self._std = np.std(y)
    if self._std == 0.0:
      self._std = 1 / 65536

  def infer(self, df: pd.DataFrame) -> np.array:
    # Inference process:
    y = df['y']
    zscores = (y - self._mean) / self._std
    anomaly_score_cdf = st.norm.cdf(np.abs(zscores))
    df_pred = df[['timestamp', 'y']].copy()
    df_pred['anomaly_score'] = anomaly_score_cdf > self.percentage
    df_pred['anomaly_score'] = df_pred['anomaly_score'].astype('int32', errors='ignore')

    return df_pred

    def serialize(self) -> None:
      return dumps(self, protocol=PICKLE_PROTOCOL)

    @staticmethod
    def deserialize(model: str | bytes) -> 'CustomModel':
      return deserialize_basic(model)
2. Configuration file #
Next, we need to create config.yaml file with vmanomaly configuration and model input parameters.
In the config file’s models section we need to set our model class to model.custom.CustomModel (or custom with class alias support
Available from v1.13.0
) and define all parameters used in __init__ method.
You can find out more about configuration parameters in vmanomaly
config docs
.
      schedulers:
  s1:
    class: "periodic"
    infer_every: "1m"
    fit_every: "1m"
    fit_window: "1d"

models:
  custom_model:
    class: "custom"  # or 'model.model.CustomModel' until v1.13.0
    percentage: 0.9

reader:
  datasource_url: "http://victoriametrics:8428/"
  sampling_period: '1m'
  queries:
    ingestion_rate:
      expr: 'sum(rate(vm_rows_inserted_total)) by (type)'
    churn_rate:
      expr: 'sum(rate(vm_new_timeseries_created_total[5m]))'

writer:
  datasource_url: "http://victoriametrics:8428/"
  metric_format:
    __name__: "custom_$VAR"
    for: "$QUERY_KEY"
    run: "test-format"

monitoring:
  # /metrics server.
  pull:
    port: 8080
  push:
    url: "http://victoriametrics:8428/"
    extra_labels:
      job: "vmanomaly-develop"
      config: "custom.yaml"
3. Running custom model #
Let’s pull the docker image for vmanomaly:
docker pull victoriametrics/vmanomaly:v1.29.7
Now we can run the docker container putting as volumes both config and model file:
place the model file to /model/custom.py path when copying
./custom_model.py:/vmanomaly/model/custom.py
      docker run -it \
-v $(PWD)/license:/license \
-v $(PWD)/custom_model.py:/vmanomaly/model/custom.py \
-v $(PWD)/custom.yaml:/config.yaml \
victoriametrics/vmanomaly:v1.29.7 /config.yaml \
--licenseFile=/license
--watch
Please find more detailed instructions (license, etc.) here
Output #
As the result, this model will return metric with labels, configured previously in config.yaml.
In this particular example, 2 metrics will be produced. Also, there will be added other labels from input query result.
      {__name__="custom_anomaly_score", for="ingestion_rate", model_alias="custom_model", scheduler_alias="s1", run="test-format"},
{__name__="custom_anomaly_score", for="churn_rate",     model_alias="custom_model", scheduler_alias="s1", run="test-format"}
Deprecations #
Here is a list of all deprecated model types and specific models with respective version info and suggestions for migration.
Deprecated types #
Rolling models - starting from v1.28.0 all rolling models are deprecated in favor of their online counterparts with respective documentation adjustments. Now every model class is non-rolling .
Rolling Models #
Rolling models as a class were deprecated
Deprecated from v1.28.0
in favor of
online models
, which provide similar benefits with additional advantages. Respective rolling models are refactored into online models (e.g.,
RollingQuantile
). Existing configurations that use rolling models’ aliases will continue to function, with less limitations (e.g. no constraint on fit_every == infer_every). Description below is kept for older deployments and hyperlinks consistency.
A rolling model is a model that, once trained, cannot be (naturally) used to make inference on data, not seen during its fit phase.
An instance of rolling model is simultaneously fit and used for inference during its infer method call.
As a result, such model instances are not stored between consecutive re-fit calls (defined by fit_every
arg
in PeriodicScheduler), leading to lower RAM consumption.
Such models put more pressure on your reader’s source, i.e. if your model should be fit on large amount of data (say, 14 days with 1-minute resolution) and at the same time you have frequent inference (say, once per minute) on new chunks of data - that’s because such models require (fit + infer) window of data to be fit first to be used later in each inference call.
Rolling models require fit_every to be either unset or explicitly set equal to infer_every in
PeriodicScheduler
.
Examples: RollingQuantile , prior to v1.28.0 where it become online model.
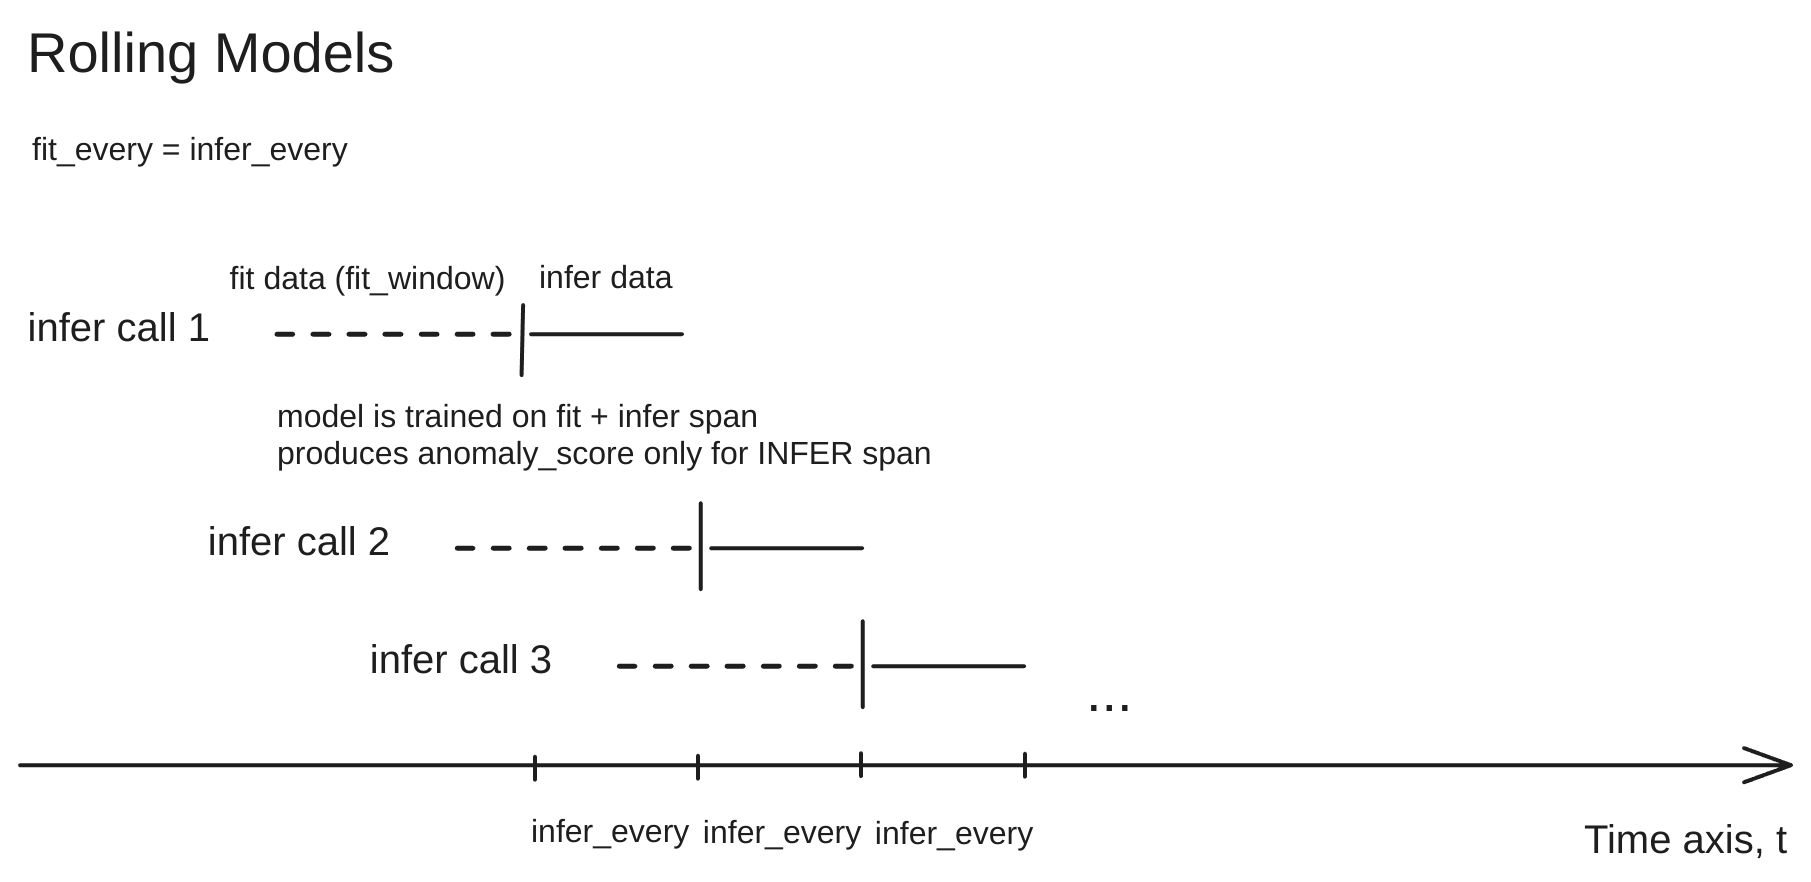
Non-Rolling Models #
The section is moved to deprecations as Every model class is now
Available from v1.28.0
non-rolling. Configurations that used rolling models’ aliases will continue to function, with less limitations (e.g. no constraint on fit_every == infer_every). Description below is kept for older deployments and hyperlinks consistency.
Everything that is not classified as rolling .
Produced models can be explicitly used to infer on data, not seen during its fit phase, thus, it doesn’t require re-fit procedure.
Such models put less pressure on your reader’s source, i.e. if you fit on large amount of data (say, 14 days with 1-minute resolution) but do it occasionally (say, once per day), at the same time you have frequent inference(say, once per minute) on new chunks of data
However, it’s still highly recommended, to keep your model up-to-date with tendencies found in your data as it evolves in time.
Produced model instances are stored in-memory between consecutive re-fit calls (defined by fit_every
arg
in PeriodicScheduler), leading to higher RAM consumption.
Examples: Prophet
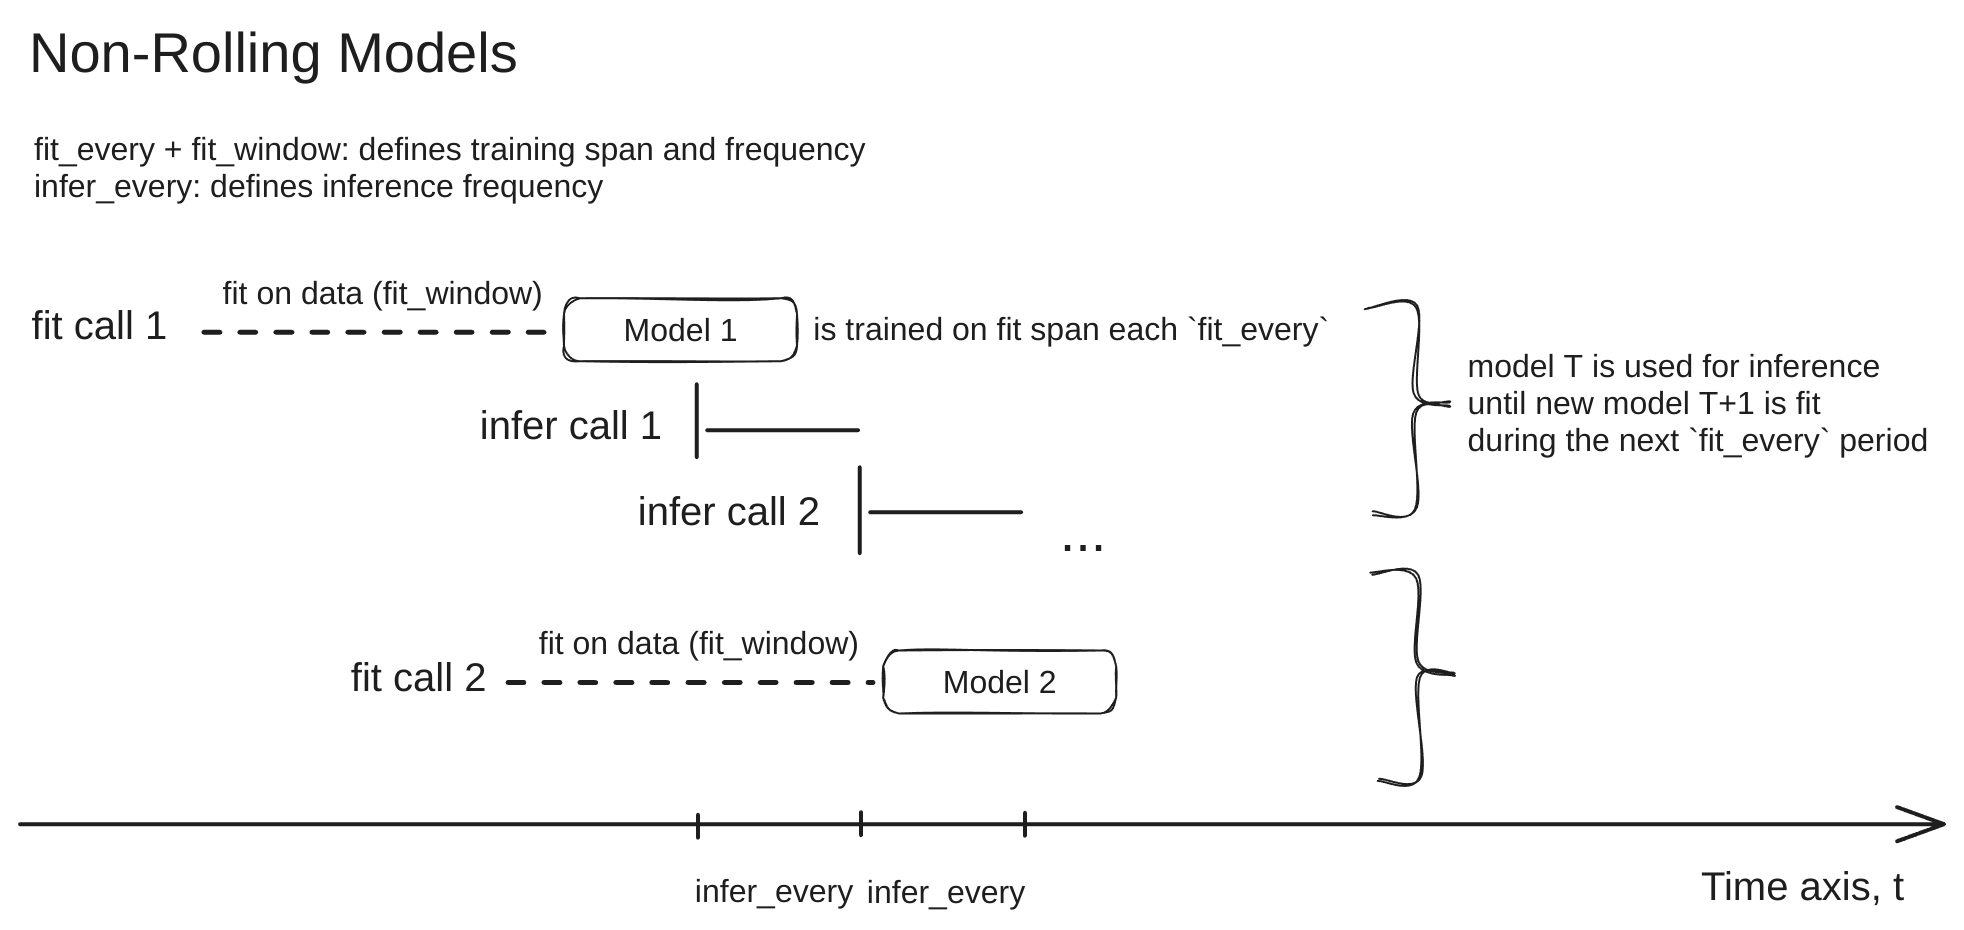
Deprecated models #
Z-score #
ZScoreModel is a
univariate
,
offline
model.
Deprecated from v1.28.4
Was removed in favor of its online version to improve data efficiency and reduce user confusion. Configs that used this model (where model’s class is zscore or model.zscore.ZscoreModel) will continue to work, with a warning raised while actually changed to the online version under the hood. Suggestion is to replace it with zscore_online or model.online.OnlineZscoreModel class explicitly to get
online model benefits
for data querying by reducing fit_every frequency.
Model is useful for initial testing and for simpler data (de-trended data without strict seasonality and with anomalies of similar magnitude as your “normal” data).
Parameters specific for vmanomaly:
class(string) - model class name"model.zscore.ZscoreModel"(orzscorewith class alias support Available from v1.13.0 )z_threshold(float, optional) - standard score for calculation boundaries and anomaly score. Defaults to2.5.
Config Example
      models:
  your_desired_alias_for_a_model:
    class: "zscore"  # or 'model.zscore.ZscoreModel' until v1.13.0
    z_threshold: 3.5
    # Common arguments for built-in model, if not set, default to
    # See https://docs.victoriametrics.com/anomaly-detection/components/models/#common-args
    #
    # provide_series: ['anomaly_score', 'yhat', 'yhat_lower', 'yhat_upper']
    # schedulers: [all scheduler aliases defined in `scheduler` section]
    # queries: [all query aliases defined in `reader.queries` section]
    # detection_direction: 'both'  # meaning both drops and spikes will be captured
    # min_dev_from_expected: [0.0, 0.0]  # meaning, no minimal threshold is applied to prevent smaller anomalies
    # scale: [1.0, 1.0]  # if needed, prediction intervals' width can be increased (>1) or narrowed (<1)
    # clip_predictions: False  # if data_range for respective `queries` is set in reader, `yhat.*` columns will be clipped
    # anomaly_score_outside_data_range: 1.01  # auto anomaly score (1.01) if `y` (real value) is outside of data_range, if set
Resulting metrics of the model are described here .
MAD (Median Absolute Deviation) #
MADModel is a
univariate
,
offline
model.
Deprecated from v1.28.4
Was removed in favor of its online version to improve data efficiency and reduce user confusion. Configs that used this model (where model’s class is mad or model.mad.MADModel) will continue to work, with a warning raised while actually changed to the online version under the hood. Suggestion is to replace it with mad_online or model.online.OnlineMADModel class explicitly to get
online model benefits
for data querying by reducing fit_every frequency.
The MAD model is a robust method for anomaly detection that is less sensitive to outliers in data compared to standard deviation-based models. It considers a point as an anomaly if the absolute deviation from the median is significantly large.
Parameters specific for vmanomaly:
class(string) - model class name"model.mad.MADModel"(ormadwith class alias support Available from v1.13.0 )threshold(float, optional) - The threshold multiplier for the MAD to determine anomalies. Defaults to2.5. Higher values will identify fewer points as anomalies.
Config Example
      models:
  your_desired_alias_for_a_model:
    class: "mad"  # or 'model.mad.MADModel' until v1.13.0
    threshold: 2.5
    # Common arguments for built-in model, if not set, default to
    # See https://docs.victoriametrics.com/anomaly-detection/components/models/#common-args
    #
    # provide_series: ['anomaly_score', 'yhat', 'yhat_lower', 'yhat_upper']
    # schedulers: [all scheduler aliases defined in `scheduler` section]
    # queries: [all query aliases defined in `reader.queries` section]
    # detection_direction: 'both'  # meaning both drops and spikes will be captured
    # min_dev_from_expected: [0.0, 0.0]  # meaning, no minimal threshold is applied to prevent smaller anomalies
    # scale: [1.0, 1.0]  # if needed, prediction intervals' width can be increased (>1) or narrowed (<1)
    # clip_predictions: False  # if data_range for respective `queries` is set in reader, `yhat.*` columns will be clipped
    # anomaly_score_outside_data_range: 1.01  # auto anomaly score (1.01) if `y` (real value) is outside of data_range, if set
Resulting metrics of the model are described here .