Introduction #
Available from v1.26.0
vmanomaly is shipped with a built-in
vmui-like
UI
that provides an intuitive interface for rapid exploration of how anomaly detection models, their configurations and included domain knowledge impacts the results of anomaly detection, before such configurations are deployed in production.
Accessing the UI #
The UI is available at http://<vmanomaly-host>:8490 by default, however, the port can be changed in server
section
of the
configuration file
using the port parameter:
      server:
  port: 8490

# other vmanomaly configuration sections, e.g. schedulers, models, reader, writer, etc.
For impactful parameters please refer to optimize resource usage section of this page.
Playgrounds #
To start exploring the UI, you can use embedded demo with preconfigured queries and models down below on public playgrounds (VictoriaMetrics, VictoriaLogs and VictoriaTraces):
Playground on VictoriaMetrics Datasource
Playground on VictoriaLogs Datasource
Playground on VictoriaTraces Datasource
Authentication #
Available from v1.29.2
You can proxy connection settings to UI, defined in
reader
section of the configuration file, so that UI can connect to the data sources with the same settings (e.g. credentials, TLS, etc.). Set server.use_reader_connection_settings
arg
to true in the configuration file to enable this feature, and UI will automatically use the connection settings from the reader configuration when connecting to the data sources. If pass auth headers option is enabled in the UI settings, it will take precedence over the reader-wise settings. See
example configuration
for details.
Available from v1.27.0 The vmanomaly UI supports proxying authentication headers from v1.1.0 and onwards.
Consider using vmauth in front of both vmanomaly (UI and API) and data sources (VictoriaMetrics / VictoriaLogs) to enforce end-to-end setup for accessing the data from the UI.
Please refer to
config format
of vmauth and check
generic proxy example for different backends
Use the following example configuration snippet for vmauth to proxy auth headers to VictoriaMetrics, VictoriaLogs and vmanomaly instances:
      users:
  - username: '<username>'
    password: '<password>'
    url_map:
      - src_hosts:
        - "metrics.local.some-domain.net"
        url_prefix: "http://victoriametrics:8428"
      - src_hosts:
        - "vl.local.some-domain.net"
        url_prefix: "http://victorialogs:9428"
      - src_hosts:
        - "vmanomaly.local.some-domain.net"
        url_prefix: "http://vmanomaly:8490"
        keep_original_host: true
Then, on settings panel of the UI, set the URLs accordingly, also check the option to forward auth headers to the datasource:
Pre-configured Datasource #
Available from v1.28.2
It is possible to disable the datasource selectors from UI (e.g. at purpose to serve internal teams) by using pre-configured one with respective environment variables at vmanomaly startup:
VMANOMALY_UI_DATASOURCE_URL- to set static datasource URLVMANOMALY_UI_DATASOURCE_TYPE- to set datasource type, supported options arevmfor VictoriaMetrics,vmlogsfor both VictoriaLogs and VictoriaTraces.
Example usage:
      export VMANOMALY_UI_DATASOURCE_URL=https://play.victoriametrics.com/select/0:0/prometheus
export VMANOMALY_UI_DATASOURCE_TYPE=vm
After that, start vmanomaly instance as usual, and the datasource selectors will be hidden from UI, while the pre-configured datasource will be used for all queries:
Preset #
Vmanomaly can be deployed in efficient “UI mode” preset , with as simple configuration as:
preset: ui
This will start vmanomaly instance with a no-operation schedulers, readers, models and the other components, and will only enable the UI for interactive exploration of anomaly detection models, so all the resources are dedicated to the UI and no resources are wasted on other components, such as production jobs of anomaly detection (retrieving metrics, running models, writing results, etc.).
The best applications of this mode are:
- Deploy vmanomaly UI as a service to hide the deployment complexity and allow internal users to explore anomaly detection models and their configurations, without the need to run any production jobs of anomaly detection.
- When there is a quick need to explore and validate anomaly detection models and their configurations before deploying them in production jobs, at minimal resource usage.
However, the UI can be combined with existing production jobs of anomaly detection, as it is available in non-blocking mode for all running vmanomaly instances Available from v1.26.0 , regardless of the preset or configuration used, just at a cost of increased resource usage.
AI Assistance #
Available from v1.29.0 Copilot is an AI assistant built into the vmanomaly UI. It understands current anomaly detection configuration in the UI and helps iterate faster and obtain better results - without leaving the UI, searching the docs manually, or being an expert in anomaly detection.
What you can do with Copilot #
- Ask questions about any model (e.g. Prophet or Z-score - parameters, trade-offs, when to use each)
- Improve detection quality - describe what’s wrong (“too many false positives”, “missing spikes”) and Copilot reads the config, searches the docs, and proposes a validated configuration change to fix the issue.
- Get config suggestions inline - suggestions appear as interactive cards with an explanation and a YAML diff; click Apply to write the change directly to your current settings, or Decline to keep the conversation going.
How it works #
Copilot appears as a chat popup anchored to the bottom-right corner of the page. The panel is resizable by dragging its left edge, and can be opened or closed by clicking the respective icon.
It reads your active model, scheduler, and anomaly settings from the UI automatically, so you don’t need to paste your config manually. Available from v1.29.2 It also can read and modify full UI settings, such as data source URL, query parameters, scheduler settings, and more, to provide better suggestions.
Configuration #
AI Assistant is disabled by default; enable it with VMANOMALY_COPILOT_ENABLED=true, then configure credentials for the selected LLM provider and explicitly set VMANOMALY_COPILOT_MODEL to the exact model Copilot should use. Do not rely on an implicit default model being selected. Once enabled and configured, Copilot will appear as a chat popup in the bottom-right corner of the UI.
Supported providers and model formats:
- Anthropic - set
ANTHROPIC_API_KEY; model format:anthropic:<model>- Examples:
claude-haiku-4-5,claude-sonnet-4-6; see full list
- Examples:
- OpenAI - set
OPENAI_API_KEY; model format:openai:<model>oropenai-responses:<model>- Examples:
gpt-5-mini,gpt-5.2; see full list -
Available from v1.29.1
OpenAI-compatible non-OpenAI providers are supported through
OPENAI_BASE_URL+OPENAI_API_KEY -
Available from v1.29.1
Azure OpenAI is supported through
AZURE_OPENAI_ENDPOINT+OPENAI_API_VERSION+AZURE_OPENAI_API_KEY(orAZURE_OPENAI_AD_TOKEN); do not set bothOPENAI_BASE_URLandAZURE_OPENAI_ENDPOINT
- Examples:
-
Available from v1.29.1
Google - model format:
google-gla:<model>orgoogle-vertex:<model>- Use
GOOGLE_API_KEYforgoogle-gla; forgoogle-vertex, use Application Default Credentials, a service account (GOOGLE_APPLICATION_CREDENTIALS), orGOOGLE_API_KEY - Example:
google-gla:gemini-2.5-pro-preview
- Use
-
Available from v1.29.1
AWS Bedrock - use AWS credentials or an IAM role; model format:
bedrock:<model>- Preferred: set
AWS_BEARER_TOKEN_BEDROCKandAWS_DEFAULT_REGION - Alternative: set
AWS_ACCESS_KEY_ID,AWS_SECRET_ACCESS_KEY, andAWS_DEFAULT_REGION(addAWS_SESSION_TOKENif using a session token) - Example:
bedrock:anthropic.claude-sonnet-4-5-20250929-v1:0
- Preferred: set
-
Available from v1.29.1
OpenRouter - set
OPENROUTER_API_KEY; model format:openrouter:<model>- Example:
openrouter:anthropic/claude-sonnet-4-5
- Example:
Set the credentials matching your selected provider:
      # Anthropic
export ANTHROPIC_API_KEY=your_key_here

# OpenAI
export OPENAI_API_KEY=your_key_here

# OpenAI-compatible non-OpenAI providers
export OPENAI_BASE_URL=https://api.example.com/v1
export OPENAI_API_KEY=your_key_here

# Azure OpenAI
export AZURE_OPENAI_ENDPOINT=https://example.openai.azure.com
export OPENAI_API_VERSION=2024-10-21
export AZURE_OPENAI_API_KEY=your_key_here
# or: export AZURE_OPENAI_AD_TOKEN=your_entra_token

# Google Generative Language API
export GOOGLE_API_KEY=your_key_here

# Google Vertex AI service account
export GOOGLE_APPLICATION_CREDENTIALS=/path/to/service-account.json
# or use Application Default Credentials: gcloud auth application-default login

# OpenRouter
export OPENROUTER_API_KEY=your_key_here

# AWS Bedrock (preferred: bearer token)
export AWS_BEARER_TOKEN_BEDROCK=your_bearer_token
export AWS_DEFAULT_REGION=us-east-1
# AWS Bedrock (alternative: access key pair or IAM role)
# export AWS_ACCESS_KEY_ID=your_access_key
# export AWS_SECRET_ACCESS_KEY=your_secret_key
# export AWS_DEFAULT_REGION=us-east-1
# export AWS_SESSION_TOKEN=your_session_token  # if using a session token
Explicitly set the model Copilot should use:
export VMANOMALY_COPILOT_MODEL=openai:gpt-5-mini
For example, if a smaller OpenAI model is desired, set:
export VMANOMALY_COPILOT_MODEL=openai:gpt-5-nano
MCP tools server #
Connects Copilot to mcp-vmanomaly for full tool access (built-in docs, models configuration and validation, alerts recommendation, service healthchecks, etc.). Full tools list :
Only http mode
is supported. Set VMANOMALY_MCP_SERVER_URL to the MCP server HTTP endpoint. The server must be reachable from within the vmanomaly container.
For example:
export VMANOMALY_MCP_SERVER_URL=http://localhost:8081/mcp
Use localhost only when the vmanomaly process can reach the MCP server on its own loopback interface (for example, both running on the host). If vmanomaly runs in a separate Docker container, use a reachable container or host address instead.
Example: if using Docker, run mcp-vmanomaly and vmanomaly UI in the same Docker network so they can reach each other by container name:
      docker network create vmanomaly-network

docker run -d --rm \
  --name mcp-vmanomaly \
  --network vmanomaly-network \
  -e VMANOMALY_ENDPOINT=http://vmanomaly-instance:8490 \
  -e MCP_SERVER_MODE=http \
  -e MCP_LISTEN_ADDR=:8081 \
  ghcr.io/victoriametrics/mcp-vmanomaly

docker run -it --rm \
  --name vmanomaly-instance \
  --network vmanomaly-network \
  -e VMANOMALY_COPILOT_ENABLED=true \
  -e OPENAI_API_KEY="$OPENAI_API_KEY" \
  -e VMANOMALY_COPILOT_MODEL=openai:gpt-5-mini \
  -e VMANOMALY_MCP_SERVER_URL=http://mcp-vmanomaly:8081/mcp \
  -p 8080:8080 \
  -p 8490:8490 \
  victoriametrics/vmanomaly:v1.29.2 \
  vmanomaly_config.yaml
UI Navigation #
The vmanomaly UI provides a user-friendly interface for exploring and configuring anomaly detection models. The main components of the UI include:
- Query Explorer : A vmui-like interface for typing and executing MetricsQL/LogsQL queries to visualize data.
- Model Panel : A form for editing anomaly detection model hyperparameters and applying domain knowledge settings.
- Visualization Panel : A space for visualizing model performance and anomalies.
- Settings Panel : A section for configuring global settings and preferences for the vmanomaly UI, including data source configuration.
Query Explorer #
The Query Explorer provides a vmui-like interface for typing and executing MetricsQL/LogsQL queries to visualize data.
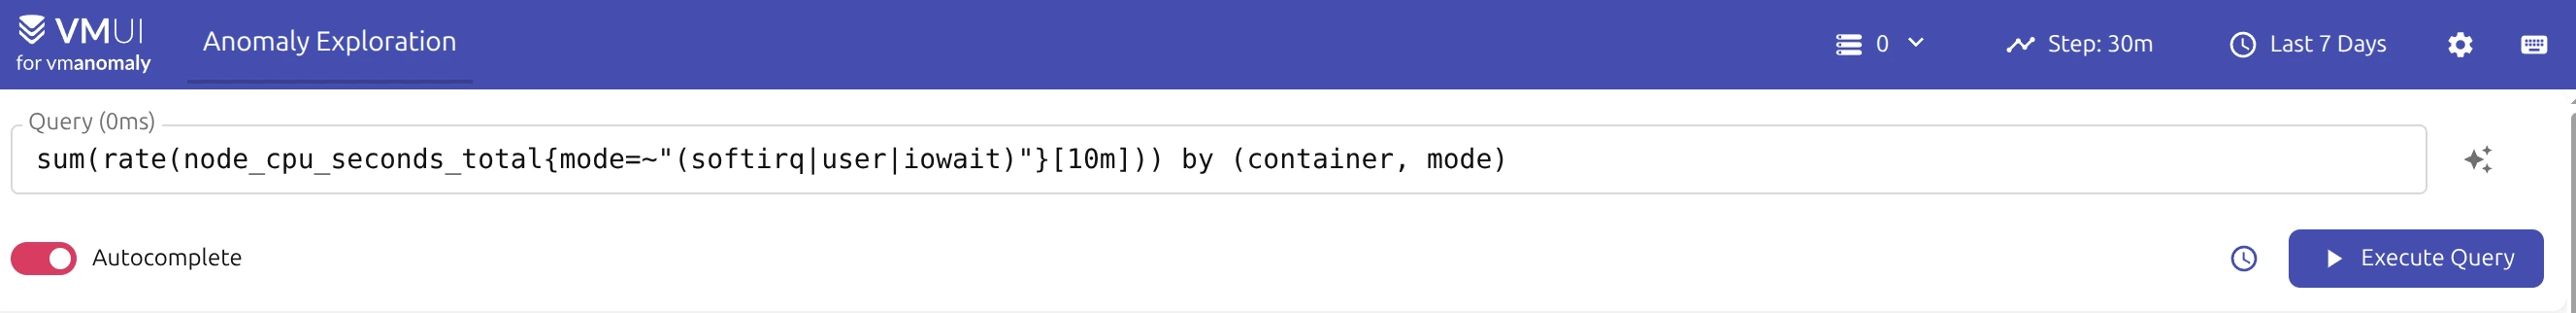
Users can:
- Enter, autocomplete, prettify and execute queries to retrieve and plot the data from the configured data source (see settings panel for data source configuration).
- Adjust the (inference) time range and resolution (step) for data visualization and anomaly detection purposes.
- Access query history and saved queries for quick access to frequently used queries.
- Switch tenants (if data source supports multi-tenancy) and access settings panel for global UI configuration.
Visualization Panel #
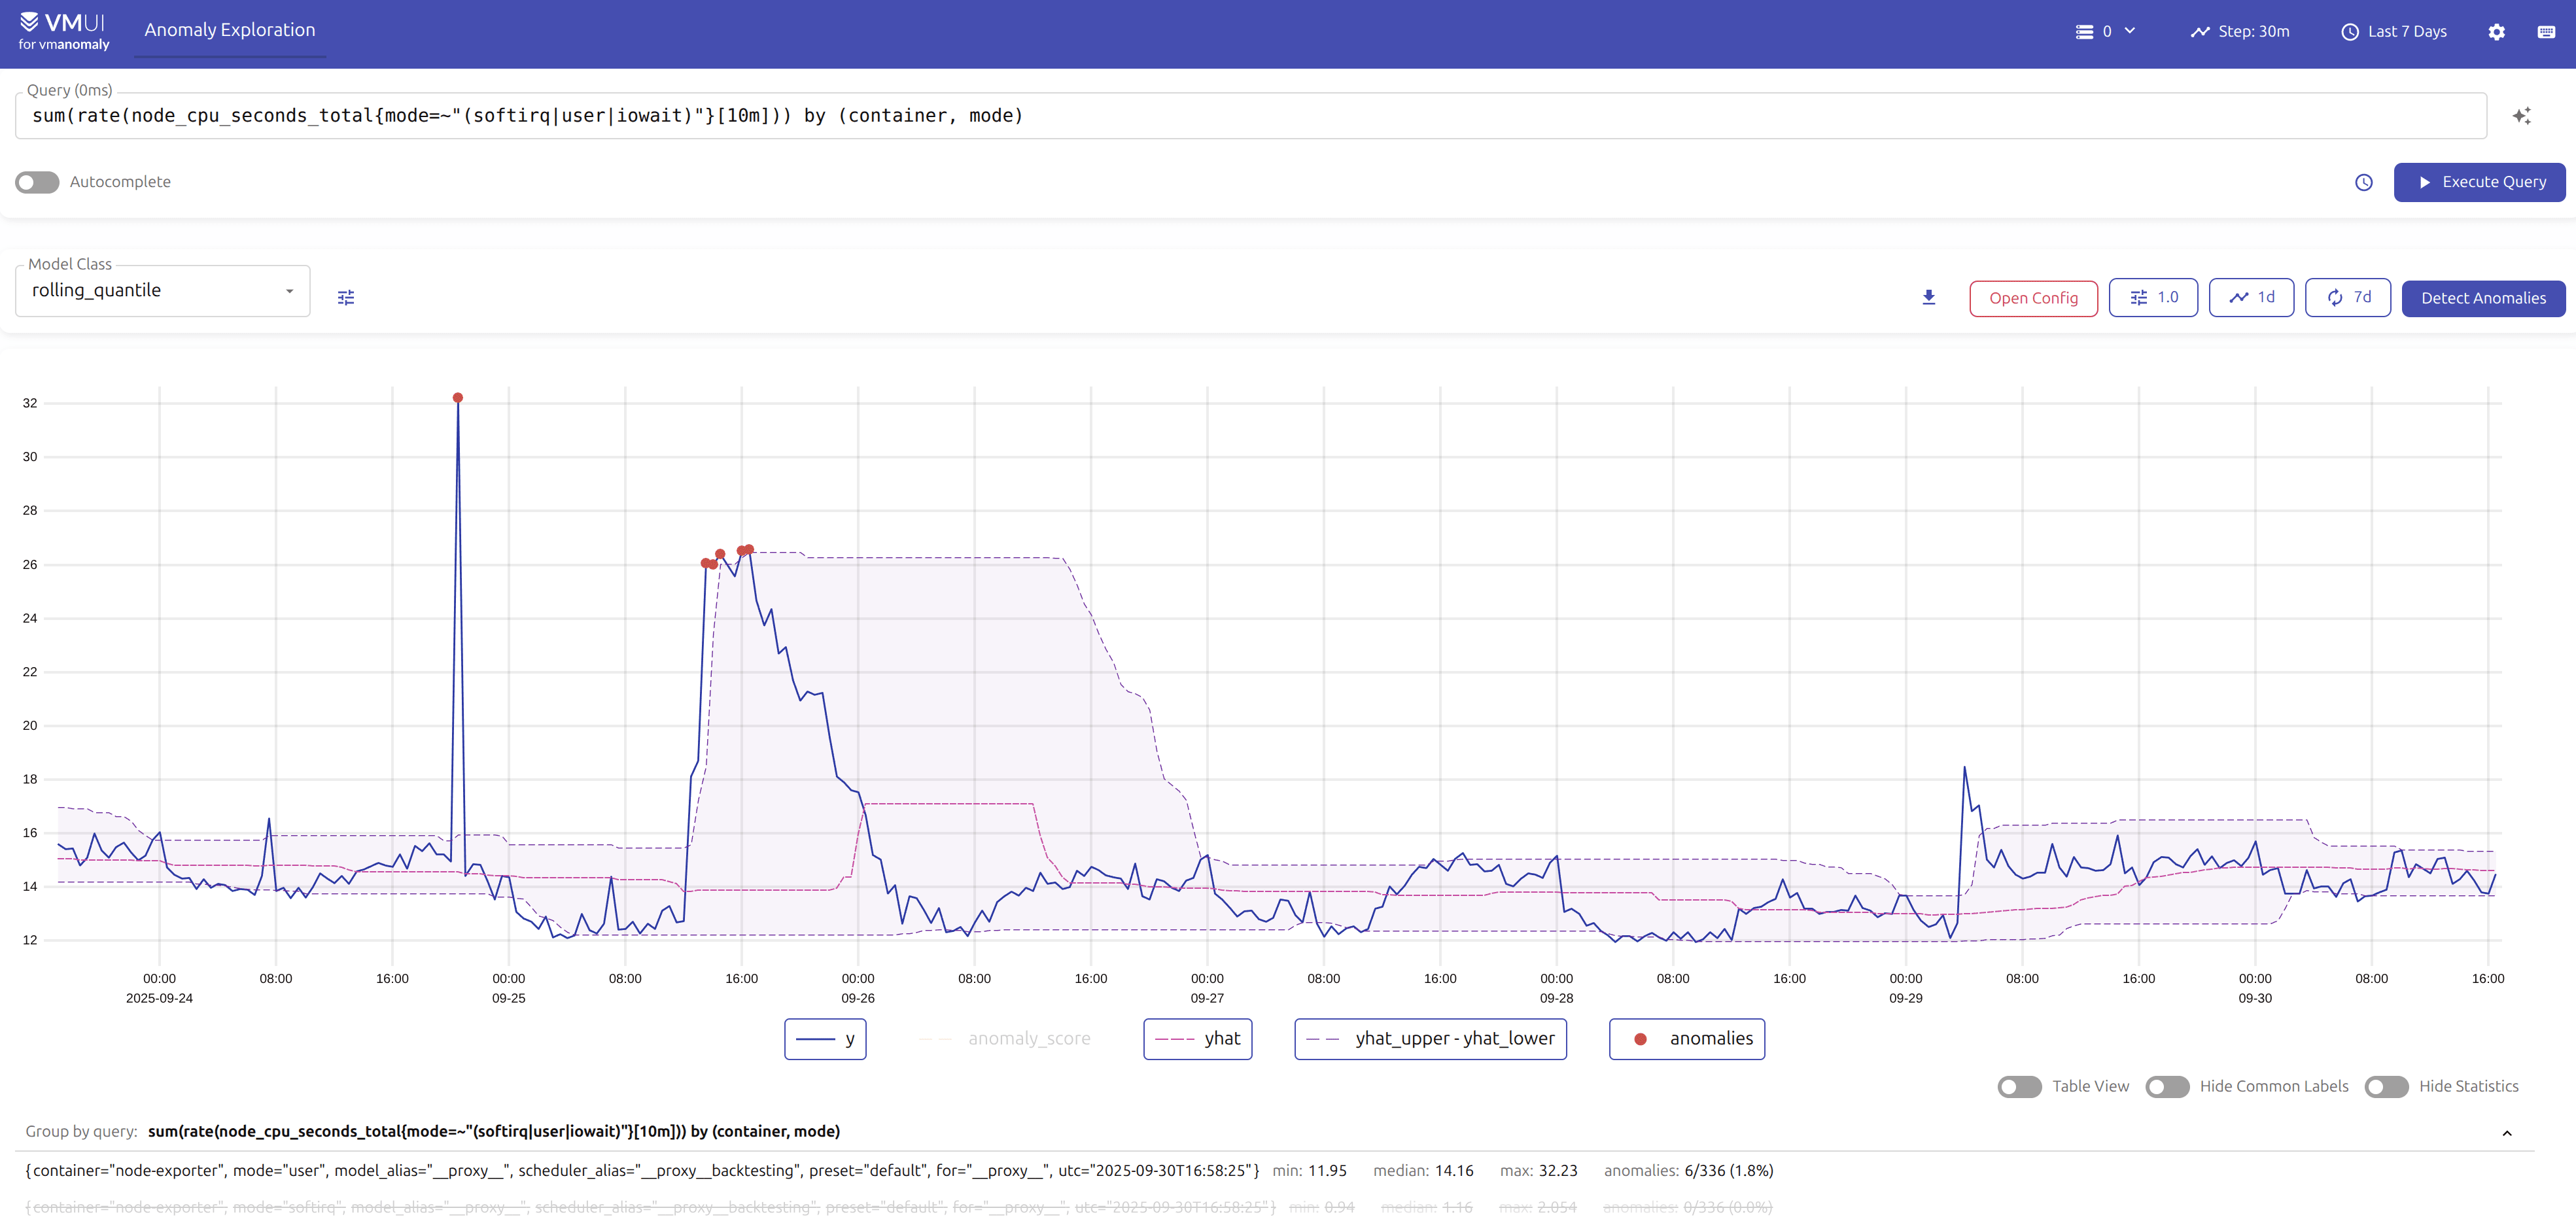
The Visualization Panel has 2 modes of displaying data - either raw queried data or data with detected anomalies, depending on the action taken in the Model Panel.
Visualizations of the queried data (“Execute Query” button)
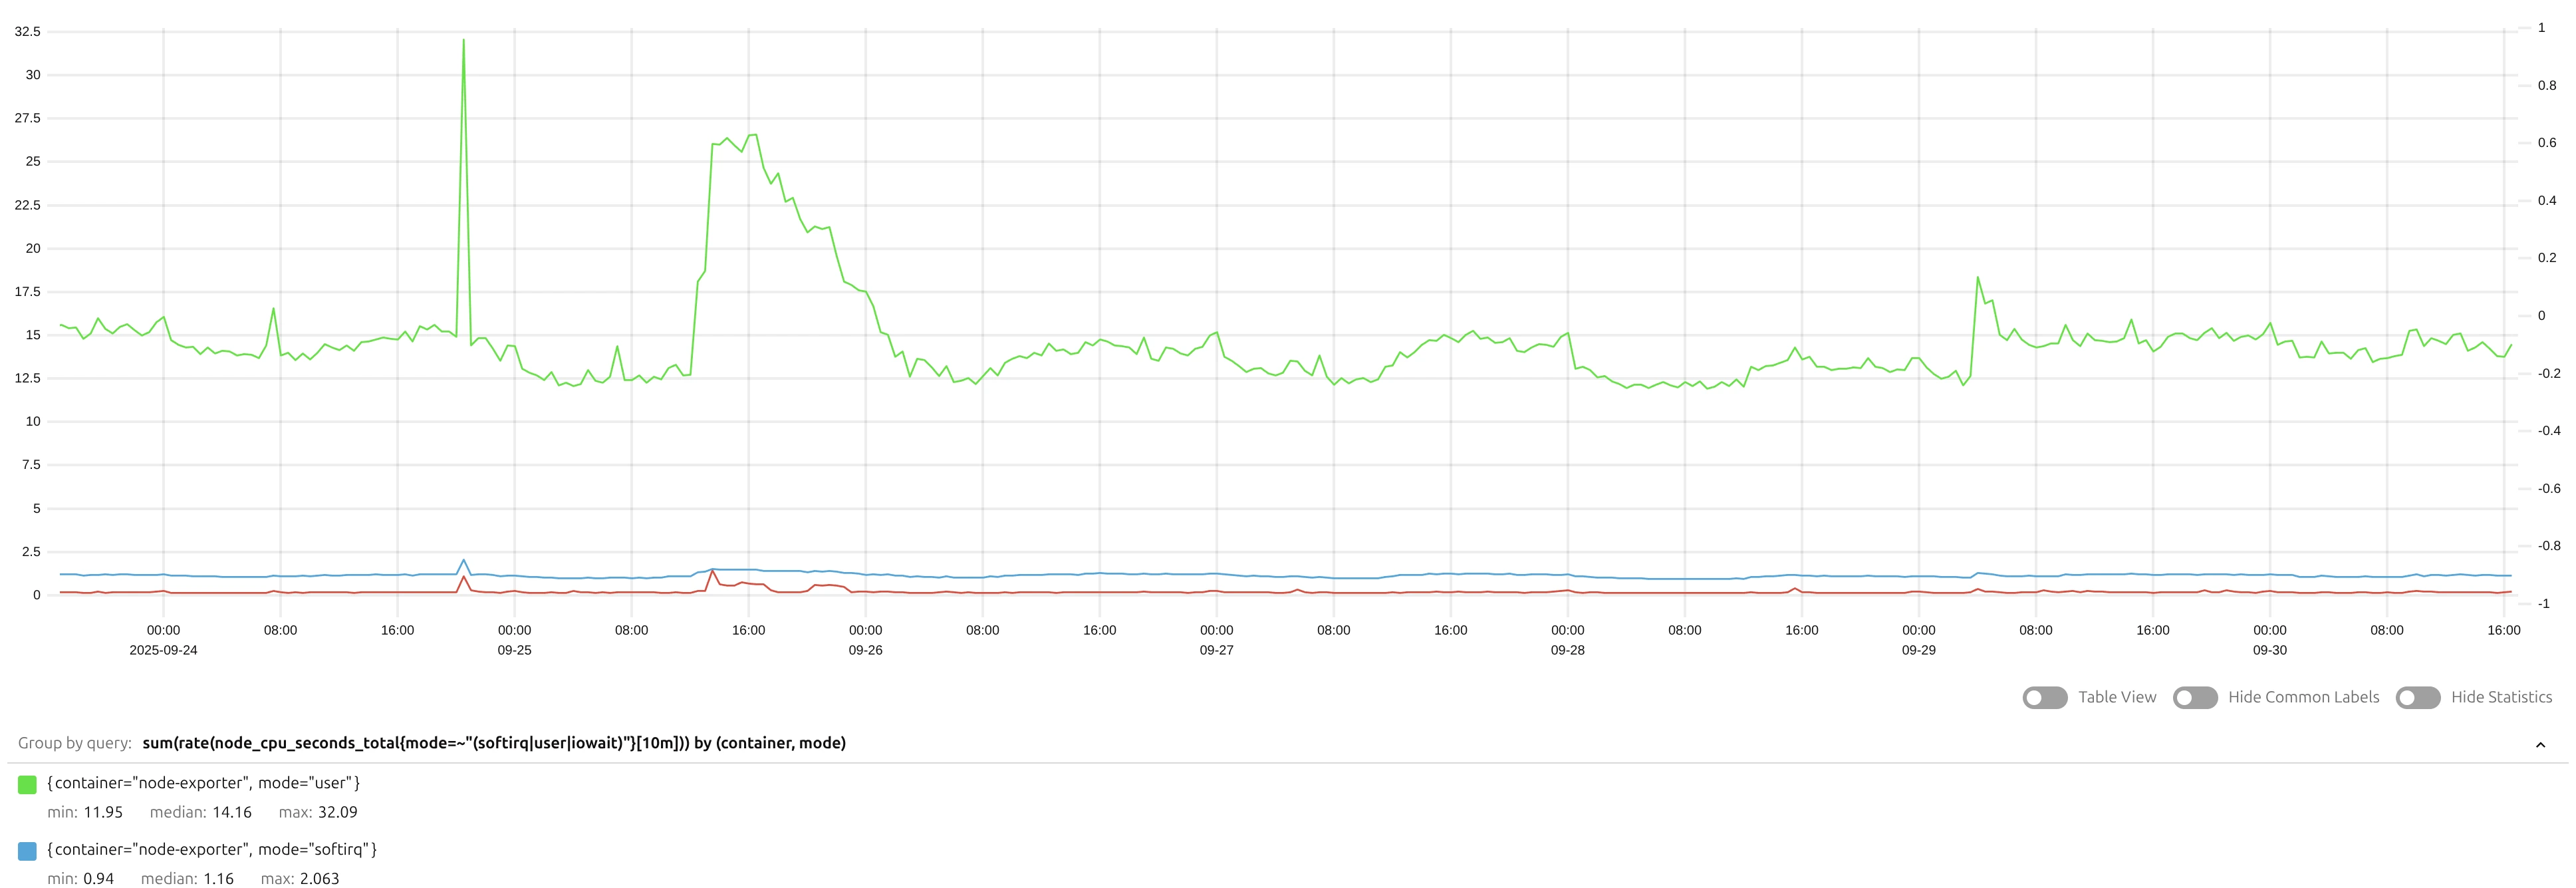
All the metrics are shown in a single plot, similar to vmui, with zooming and panning capabilities.
Initial data with detected anomalies (“Detect Anomalies” button)
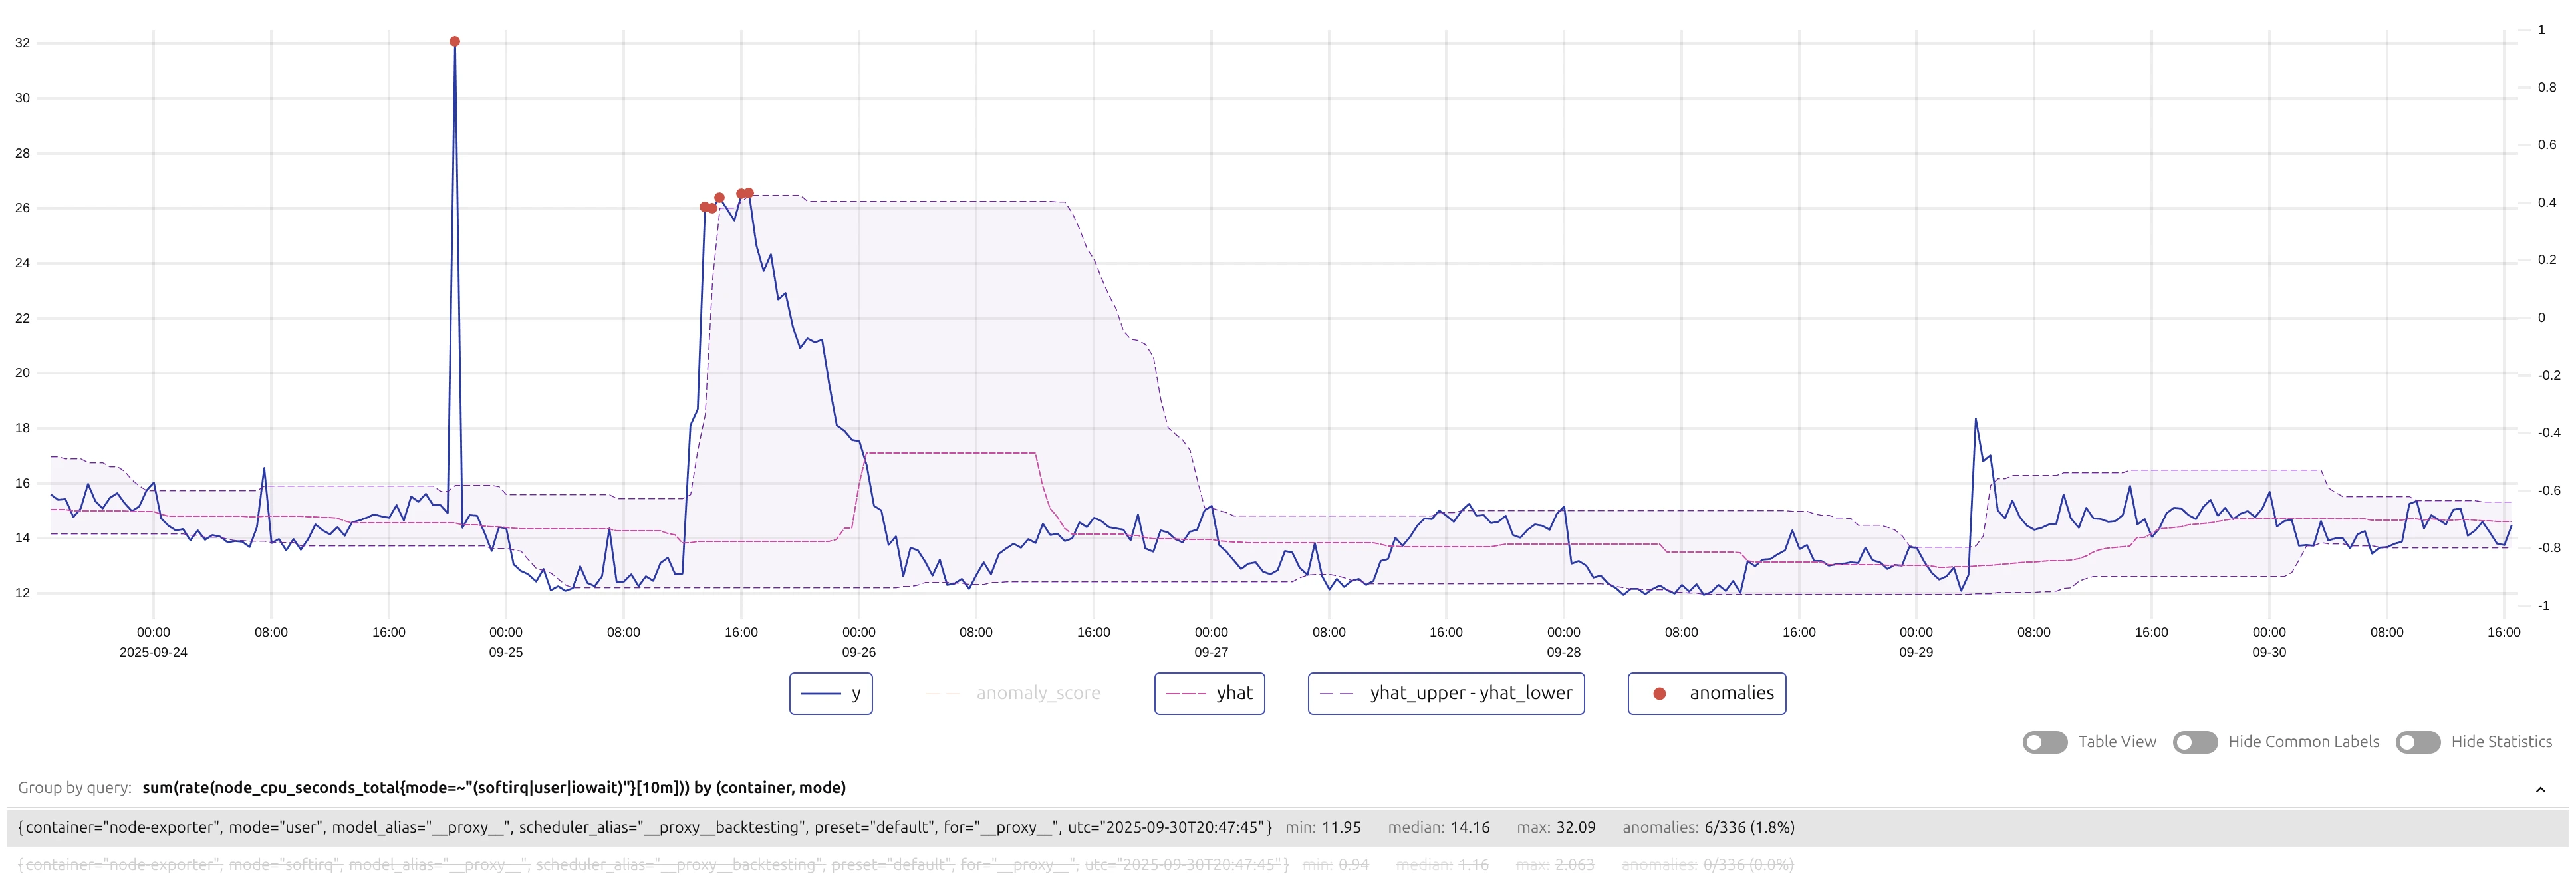
The plot shows the queried data, grouped by individual series, iterated over legend, with the actual values (y) compared to the expected values (model predictions, y_hat), confidence intervals (y_hat_lower, y_hat_upper), and detected anomalies. The anomalies are marked with red circles, and hovering over them provides additional information such as the anomaly score and associated labels.
Also, timeseries (such as y, y_hat, etc.) can be toggled on/off by clicking on the legend items.
Available from v1.29.2 Seeing model business-boundaries , such as detection direction and minimal deviation from expected ( absolute and relative combined) can be turned on with “business boundaries” toggle. Showing/hiding individual bands can be done by clicking on the respective legend items, while showing/hiding all business boundaries at once can be done with “business boundaries” toggle.
Model Panel #

The Model Panel provides:
Parameters, such as “Fit Every”, “Fit Window” and Available from v1.28.0 “Infer Every” to imitate production scheduling , as well as overriding default anomaly detection threshold (1.0).
Available from v1.28.0
“Exact” mode checkbox is used in combination with “Infer Every” control for
online models
such as mad_online or quantile_online, to provide unbiased estimates of how production scheduler would perform anomaly detection on incoming data streams. In “exact” mode, the model is updated exactly at every “infer every” micro-batch interval, at a cost of increased computation time.
Controls for running/canceling anomaly detection on the queried data, downloading the results as CSV/JSON, accessing and downloading the model configuration or example alerting rules in YAML format.
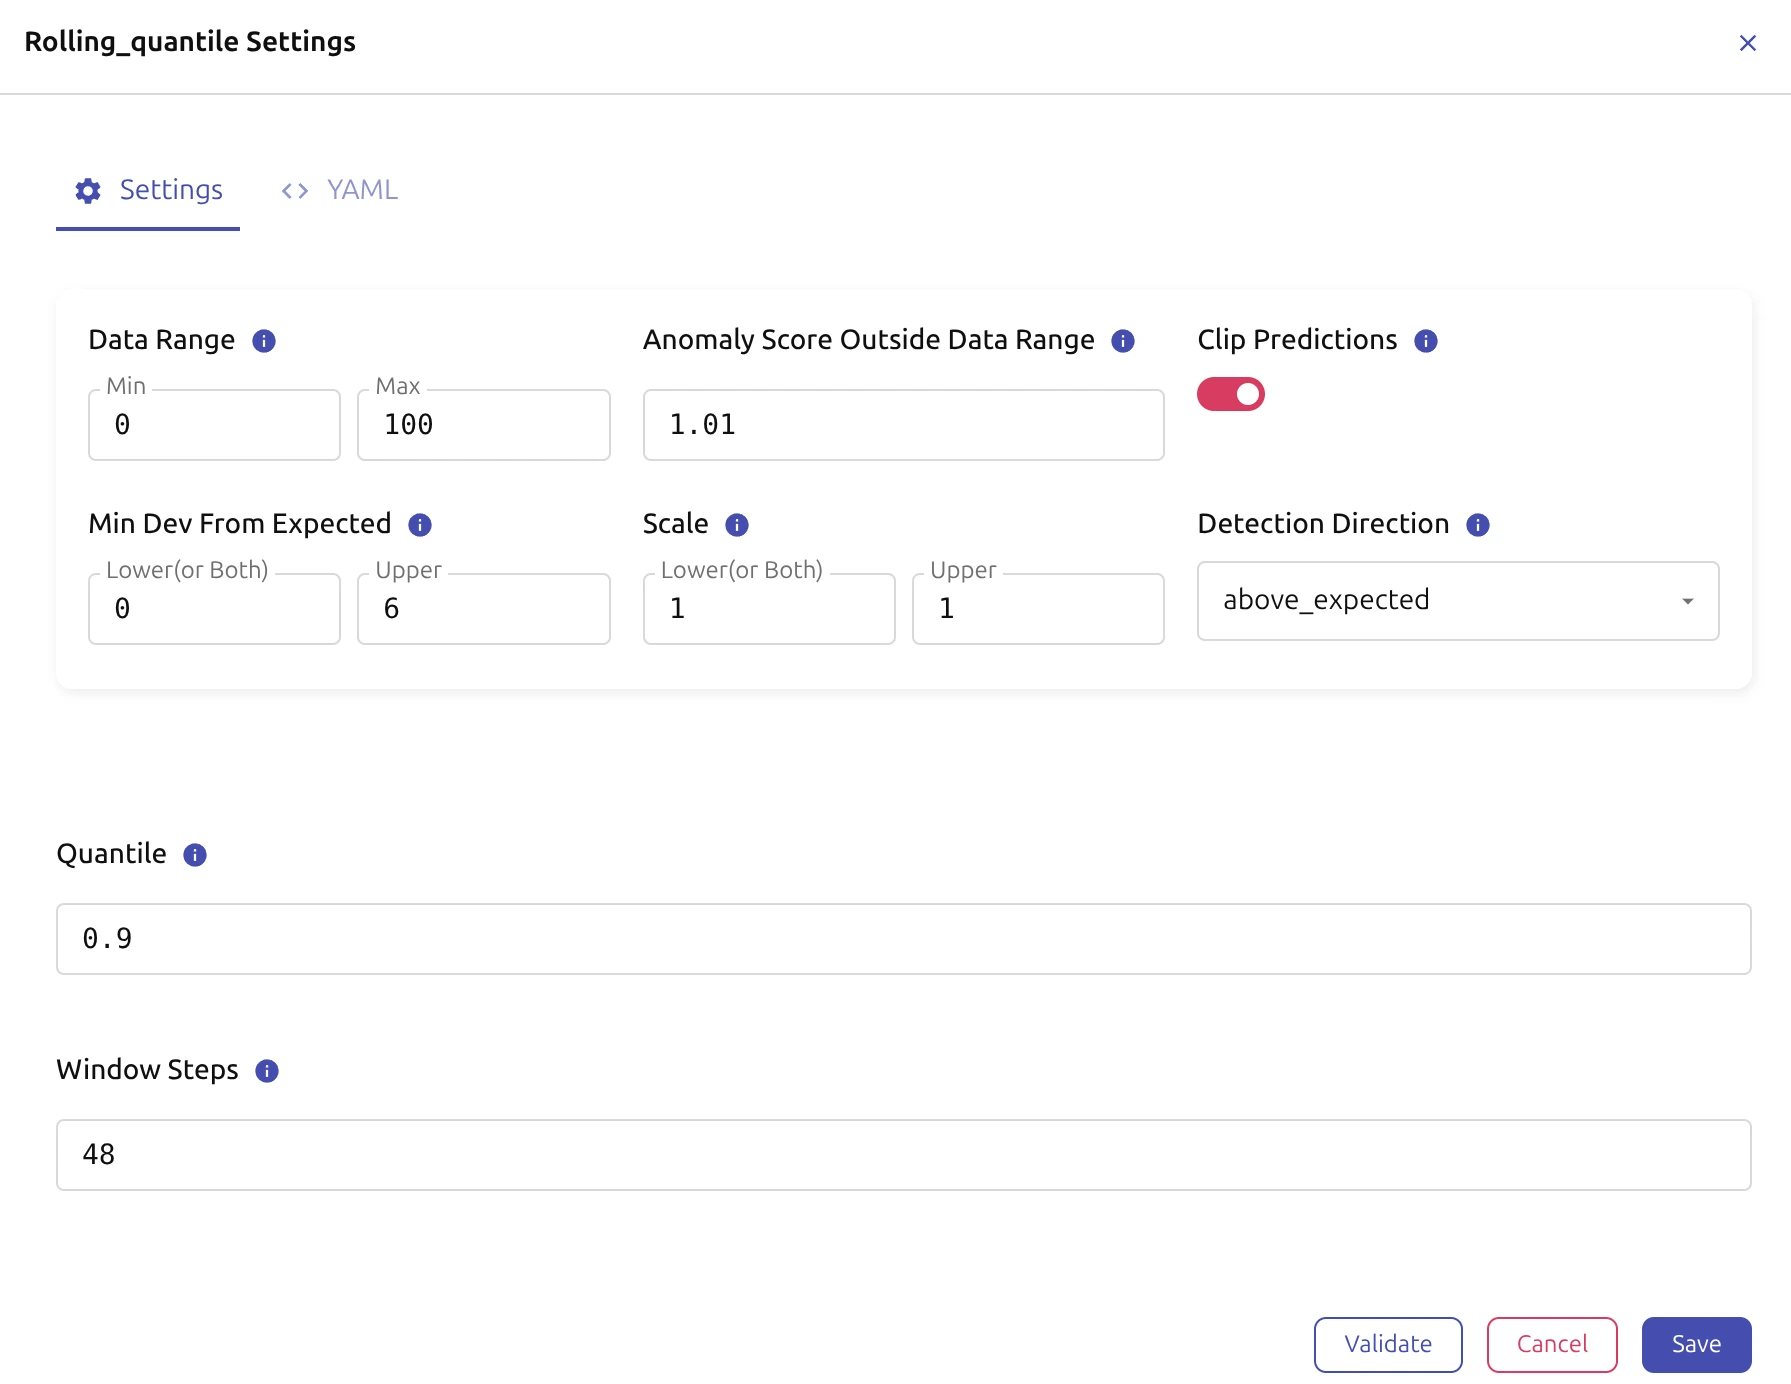
A form-based menu for finetuning model hyperparameters and applying domain knowledge settings:
- Model type selection (e.g., rolling quantile, Prophet, etc.)

- Wizard with model-agnostic parameters (e.g., detection direction, data range, scale, clipping, minimum deviation from expected, etc.) and model-specific hyperparameters for chosen model type (e.g., quantile and window steps for
rolling quantile
model).
Available from v1.27.0
autocomplete of example parameters by hitting Tab key is supported.
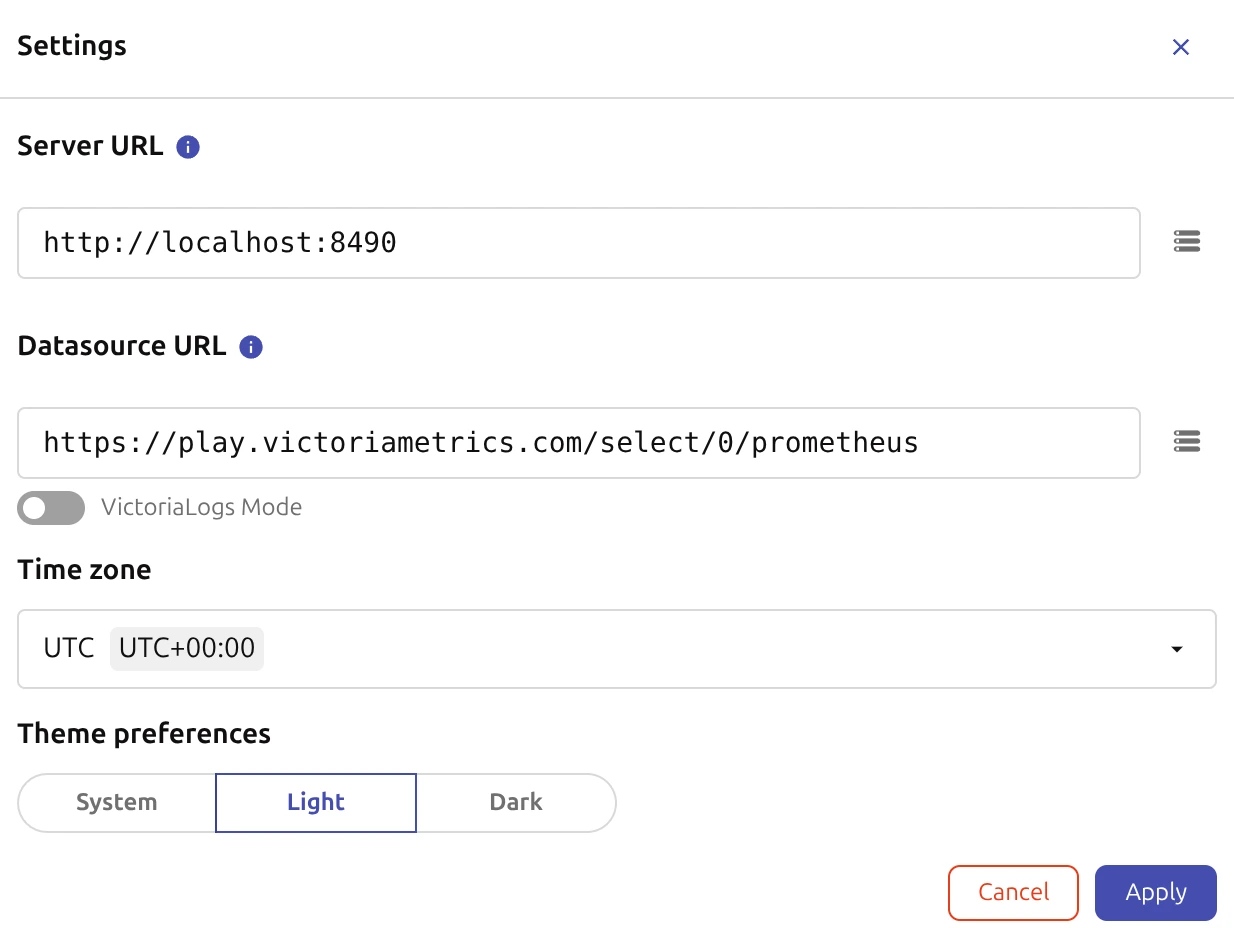
Settings Panel #
The vmui-like “Settings” panel allows users to configure global settings and preferences for the vmanomaly UI, including:
- Server URL (vmanomaly)
- Datasource URL (VictoriaMetrics, VictoriaLogs)
- Timezone
- UI Theme
- Available from v1.27.0 Auth Headers forwarding to datasource (VictoriaMetrics, VictoriaLogs).
Configuration Sharing #
Based on the needs, either
- Full UI state can be shared via URL
- Or model part / full service configuration can be viewed and exported in production-ready YAML format .
Default state can simplify both sharing and experimentation by preconfiguring the UI state on vmanomaly startup.
URL Sharing #
Similarly to vmui, vmanomaly UI supports configuration sharing via URL by encoding the UI state in the URL. This allows users to share their UI state (including queries, time ranges, model type and hyperparameters, and other settings) by copying and sharing the URL from the browser’s address bar.
Once the desired UI state is set up (query, time range, model configuration, etc.), the URL can be copied from the browser’s address bar and shared with others, who can then open the URL in their browsers to see the same UI state (given that the data source is accessible to them).

Example URL content:
http://localhost:8490/vmui/#/?anomaly_threshold=1.0&fit_window=1d&fit_every=7d&g0.range_input=7d&g0.end_input=2025-09-30T16%3A56%3A13&g0.relative_time=last_7_days&g0.tab=0&g0.tenantID=0&datasourceUrl=https%3A%2F%2Fplay.victoriametrics.com%2Fselect%2F0%2Fprometheus&g0.expr=sum%28rate%28node_cpu_seconds_total%7Bmode%3D%7E%22%28softirq%7Cuser%7Ciowait%29%22%7D%5B10m%5D%29%29+by+%28container%2C+mode%29&g0.step_input=30m&model_config=%257B%2522modelType%2522%253A%2522rolling_quantile%2522%252C%2522settings%2522%253A%257B%2522detection_direction%2522%253A%2522above_expected%2522%252C%2522data_range%2522%253A%255B0%252C100%255D%252C%2522scale%2522%253A%255B1%252C1%255D%252C%2522clip_predictions%2522%253Atrue%252C%2522min_dev_from_expected%2522%253A%255B0%252C6%255D%252C%2522anomaly_score_outside_data_range%2522%253A1.01%252C%2522quantile%2522%253A0.9%252C%2522window_steps%2522%253A48%257D%252C%2522modelSpec%2522%253A%257B%2522class_name%2522%253A%2522rolling_quantile%2522%252C%2522class%2522%253A%2522model.rolling_quantile.RollingQuantileModel%2522%252C%2522detection_direction%2522%253A%2522above_expected%2522%252C%2522data_range%2522%253A%255B0%252C100%255D%252C%2522scale%2522%253A%255B1%252C1%255D%252C%2522clip_predictions%2522%253Atrue%252C%2522min_dev_from_expected%2522%253A%255B0%252C6%255D%252C%2522anomaly_score_outside_data_range%2522%253A1.01%252C%2522window_steps%2522%253A48%252C%2522quantile%2522%253A0.9%257D%252C%2522isValidated%2522%253Atrue%257D
Default State #
Available from v1.28.5
It is possible to preconfigure the default UI state via url-encoded ui_default_state parameter, so that /vmui/ opens with the intended model settings, time range, query and other parameters, which improves user experience by allowing direct access to specific views without manual configuration each time, including state sharing or faster experimentation for internal teams.
This parameter can be set in server
section
of the
configuration file
using the ui_default_state parameter.
Default state is static by nature, so changing it requires either vmanomaly service restart or enabling
hot-reload mode
via --watch flag.
Example usage (based on UI preset mode):
      preset: ui
# other sections, if needed e.g. settings

server:
  ui_default_state: '#/?anomaly_threshold=1.0&anomaly_consecutive=true&fit_window=3d'
  # other server parameters, if needed e.g. port, max_concurrent_tasks, etc.
After that, accessing http://<vmanomaly-host>:<port>/vmui/ (e.g. http://localhost:8490/vmui/) will open the UI with the preconfigured default state: anomaly_threshold=1.0, consecutive anomaly mode turned on and fit_window=3d given the example above.
Please refer to URL sharing section for details on how to construct and copy the desired UI state URL.
YAML Configuration #
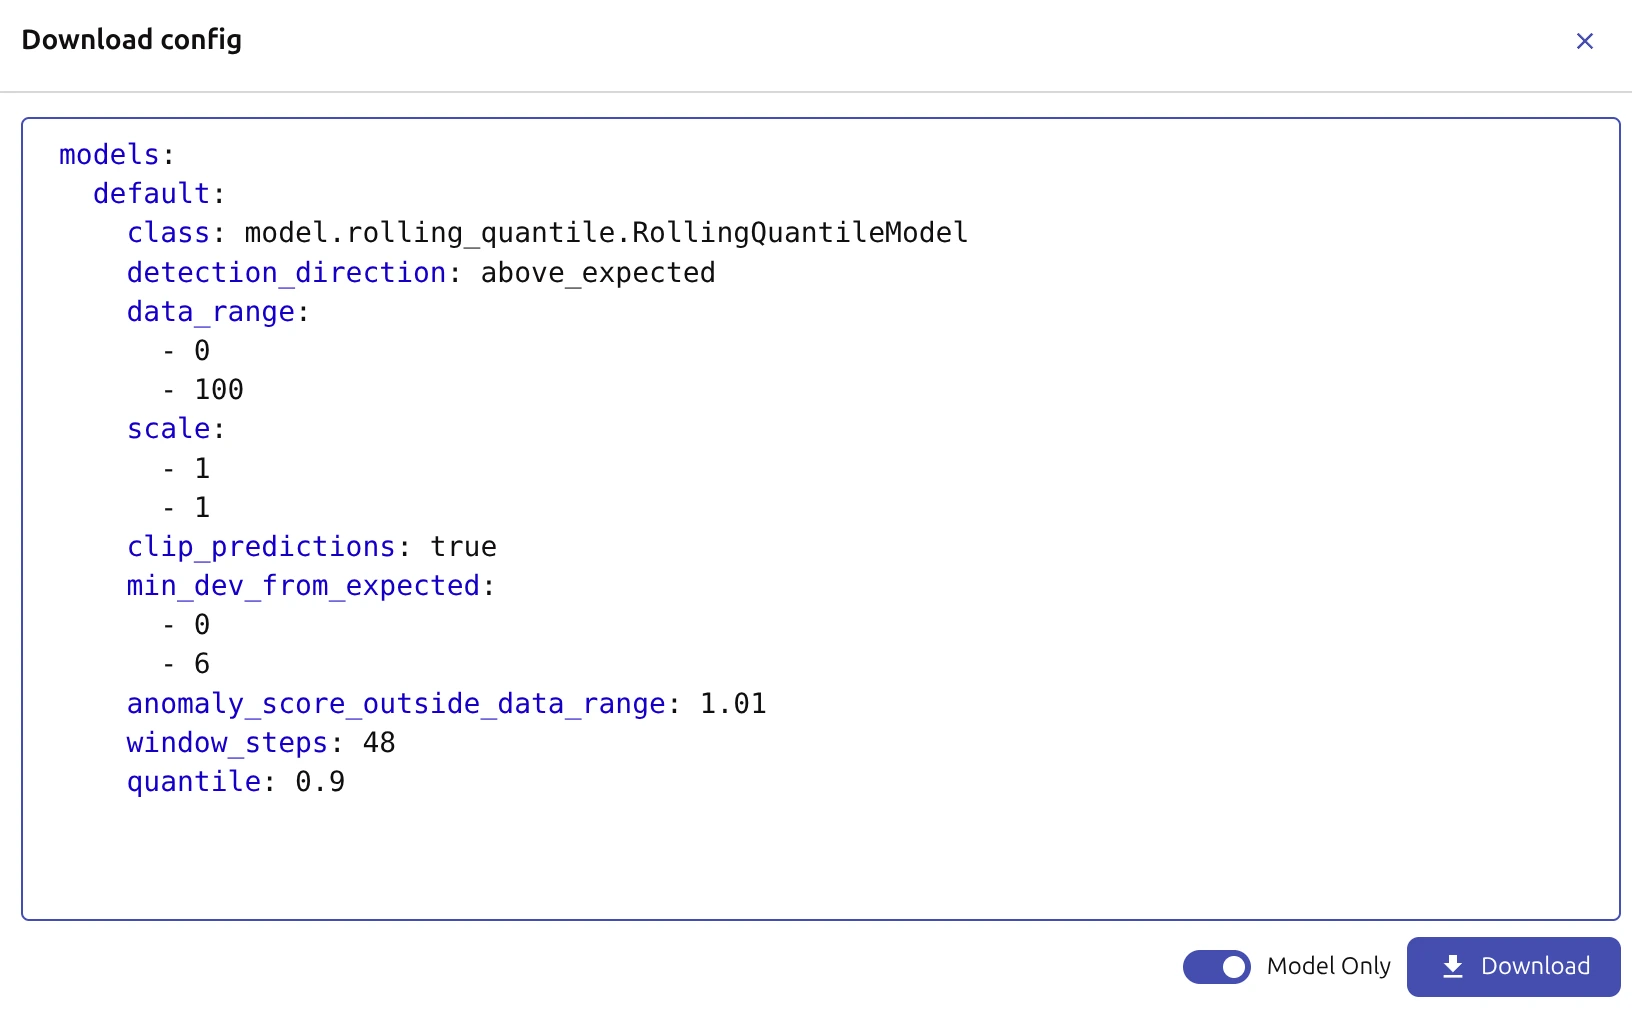
Once the configuration is set up and saved in the UI (selected model type and validated hyperparameters), equivalent configuration in production-ready YAML format can be obtained by:
Accessing the “YAML” Tab in the model configuration section
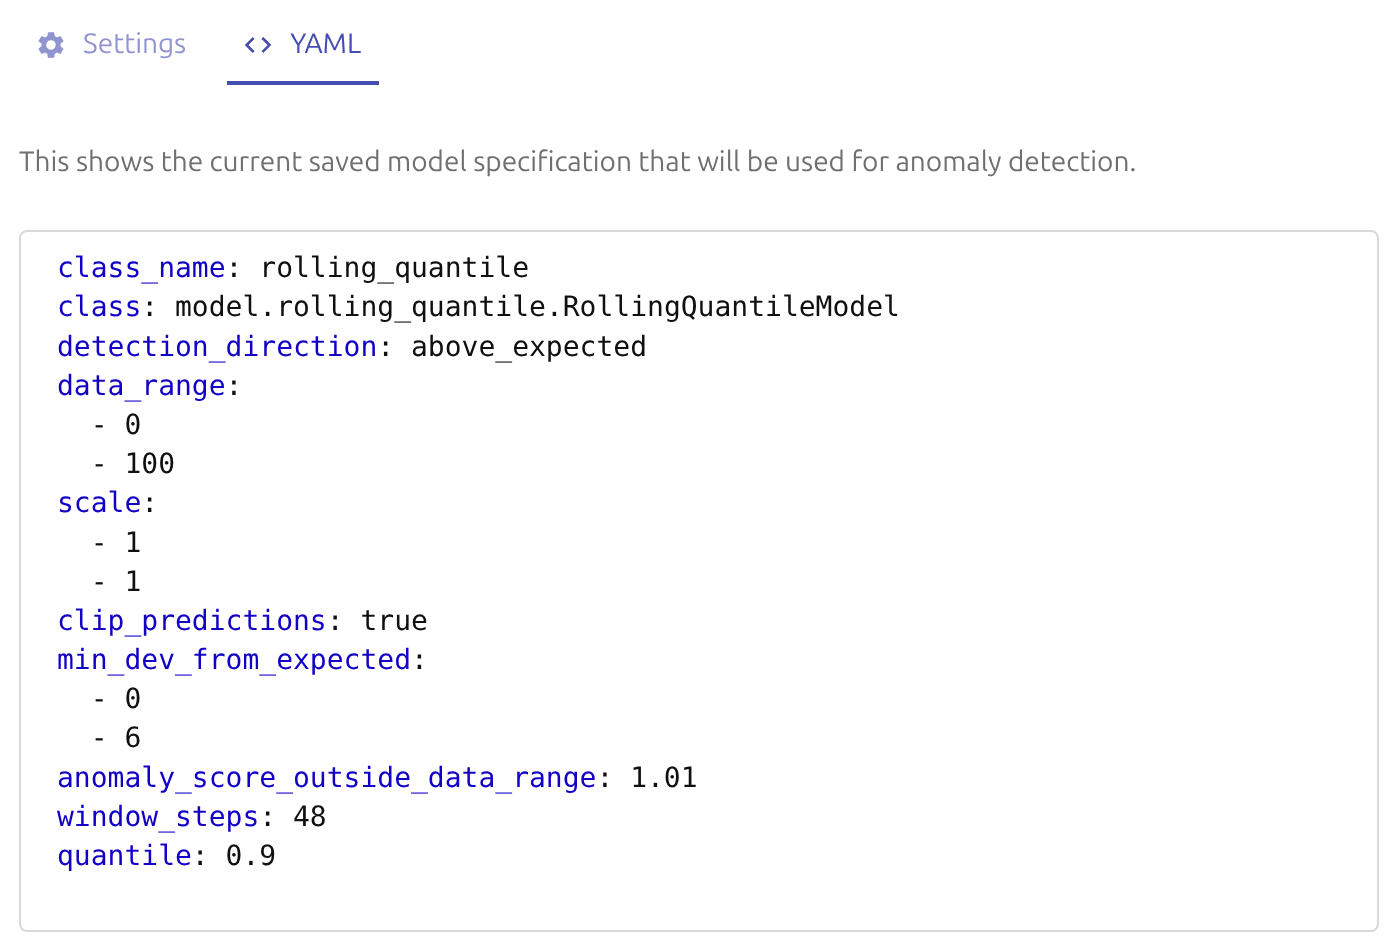
Clicking the “Show Config” button to access (model-only or full) configuration and hitting “Download” button to get the configuration as a YAML file.

Optimize Resource Usage #
Based on expected usage patterns (quick experiments, internal team serving, number of users, etc.) it is recommended to tune resource usage by adjusting the following parameters in the server
section
and settings
section
of the configuration file:
      server:
  # Port for the UI server (default: 8490)
  port: 8490
  # Limit on concurrent tasks to manage UI load (default: 2)
  max_concurrent_tasks: 2

settings:
  # Number of workers for single job speed-ups (default: 1)
  n_workers: 2
  # Adjust logging levels to reduce verbosity
  logger_levels:
    vmanomaly: WARNING
    reader: INFO
    model: INFO
    # ...
max_concurrent_tasks limits the number of concurrent tasks (e.g. running anomaly detection on queried data) to avoid overloading the UI when multiple users are using it simultaneously, and n_workers
option
controls the number of workers for parallel processing of single tasks (e.g. running anomaly detection on queried data faster).
Please note that numbers <= 0 for n_workers mean number of available CPU cores, and these workers would be shared with other components of vmanomaly, such as production jobs of anomaly detection (retrieving metrics, running models, writing results, etc.), if they are enabled.
Preset Usage #
If using the ui preset, just specify:
      preset: ui

server:
  # Port for the UI server (default: 8490)
  port: 8490
  # Limit on concurrent tasks to manage UI load (default: 2)
  max_concurrent_tasks: 5
  # path_prefix: /my-app  # optional, available from v1.28.4
  # To locate the UI at http://<vmanomaly-host>:8490/my-app/vmui/

settings:
  # Number of workers for single job speed-ups (default: 1)
  n_workers: 2
  # Adjust logging levels to reduce verbosity
  logger_levels:
    vmanomaly: WARNING
    # ...
in instance configuration file, it will be recursively merged with preset pre-filled configuration to produce the final configuration.
Mixed Usage #
If mixing the UI alongside production jobs of anomaly detection is expected, it is recommended to adjust the parameters to optimize resource usage, as well as configuring the reader and writer components appropriately for the production jobs.
settings:
  # Number of workers for mixed usage (numbers <= 0 mean number of available CPU cores)
  n_workers: -1
  # Adjust logging levels to reduce verbosity
  logger_levels:
    vmanomaly: WARNING
    reader: INFO
    model: INFO
    writer: INFO
    # ...

server:
  # Port for the UI server (default: 8490)
  port: 8490
  # Limit on concurrent tasks to manage UI load (default: 2)
  max_concurrent_tasks: 5
  # override server's configured URL path prefix for all HTTP routes
  # e.g. locate the UI at http://<vmanomaly-host>:8490/my-app/vmui/
  # available from v1.28.4
  # path_prefix: /my-app

# other production components, e.g. schedulers, models, reader, writer, etc.
Example Usage #
Run vmanomaly in ui preset mode (experimenting) with a configuration file config.yaml (see
preset usage
section for details):
      preset: ui

# other optional server/settings parameters, e.g. port, max_concurrent_tasks, n_workers, logger_levels, etc.
using one of the deployment methods in a QuickStart guide , e.g. via Docker.
Retrieve the UI at http://<vmanomaly-host>:<port> (e.g. at http://localhost:8490 if running locally with default port) and start exploring anomaly detection models and their configurations interactively.
Explore Input Data #
Start by entering valid MetricsQL/LogsQL queries in the Query Explorer to visualize the data from the configured data source (see settings panel for data source configuration) - that’s the data on which anomaly detection models will be applied.
Set appropriate tenants (if data source supports multi-tenancy) and access settings panel for global UI configuration, if needed.
Set up the time range and resolution (step) for data visualization and anomaly detection purposes - e.g. last 7 days with 30m step, especially if the data has daily/weekly seasonality. Also, set the step according to the desired granularity of anomaly detection results (e.g. 30m step for 30m granularity) which itself is based on alerting needs and latency requirements.
Pay attention to trends, seasonality, noise, outliers, and other patterns in the data, which can influence the choice of anomaly detection model and its hyperparameters (e.g. use seasonal models for seasonal data - like Prophet, robust models for noisy de-seasonalized data - like MAD, etc.).
Select and Configure Model #
Choose an appropriate anomaly detection model from the Model Panel based on the characteristics of the data and the specific requirements (domain knowledge) of the use case.
Set the “Fit Every” and “Fit Window” parameters to control how often and over what time window the model is retrained on new data to imitate production behavior - e.g. fit every 7 days on a rolling window of last 14 days.
Available from v1.28.0 Set the “Infer Every” and toggle “Exact” mode parameters for online models to imitate production inference behavior - e.g. infer every = 1h with step = 1m will result in exact mode for hourly micro-batches of up to 60 1m datapoints.
Tune the model hyperparameters and apply domain knowledge settings using the form-based menu in the Model Panel. See (i) tooltips for parameter descriptions and model documentation link for recommended values and guidelines.
For example, for a MAD online
model
, that should be run on a query, returning per-mode CPU utilization (as fractions of 1, data range [0, 1]), where you are interested in capturing spikes of at least 6% deviations from expected behavior:
Set the model-agnostic parameters to encode the domain knowledge:
- detection direction
to
above expectedfor capturing high anomalies (spikes) - data range to
[0, 1]for CPU utilization fractions and proper prediction clipping - minimum deviation from expected
to
[0, 0.06]for capturing spikes of at least 6% deviations in magnitude - (optionally)
anomaly score outside data range
to
5.0for automatically marking values outside data range as anomalies (e.g. to catch improper query returning CPU > 100% or < 0%) - clip predictions
to
truefor avoiding nonsensical predictions outside data range - scale
to
[1, 1]unless you will see improper width of confidence intervals from the experiments (e.g. too wide/narrow) given the model-specific hyperparameters and false positives/negatives observed in the results.
Set the model-specific hyperparameters:
thresholdto3for capturing significant deviationsdecayto0.995for adapting to changing data patterns reasonably fast.
Check the parameters for validity and consistency by hitting the “Validate” button, which will also provide warnings if some parameters are inconsistent (e.g. decay is set outside of [0, 1] range or threshold is set to a negative value), then hit “Save” to apply the changes.
Detect Anomalies #
Hit the “Detect Anomalies” button to run anomaly detection on the queried data with the selected model and its configuration.
The long running task (e.g. detection on misconfigured query returning too much metrics) can be canceled by hitting the “Cancel” button.
Iterate over the legend to view individual vmanomaly output (e.g. actual values, expected values, confidence intervals, anomalies, etc.) for different series returned by the query.
Iterate over returned timeseries by query to see how the model performed on different series, and whether the detected anomalies make sense in the context of the data and the use case (their % of total points, magnitude, duration, etc.).
Until satisfied with the results, finetune the model hyperparameters and domain knowledge settings in the Model Panel (or change the model type), and rerun anomaly detection on the queried data.
Once satisfied with the results, do the following.
Many tabs can be opened in parallel in the browser, so multiple experiments can be run in parallel, and the results can be compared by switching between tabs. Local settings (e.g. queries, time ranges, model configurations, etc.) are preserved in each tab, so different experiments do not interfere with each other.
Work with Results #
If the results do not look good, the model hyperparameters and domain knowledge settings can be further finetuned in the Model Panel, and anomaly detection can be rerun on the queried data until satisfactory results are achieved.
If the results look good, but should be shared with others first, timeseries can be downloaded as files by hitting the respective button in the Model Panel. See also configuration sharing section for details.
If the results look good and the model configuration should be deployed in production jobs of anomaly detection, the equivalent configuration in production-ready YAML format can be obtained by accessing the “YAML” Tab in the model configuration section and hitting the “Show Config” button to access (model-only or full) configuration to download/copy as a YAML file.
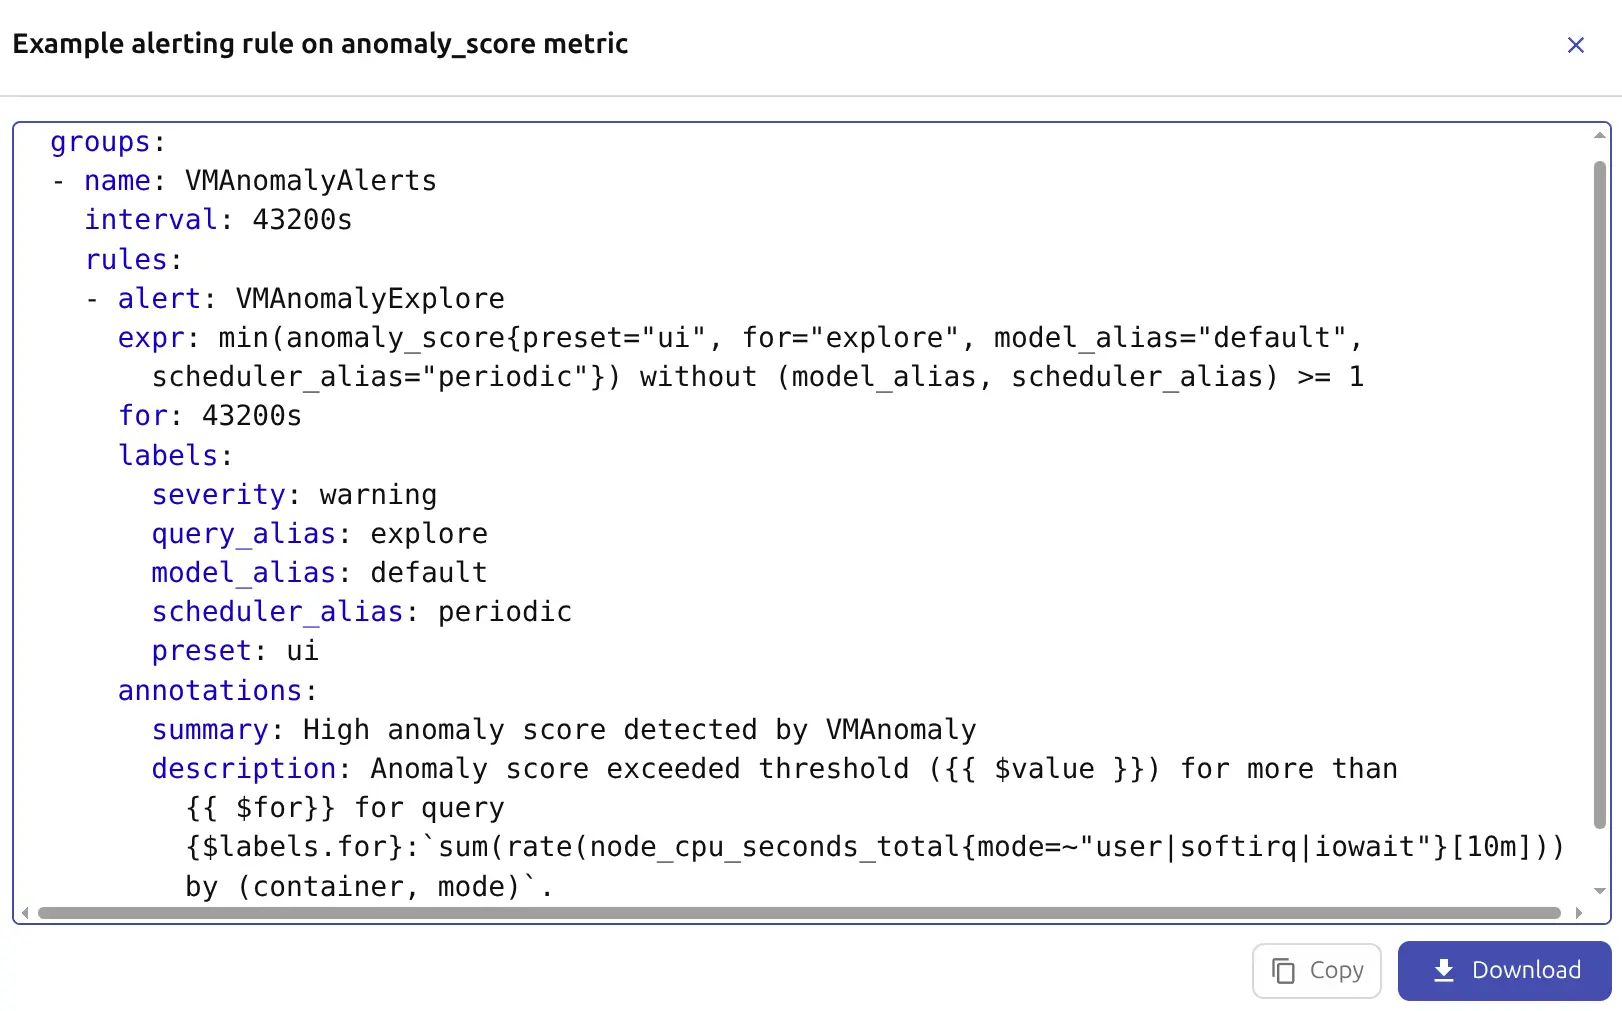
Available from v1.28.0 Example alerting rules are generated based on the current UI configuration. Hit the “Example Alert” button in the Model Panel to access and copy/download an example of parametrized vmalert alerting rule snippet in YAML format to finetune and use in production alerting setup.

Changelog #
v1.6.0 #
Released: 2026-04-02
vmanomaly version: v1.29.2
FEATURE: Now AI assistant can see and modify main UI components state (queries, time range, model configuration, etc.) to provide more contextual and accurate suggestions and actions.
FEATURE: Added support for UI to use reader-wise settings (credentials, TLS, etc.) for connecting to data sources, which otherwise would require having
vmauthin front of both UI and data sources, just for the UI to be able to connect to them. See Authentication section for details.
v1.5.1 #
Released: 2026-03-25
vmanomaly version: v1.29.1
FEATURE: GCP/AWS/OpenRouter Copilot LLM providers are now supported in addition to OpenAI and Anthropic, for more choice and flexibility in AI assistance. See AI Assistance section for details on supported providers and configuration.
BUGFIX: Now Visualization Panel correctly switches in between “query” and “detect” modes when respective buttons are hit in the Visualization Panel , without showing stale results from the previous mode, once running anomaly detection task is explicitly cancelled (regression introduced in v1.5.0 ).
BUGFIX: Fixed an issue with crypto.randomUUID introduced in v1.29.0 in UI copilot that led to the front app showing a blank page.
v1.5.0 #
Released: 2026-03-05
vmanomaly version: v1.29.0
- FEATURE: Allowed AI assistance use for documentation Q&A, model configuration suggestion and application, optionally backed by MCP Server tools . Please refer to AI Assistance section for details.
- FEATURE: Added filtering of timeseries in the Visualization Panel by labels and statistics (e.g. anomaly count) to focus on the most relevant series when many series are returned by the query.
- BUGFIX: Fixed missing datapoints in BacktestingScheduler windows combined with exact mode , leading to “gaps” in plotted predictions and scores.
v1.4.3 #
Released: 2026-02-09
vmanomaly version: v1.28.7
Update color palette in dark theme for more contrast and better visibility of anomalies and confidence intervals in the Visualization Panel.
Align Model Panel content to improve layout for smaller screens and embedded documentation.
v1.4.2 #
Released: 2026-01-17
vmanomaly version: v1.28.5
Enable preconfigured default UI state via url-encoded
ui_default_state, so/vmui/opens with the intended model settings, time range, query and other parameters. This improves user experience by allowing direct access to specific views without manual configuration each time. See Default State section for details.Enable autocomplete for VictoriaLogs / VictoriaTraces data sources in query input area.
v1.4.1 #
Released: 2026-01-12
vmanomaly version: v1.28.4
- FEATURE: Allow
path_prefixparameter to override the server’s configured URL path prefix for all HTTP routes. This is useful when the UI is served behind a reverse proxy that modifies the base path. For example, if the server is configured withpath_prefix: /my-app, accessing the UI at/my-app/will work correctly even if the proxy serves it at a different base path. It can be set in theserversection of the configuration file.
v1.4.0 #
Released: 2025-12-11
vmanomaly version: v1.28.2
- FEATURE: Added an option to show consecutive anomalies (if N points in a row exceed anomaly threshold T) in the Visualization Panel, to reduce visual clutter when many anomalies are detected in a row. The option is available as “Streaks” button in the
Model Panel
. Respective “streaks: N” stats appears in legend for each series. Example alerting rule’s
forparameter is adjusted accordingly if streaks are used. - FEATURE: Timeseries are now sortable in the legend of the Visualization Panel by clicking on the respective column headers (both label- and statistics-based columns are supported, e.g., sort by series name, anomaly count).
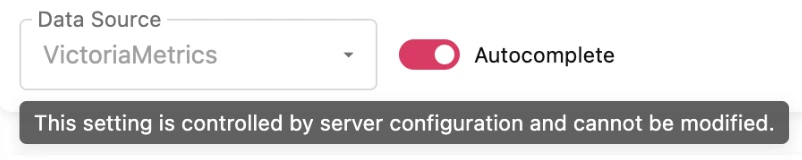
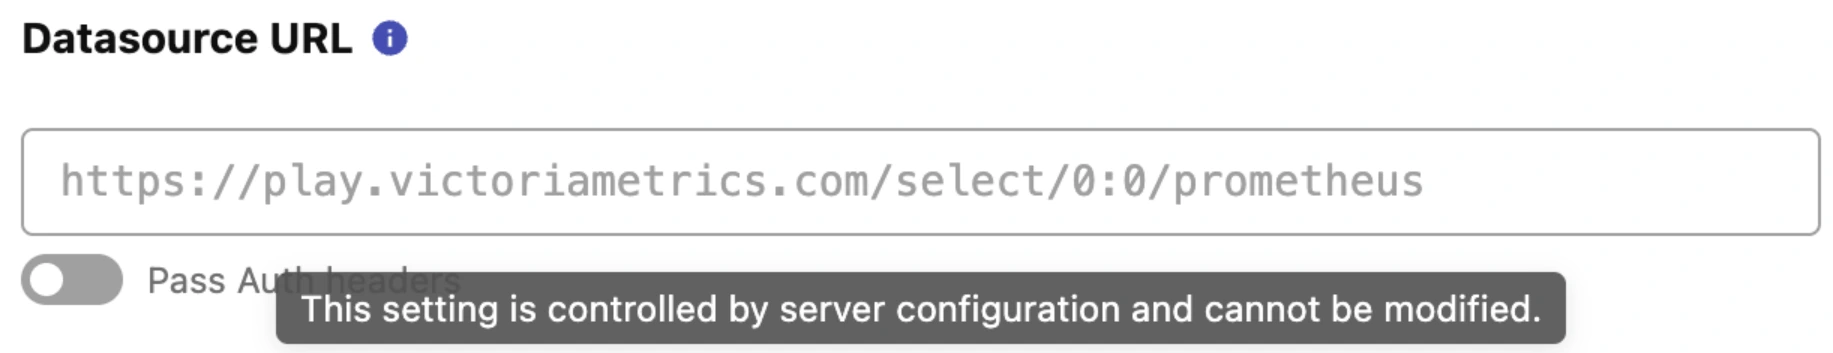
- IMPROVEMENT: It’s now possible to pre-configure datasource, so the UI users cannot re-configure datasource from UI or change its type. Suitable for internal team-serving deployments. Please refer to pre-configured datasource section for details.
v1.3.0 #
Released: 2025-12-01
vmanomaly version: v1.28.1
- FEATURE:
Forecasting mode
is now available in the UI for models that support it (e.g.,
Prophet), allowing users to visualize model predictions into the future (alongside with confidence intervals). Please use “forecast offsets” parameter in the wizard to set the desired forecast horizon(s). - IMPROVEMENT: Plot area in the Visualization Panel now supports vertical resizing by dragging its right bottom border, followed by respective recalculations of the tick grid of both y-axes.
- IMPROVEMENT: Added explicit versioning information in the UI footer, showing the current service and UI versions for easier tracking and debugging.
- IMPROVEMENT: Tooltips inside model wizard menu are now persistent upon (i) icon click and rendered as markdown. To close the tooltip, click outside of it or on the icon again.
v1.2.0 #
Released: 2025-11-17
vmanomaly version: v1.28.0
FEATURE: Added “exact” mode to use in combination with “infer every” control for online models such as
mad_onlineorquantile_online, to provide unbiased estimates of how production scheduler would perform anomaly detection on incoming data streams. In “exact” mode, the model is updated exactly at every “infer every” micro-batch interval, at a cost of increased computation time. See model panel for details.FEATURE: Added “Example Alert” button in the Model Panel to provide an example of parametrized vmalert alerting rule snippet based on the current UI configuration.
IMPROVEMENT: Added support for clipboard copy in addition to existing file download of the model/service configuration in YAML format from the Model Panel configuration menu.
v1.1.0 #
Released: 2025-10-31
vmanomaly version: v1.27.0
A bug, found in v1.27.0 that prevents “Detect Anomalies” button ( model panel ) from working has been fixed in the patch release v1.27.1 . Please do the upgrade.
FEATURE: Added support of auth headers, that can be forwarded from vmanomaly to datasources configured in the UI (VictoriaMetrics, VictoriaLogs), see authentication for details.
FEATURE: queries (
config.reader.queries.[xxx].exprvalues) if mixed mode is used are read from the server reader config on the first UI initialization, to ease the exploration of existing production queries without the need to retype them in the UI. Press “show history” button next to “execute query” button (in the Query Explorer section) and choose the tab “Server Queries”.IMPROVEMENT: autocomplete of example parameters for model param fields by hitting Tab key in the Model Settings wizard , e.g. hitting Tab in the “detection direction” field will cycle through the available options.
IMPROVEMENT: anomaly threshold element on Model Panel is now reactive - no need to refit a model (“Detect Anomalies” button) to see the effect from changed anomaly threshold value.
IMPROVEMENT: datasource value is initialized from the server reader config (on the first UI initialization) if mixed mode is used . Can be reset to the default value anytime by hitting the “Reset to Default” button next to the datasource field in the Settings Panel .
v1.0.0 #
Released: 2025-10-02
vmanomaly version: v1.26.0
Initial public release of the vmanomaly UI.