This guide walks you through deploying VictoriaMetrics and VictoriaLogs on Kubernetes, and collecting metrics and logs from a Go application either directly or via the OpenTelemetry Collector .
Pre-Requirements #
Installation #
In order to collect metrics and logs, install the following components:
VictoriaMetrics Installation #
Create a config file for the VictoriaMetrics chart. The following enables conversion of OpenTelemetry (OTEL) metric names into the Prometheus canonical format:
      cat << EOF > vm-values.yaml
server:
  extraArgs:
    opentelemetry.usePrometheusNaming: true
EOF
Install the VictoriaMetrics Helm repo:
      helm repo add vm https://victoriametrics.github.io/helm-charts/
helm repo update
Install the VictoriaMetrics single-server version:
helm install victoria-metrics vm/victoria-metrics-single -f vm-values.yaml
Verify it’s up and running:
      kubectl get pods
# NAME                                                READY   STATUS    RESTARTS   AGE
# victoria-metrics-victoria-metrics-single-server-0   1/1     Running   0          3m1s
The VictoriaMetrics Helm chart provides the following URL for writing data:
      Write URL inside the kubernetes cluster:
  http://victoria-metrics-victoria-metrics-single-server.default.svc.cluster.local.:8428/<protocol-specific-write-endpoint>

All supported write endpoints can be found at https://docs.victoriametrics.com/victoriametrics/single-server-victoriametrics/#how-to-import-time-series-data.
For OpenTelemetry, the VictoriaMetrics write endpoint is:
http://victoria-metrics-victoria-metrics-single-server.default.svc.cluster.local.:8428/opentelemetry/v1/metrics
VictoriaLogs Installation #
Install VictoriaLogs:
helm install victoria-logs vm/victoria-logs-single
Verify it’s up and running:
      kubectl get pods
# NAME                                            READY   STATUS    RESTARTS   AGE
# victoria-logs-victoria-logs-single-server-0     1/1     Running   0          1m10s
The VictoriaLogs Helm chart provides the following URL for writing data:
      Write URL inside the kubernetes cluster:
  http://victoria-logs-victoria-logs-single-server.default.svc.cluster.local.:9428/<protocol-specific-write-endpoint>

All supported write endpoints can be found at https://docs.victoriametrics.com/victorialogs/data-ingestion/
For OpenTelemetry, the VictoriaLogs write endpoint is:
http://victoria-logs-victoria-logs-single-server.default.svc.cluster.local.:9428/insert/opentelemetry/v1/logs
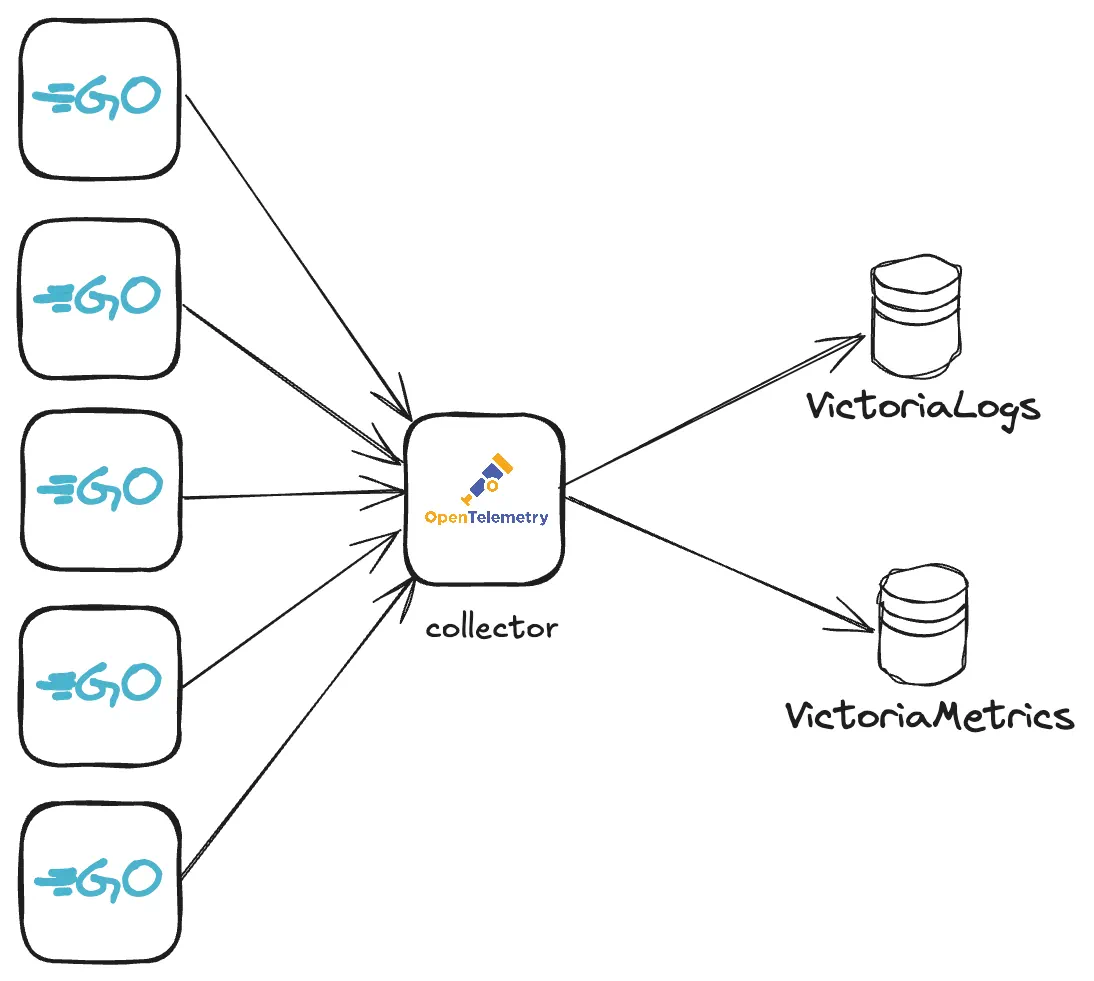
OpenTelemetry Collector with VictoriaMetrics and VictoriaLogs #
The OpenTelemetry Collector can be configured to route incoming metrics and logs from applications to the VictoriaMetrics and VictoriaLogs services running in the Kubernetes cluster.
Add the OpenTelemetry Collector Helm repo:
      helm repo add open-telemetry https://open-telemetry.github.io/opentelemetry-helm-charts
helm repo update
Create a config file for the OpenTelemetry Collector:
      cat << EOF > otel-values.yaml
mode: deployment
image:
  repository: "otel/opentelemetry-collector-contrib"
presets:
  clusterMetrics:
    enabled: true
  logsCollection:
    enabled: true
config:
  # deltatocumulative processor is needed to convert metrics with delta temporality to cumulative temporality.
  # VictoriaMetrics doesn't support delta temporality. Skip this processor if you don't use delta temporality.
  processors:
    deltatocumulative:
      max_stale: 5m
  receivers:
    otlp:
      protocols:
        grpc:
          endpoint: 0.0.0.0:4317
        http:
          endpoint: 0.0.0.0:4318
  exporters:
    otlphttp/victoriametrics:
      compression: gzip
      encoding: proto
      # Setting below will work for sending data to VictoriaMetrics single-node version.
      # Cluster version of VictoriaMetrics will require a different URL - https://docs.victoriametrics.com/victoriametrics/cluster-victoriametrics/#url-format
      metrics_endpoint: http://victoria-metrics-victoria-metrics-single-server.default.svc.cluster.local:8428/opentelemetry/v1/metrics
      logs_endpoint: http://victoria-logs-victoria-logs-single-server.default.svc.cluster.local:9428/insert/opentelemetry/v1/logs
      tls:
        insecure: true
  service:
    pipelines:
      logs:
        receivers: [otlp]
        processors: []
        exporters: [otlphttp/victoriametrics]
      metrics:
        receivers: [otlp]
        processors: [deltatocumulative]
        exporters: [otlphttp/victoriametrics]
EOF
Install the OpenTelemetry Collector:
helm upgrade -i otel open-telemetry/opentelemetry-collector -f otel-values.yaml
Check that the OpenTelemetry Collector pod is up and running:
      kubectl get pods
# NAME                                            READY   STATUS    RESTARTS   AGE
# otel-opentelemetry-collector-7467bbb559-2pq2n   1/1     Running   0          23m
Confirm that metrics and logs are being ingested #
To confirm metrics are being ingested by the Collector, port forward the VictoriaMetrics service:
kubectl port-forward svc/victoria-metrics-victoria-metrics-single-server 8428
Visit http://localhost:8428/vmui/#/?g0.expr=k8s_container_ready&g0.tab=1
to check if metric k8s_container_ready is present.
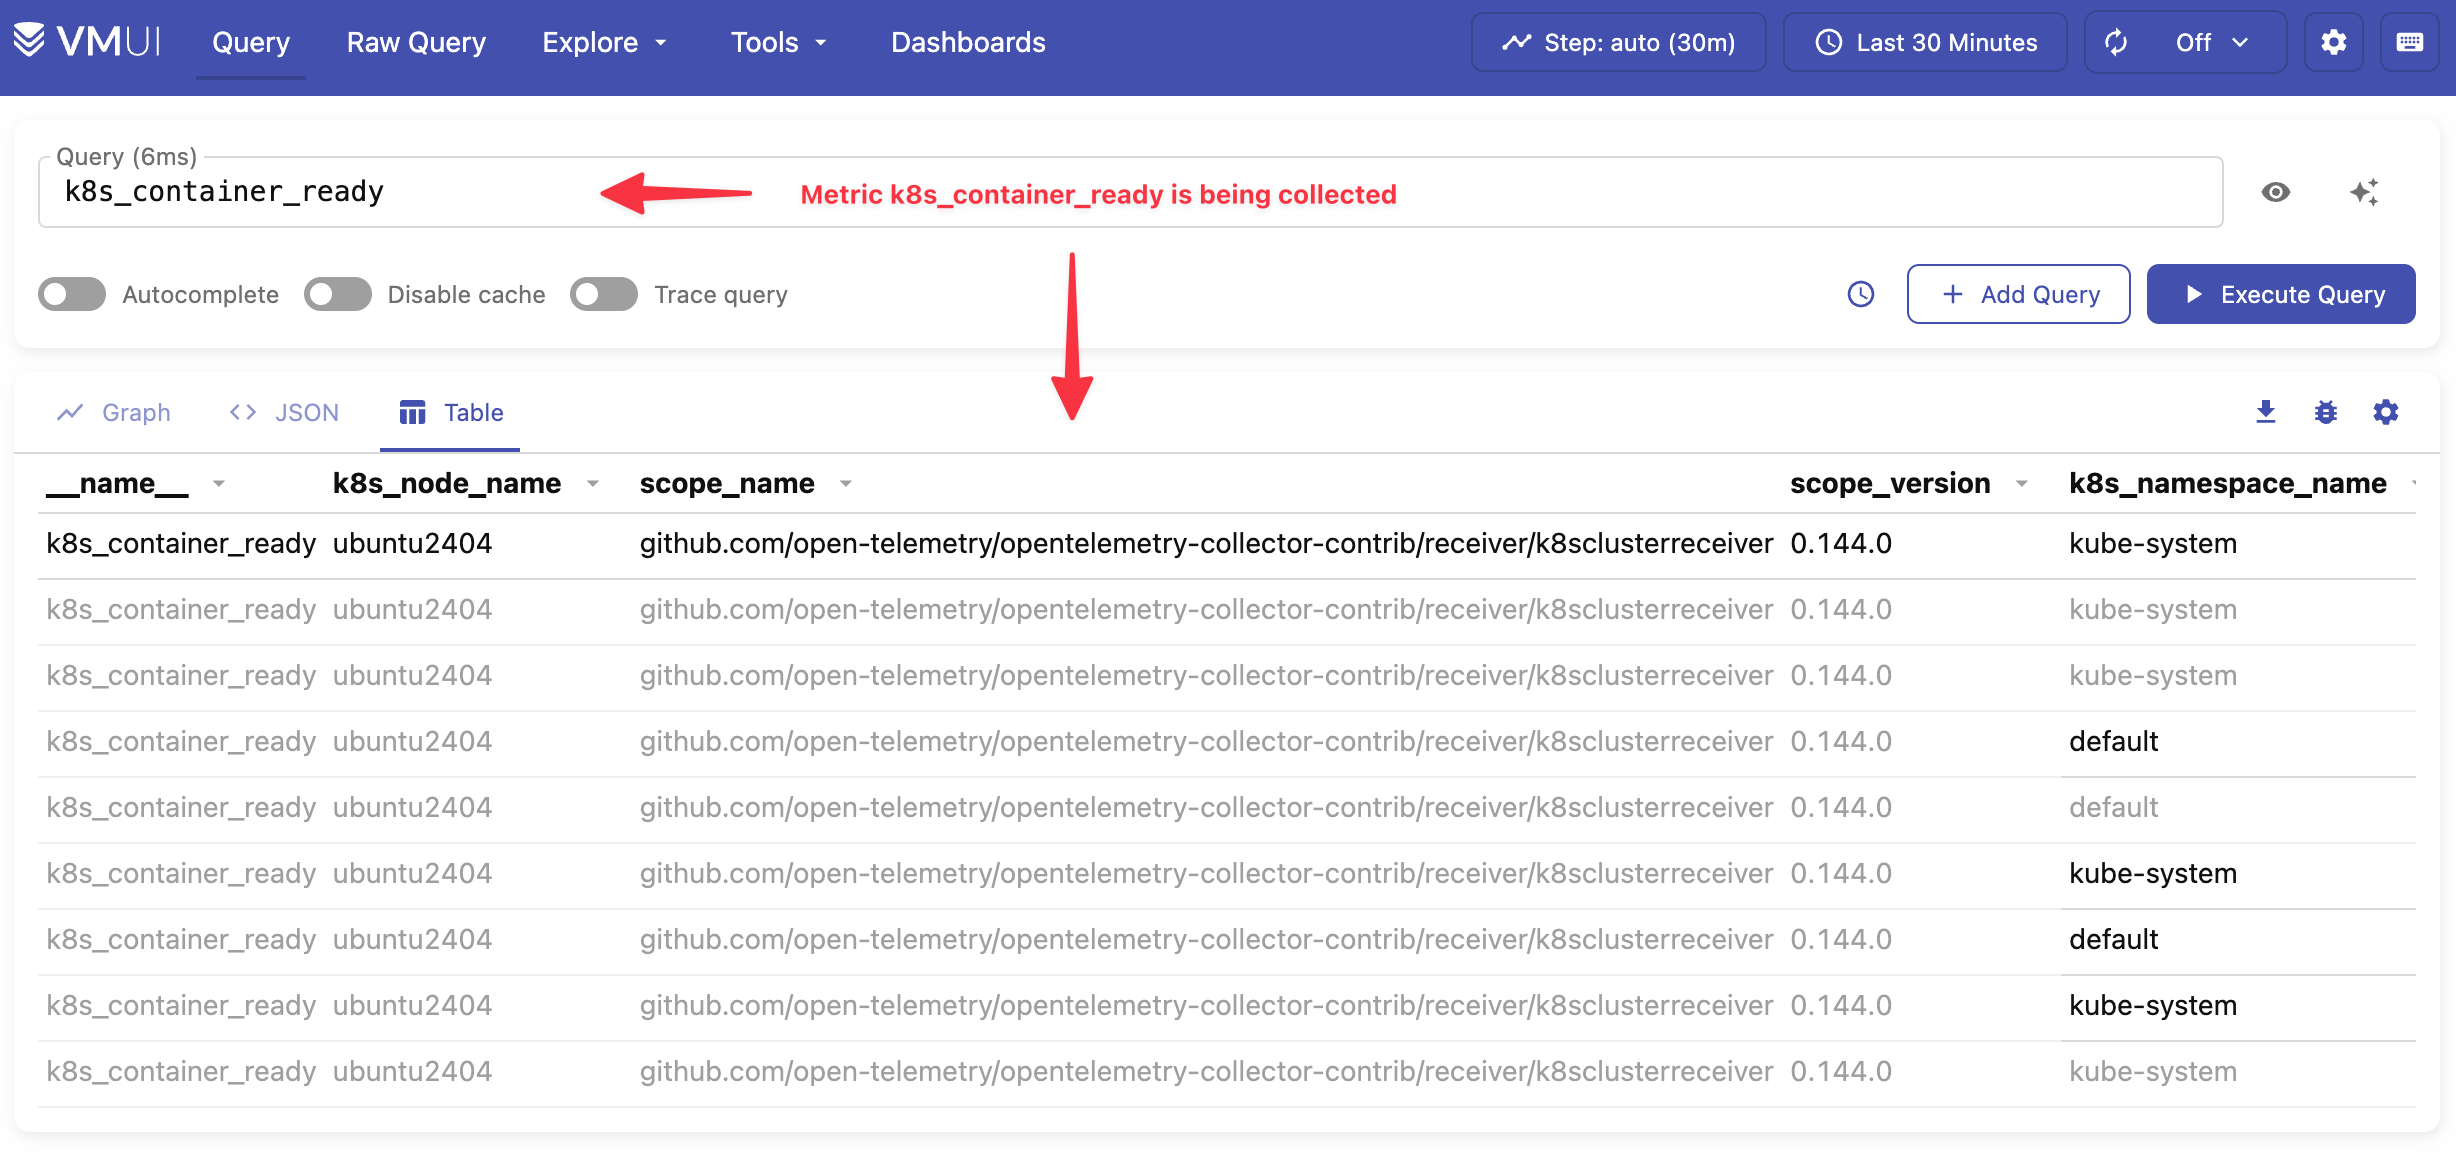
k8s_container_ready metricUse the cardinality explorer to inspect all available metrics.
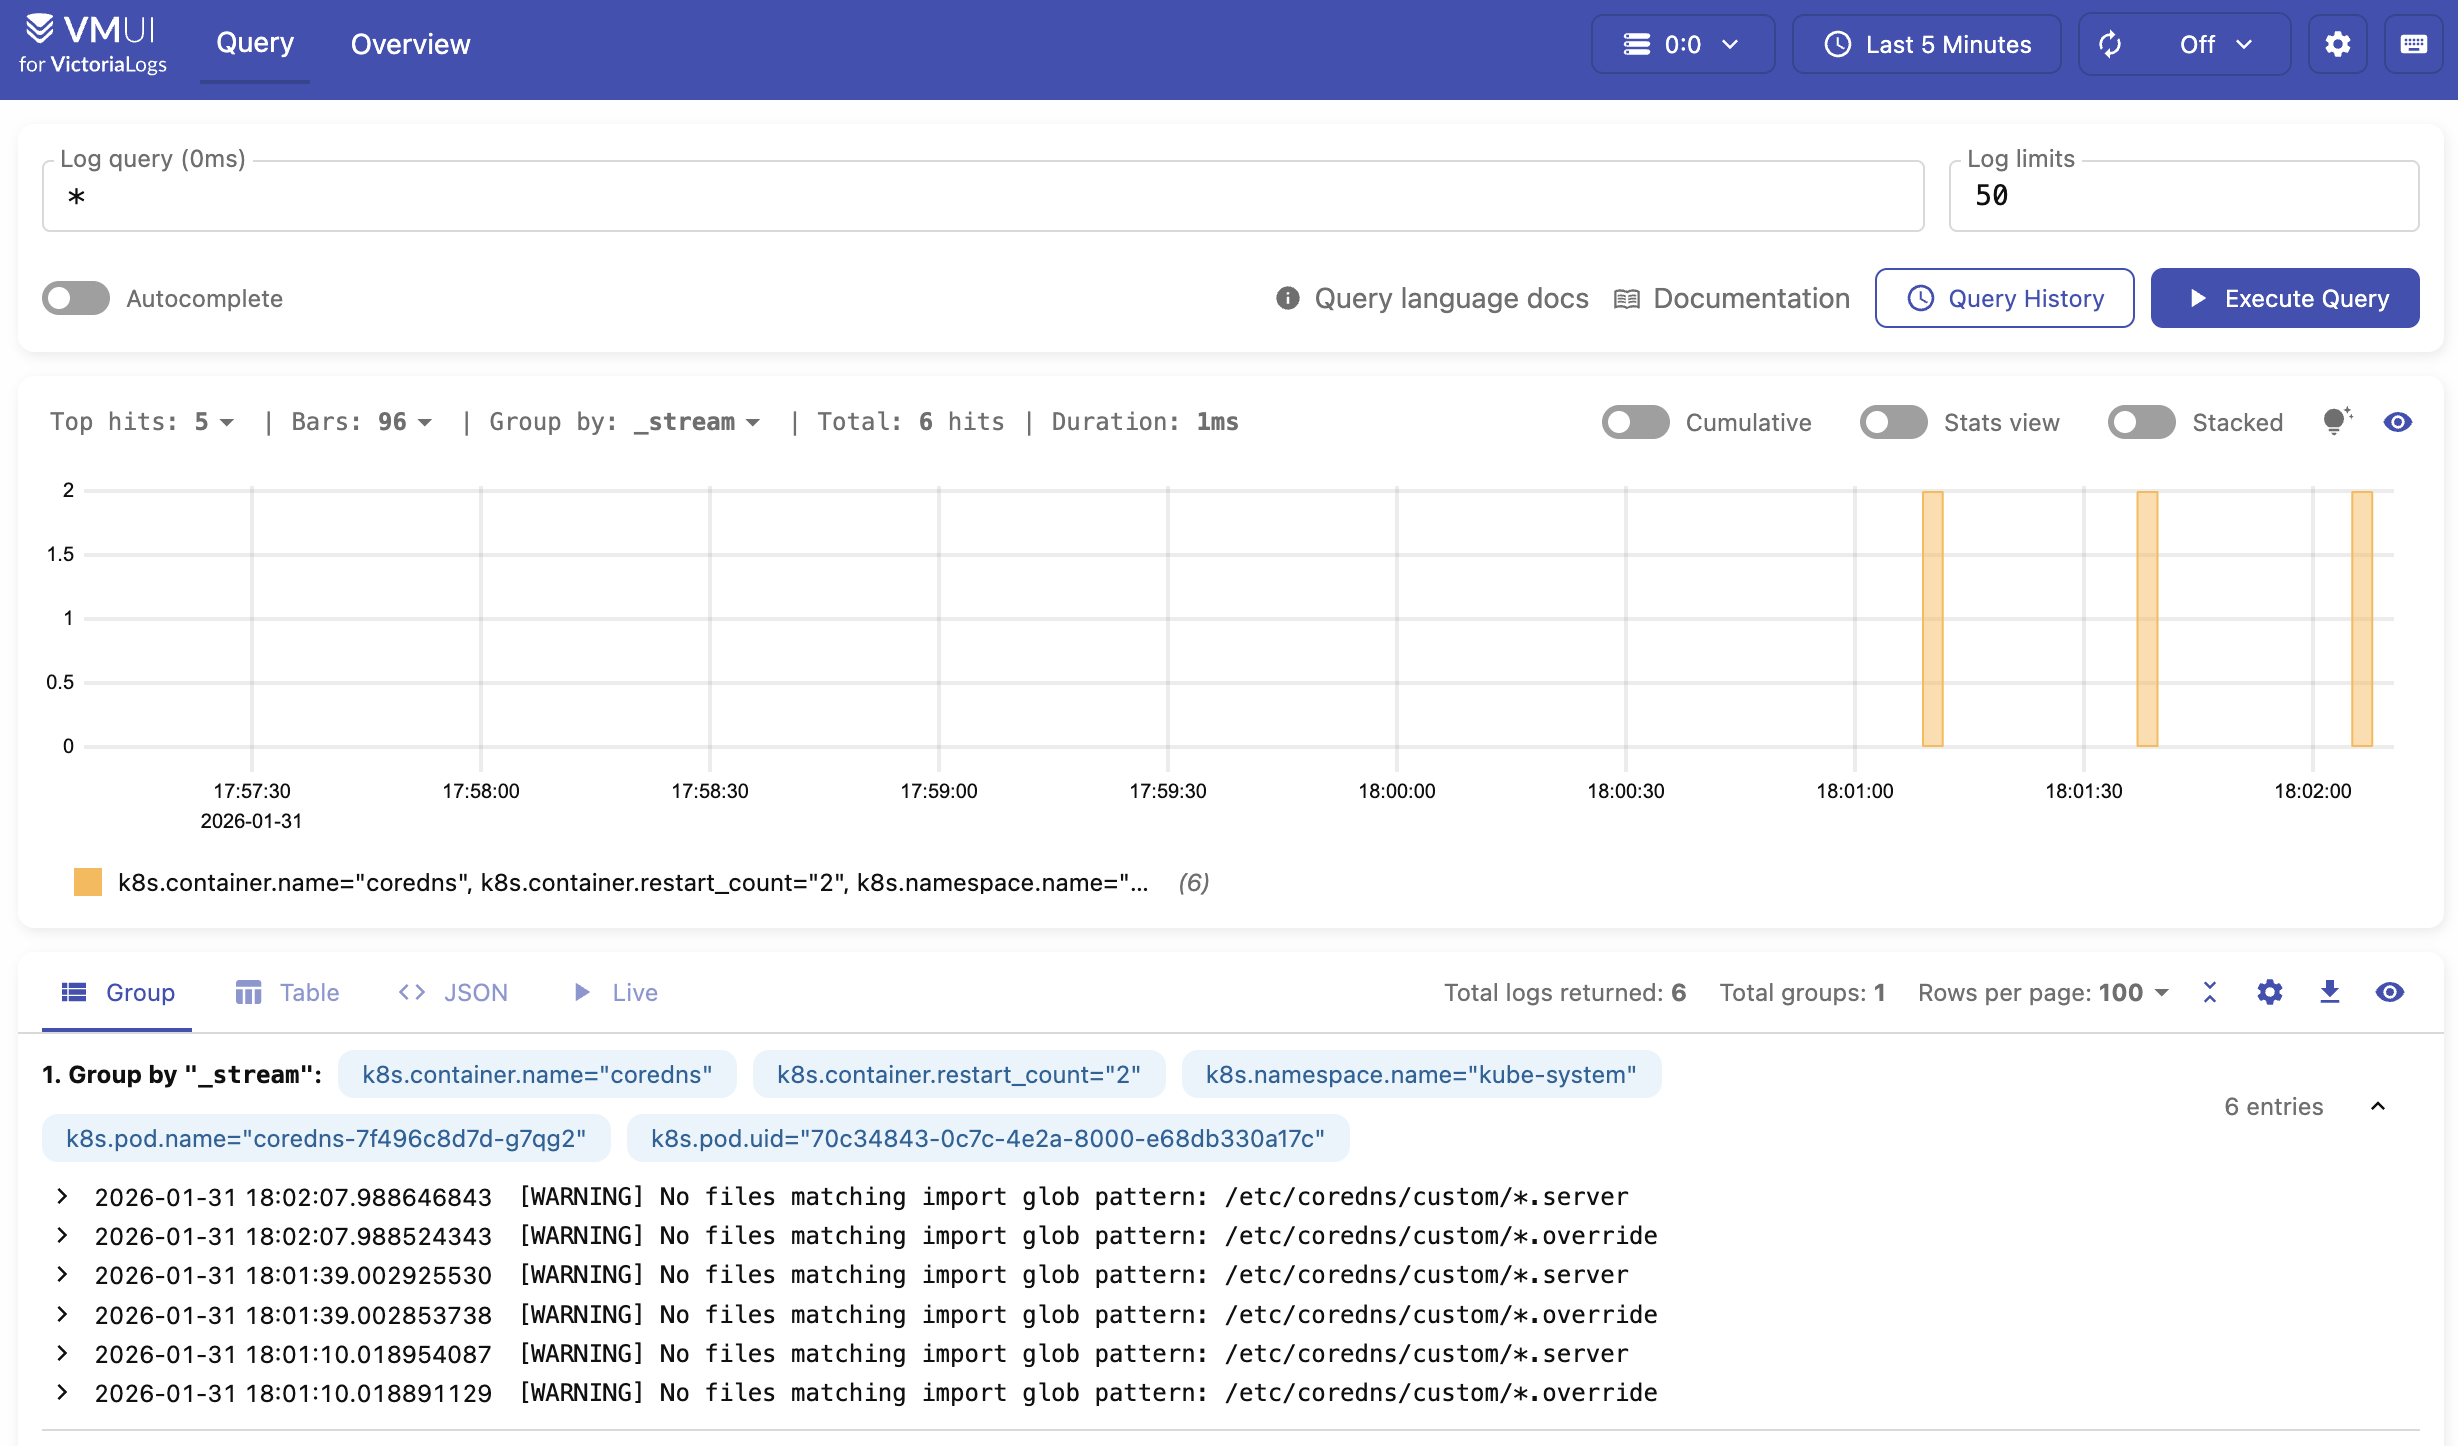
To confirm that logs are being ingested by the Collector, port forward the VictoriaLogs service with the following command:
kubectl port-forward svc/victoria-logs-victoria-logs-single-server 9428
Visit http://localhost:9428/select/vmui to check if logs ingested by Collector are present.
See the OpenTelemetry docs for all configuration options.
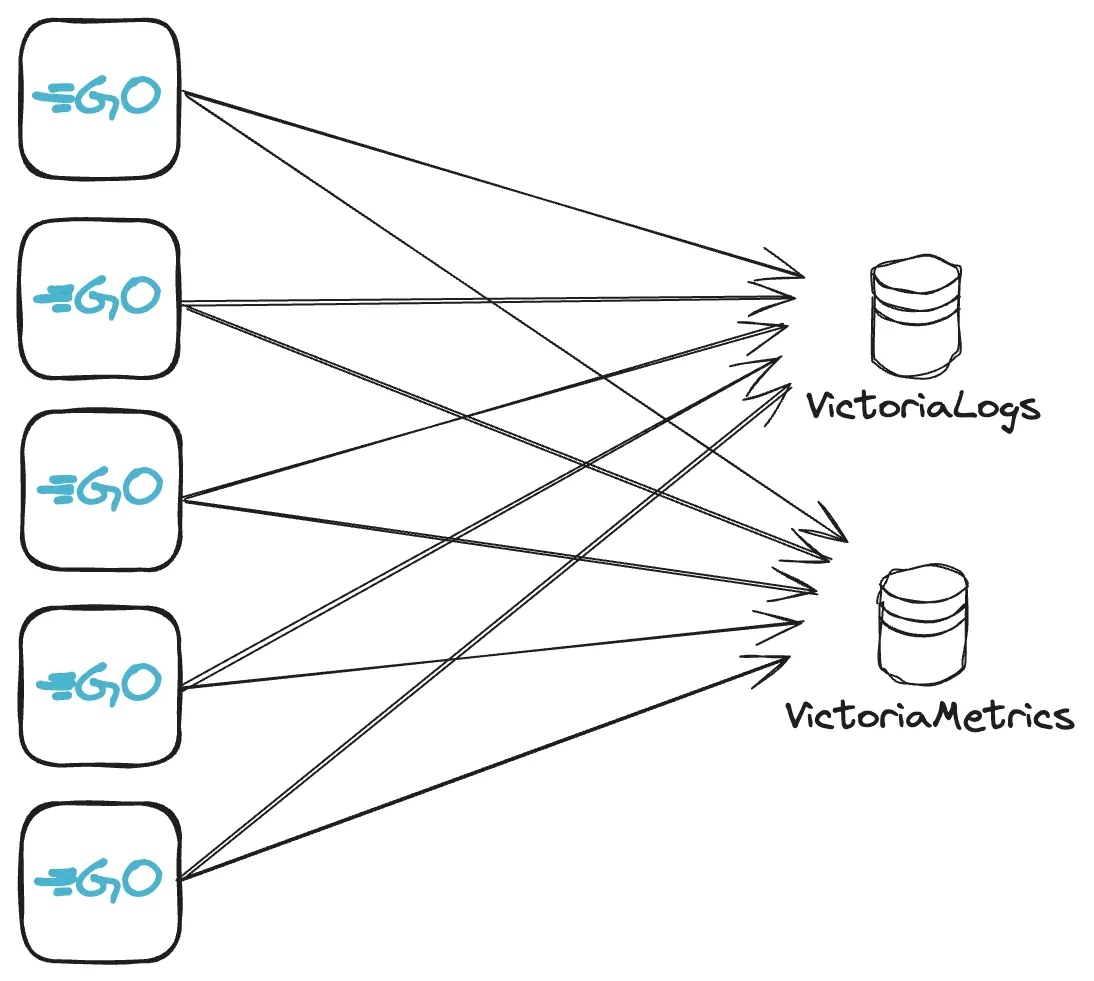
Sending metrics and logs from Go application #
Metrics and logs can be sent via OpenTelemetry instrumentation libraries. You can use any compatible OpenTelemetry instrumentation clients in your application.
In our example, we’ll create a web server in Go , with metrics and logs instrumented and sent over the OpenTelemetry Collector. The Collector then forwards the received data to either VictoriaMetrics or VictoriaLogs.
Sending to OpenTelemetry Collector #
Download the
example code
and rename it as main.go. The example code implements a dice roll web server that uses the OpenTelemetry SDK to send data to the OpenTelemetry Collector at http://localhost:4318.
See how to set up and run OpenTelemetry Collector here .
First, port forward the OpenTelemetry Collector service in your cluster:
kubectl port-forward svc/otel-opentelemetry-collector 4318
Next, open a terminal in the same directory as the example code and execute the following commands:
      go mod init vm/otel
go mod tidy
Now try running the application:
go run .
By default, the application in the example listens on http://localhost:8080. Start sending requests
to the http://localhost:8080/rolldice endpoint to generate some metrics.
Run the following command to send 20 requests to the dice roll example application:
for i in `seq 1 20`; do curl http://localhost:8080/rolldice; done
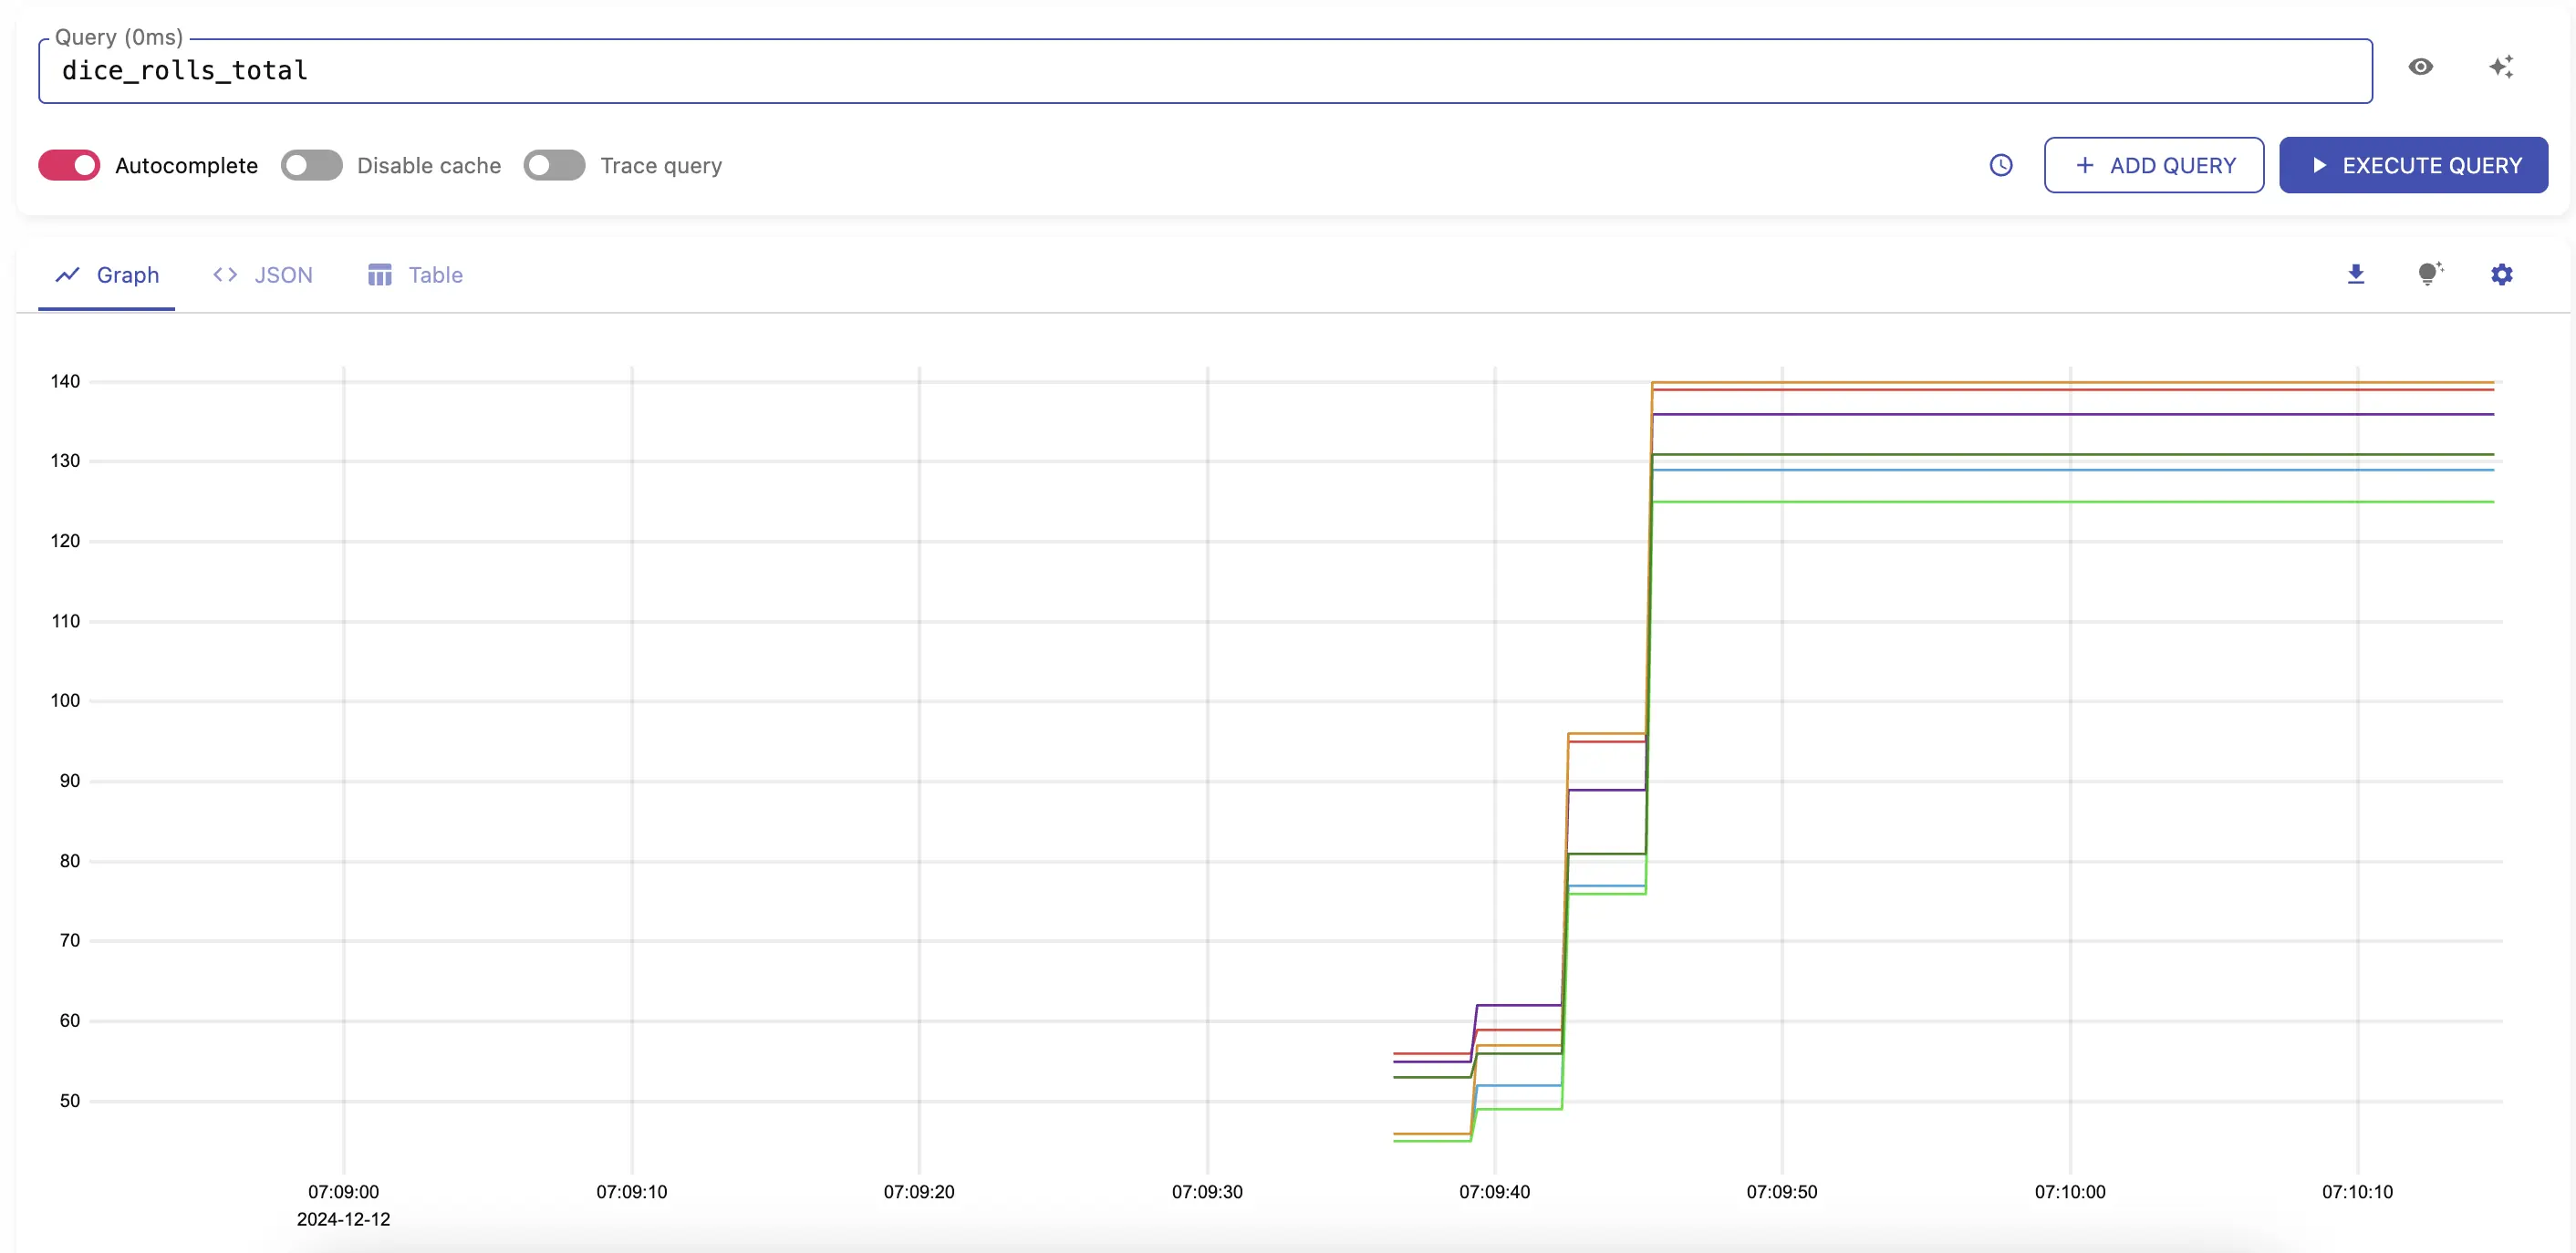
After a few seconds, you should start seeing metrics sent to VictoriaMetrics by visiting http://localhost:8428/vmui/#/?g0.expr=dice_rolls_total
in your browser or by querying the metric dice_rolls_total in the UI interface.
dice_rolls_totalLogs should be available by visiting http://localhost:9428/select/vmui
using query service.name: unknown_service:otel.
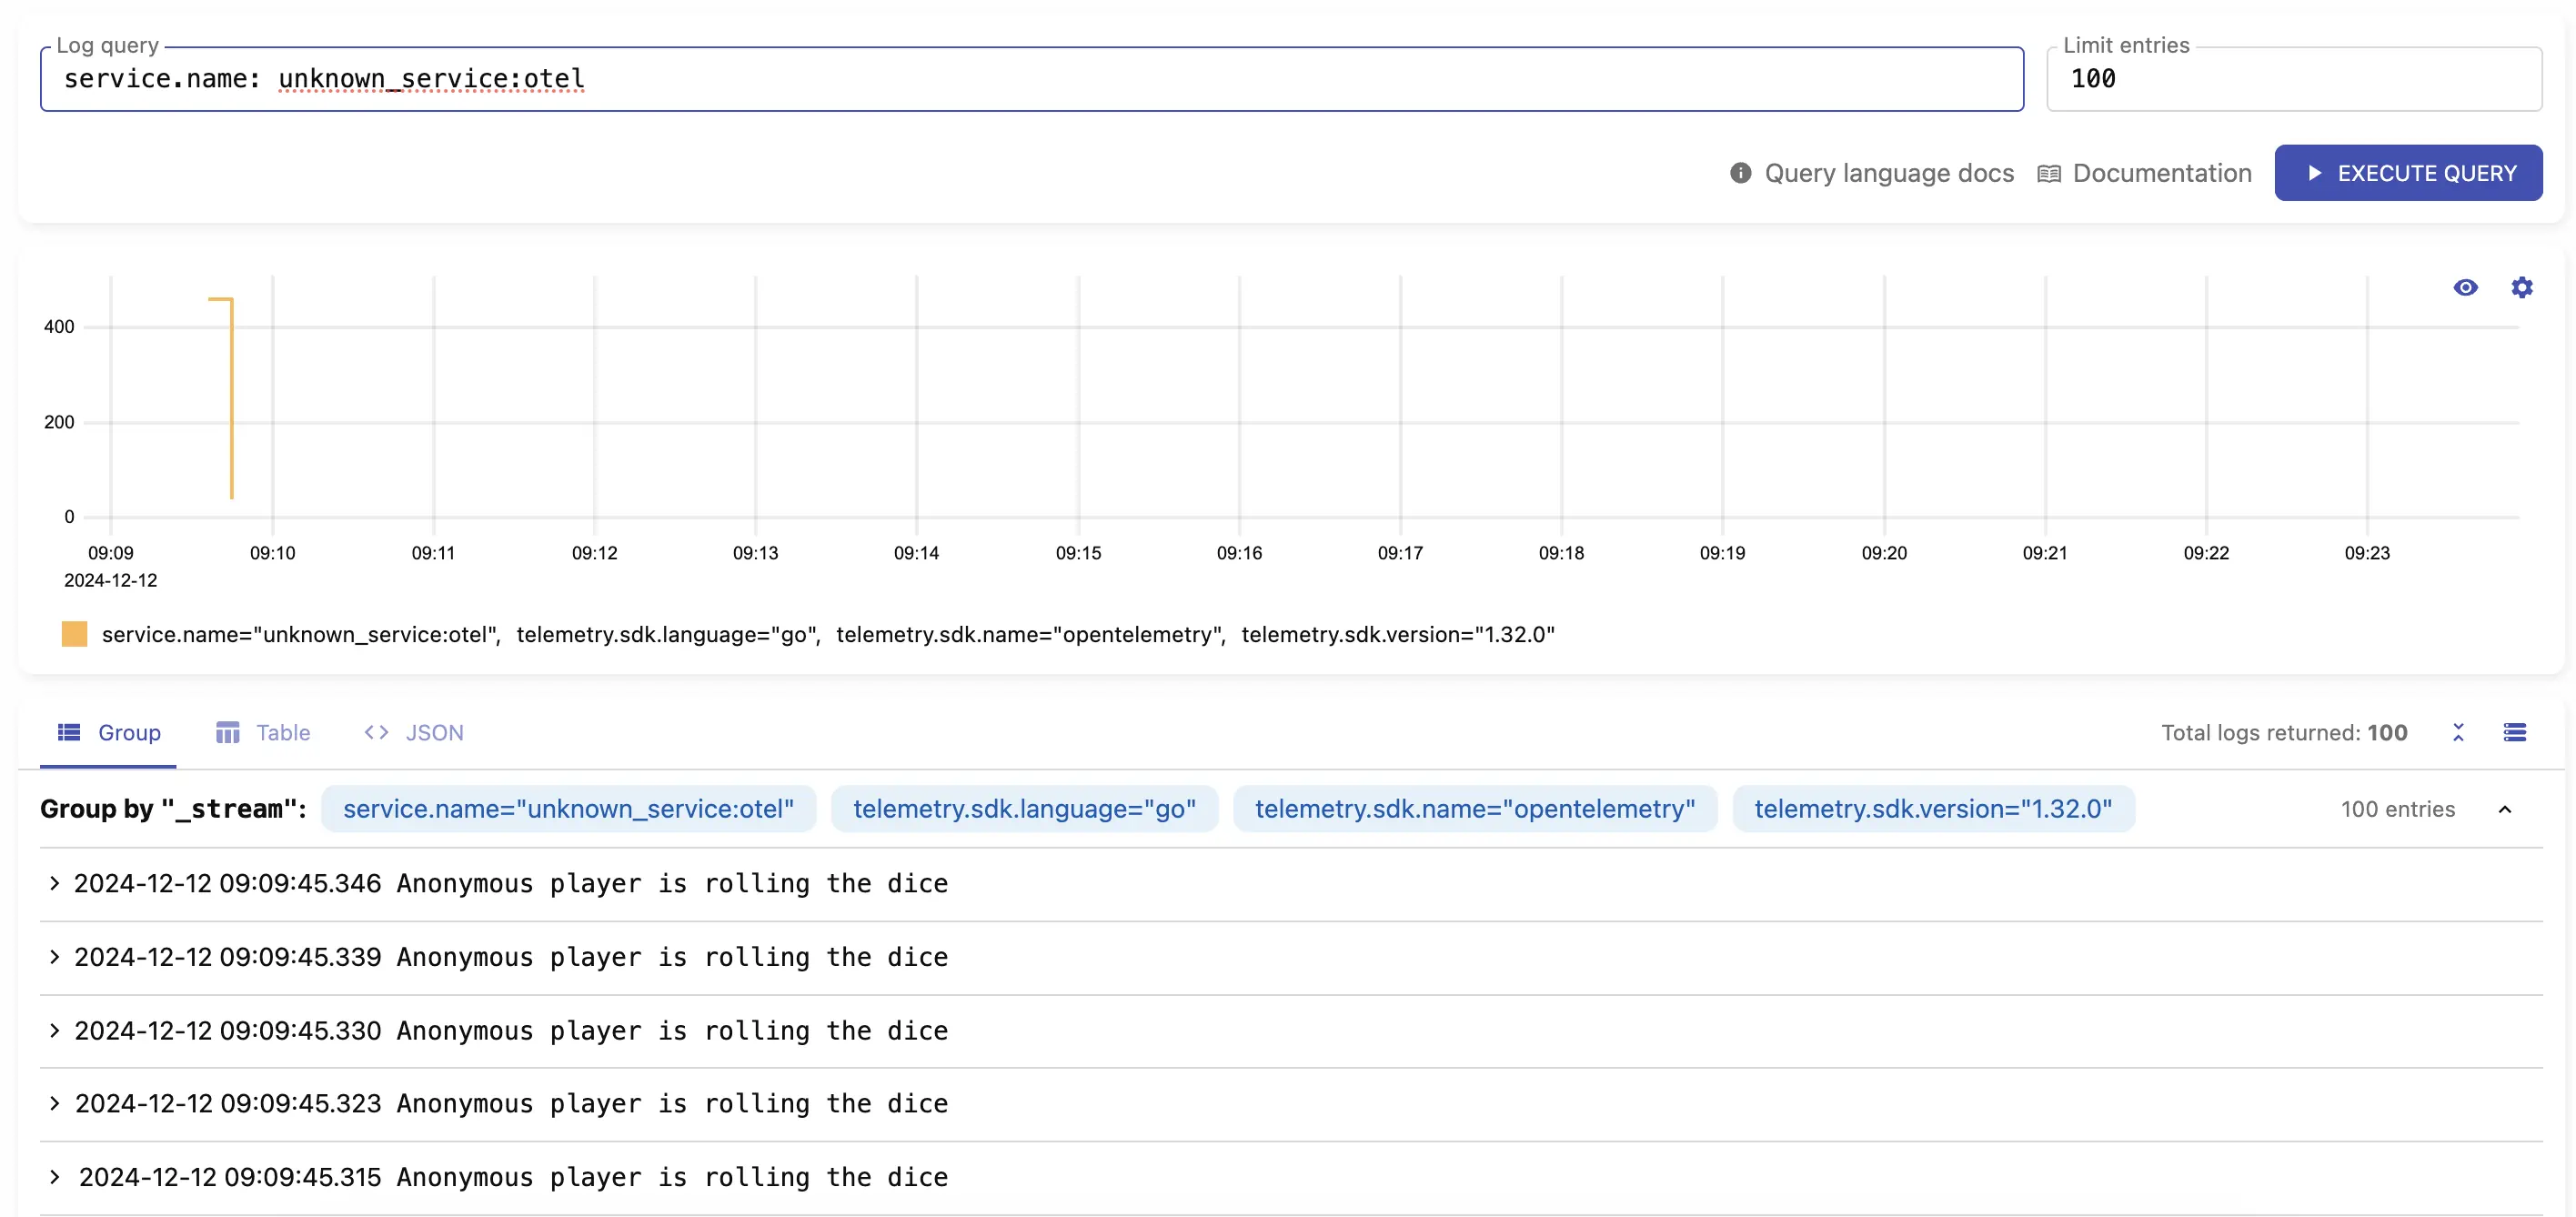
service.name: unknown_service:otelSending without OpenTelemetry Collector #
You can send telemetry directly from your application to VictoriaMetrics and VictoriaLogs; the Collector is optional. You may use any OpenTelemetry instrumentation client to communicate directly with VictoriaMetrics and VictoriaLogs.
This time, we’ll run a different web server, also in Go and instrumented with metrics and logs. This demo application sends telemetry data directly to VictoriaMetrics and VictoriaLogs services.
Download the
example code
and rename it as main.go. In the same directory, execute the following commands:
      go mod init vm/otel
go mod tidy
The example implements a web server with two HTTP handlers: /api/slow and /api/fast. Start the application with:
      go run main.go
2024/03/25 19:27:41 Starting web server...
2024/03/25 19:27:41 web server started at localhost:8081.
Make sure that VictoriaMetrics and VictoriaLogs are available locally at their default ports. In a separate terminal, port forward the VictoriaMetrics and VictoriaLogs services:
      # port-forward victoriametrics to ingest metrics
kubectl port-forward svc/victoria-metrics-victoria-metrics-single-server 8428
# port-forward victorialogs to ingest logs
kubectl port-forward svc/victoria-logs-victoria-logs-single-server 9428
Generate a few HTTP requests to both routes so the application sends metrics and logs to VictoriaMetrics and VictoriaLogs.
      for i in `seq 1 20`; do curl http://localhost:8081/api/fast; done
for i in `seq 1 5`; do curl http://localhost:8081/api/slow; done
After a few seconds, you should start seeing metrics sent to VictoriaMetrics by visiting http://localhost:8428/vmui/#/?g0.expr=http_requests_total .
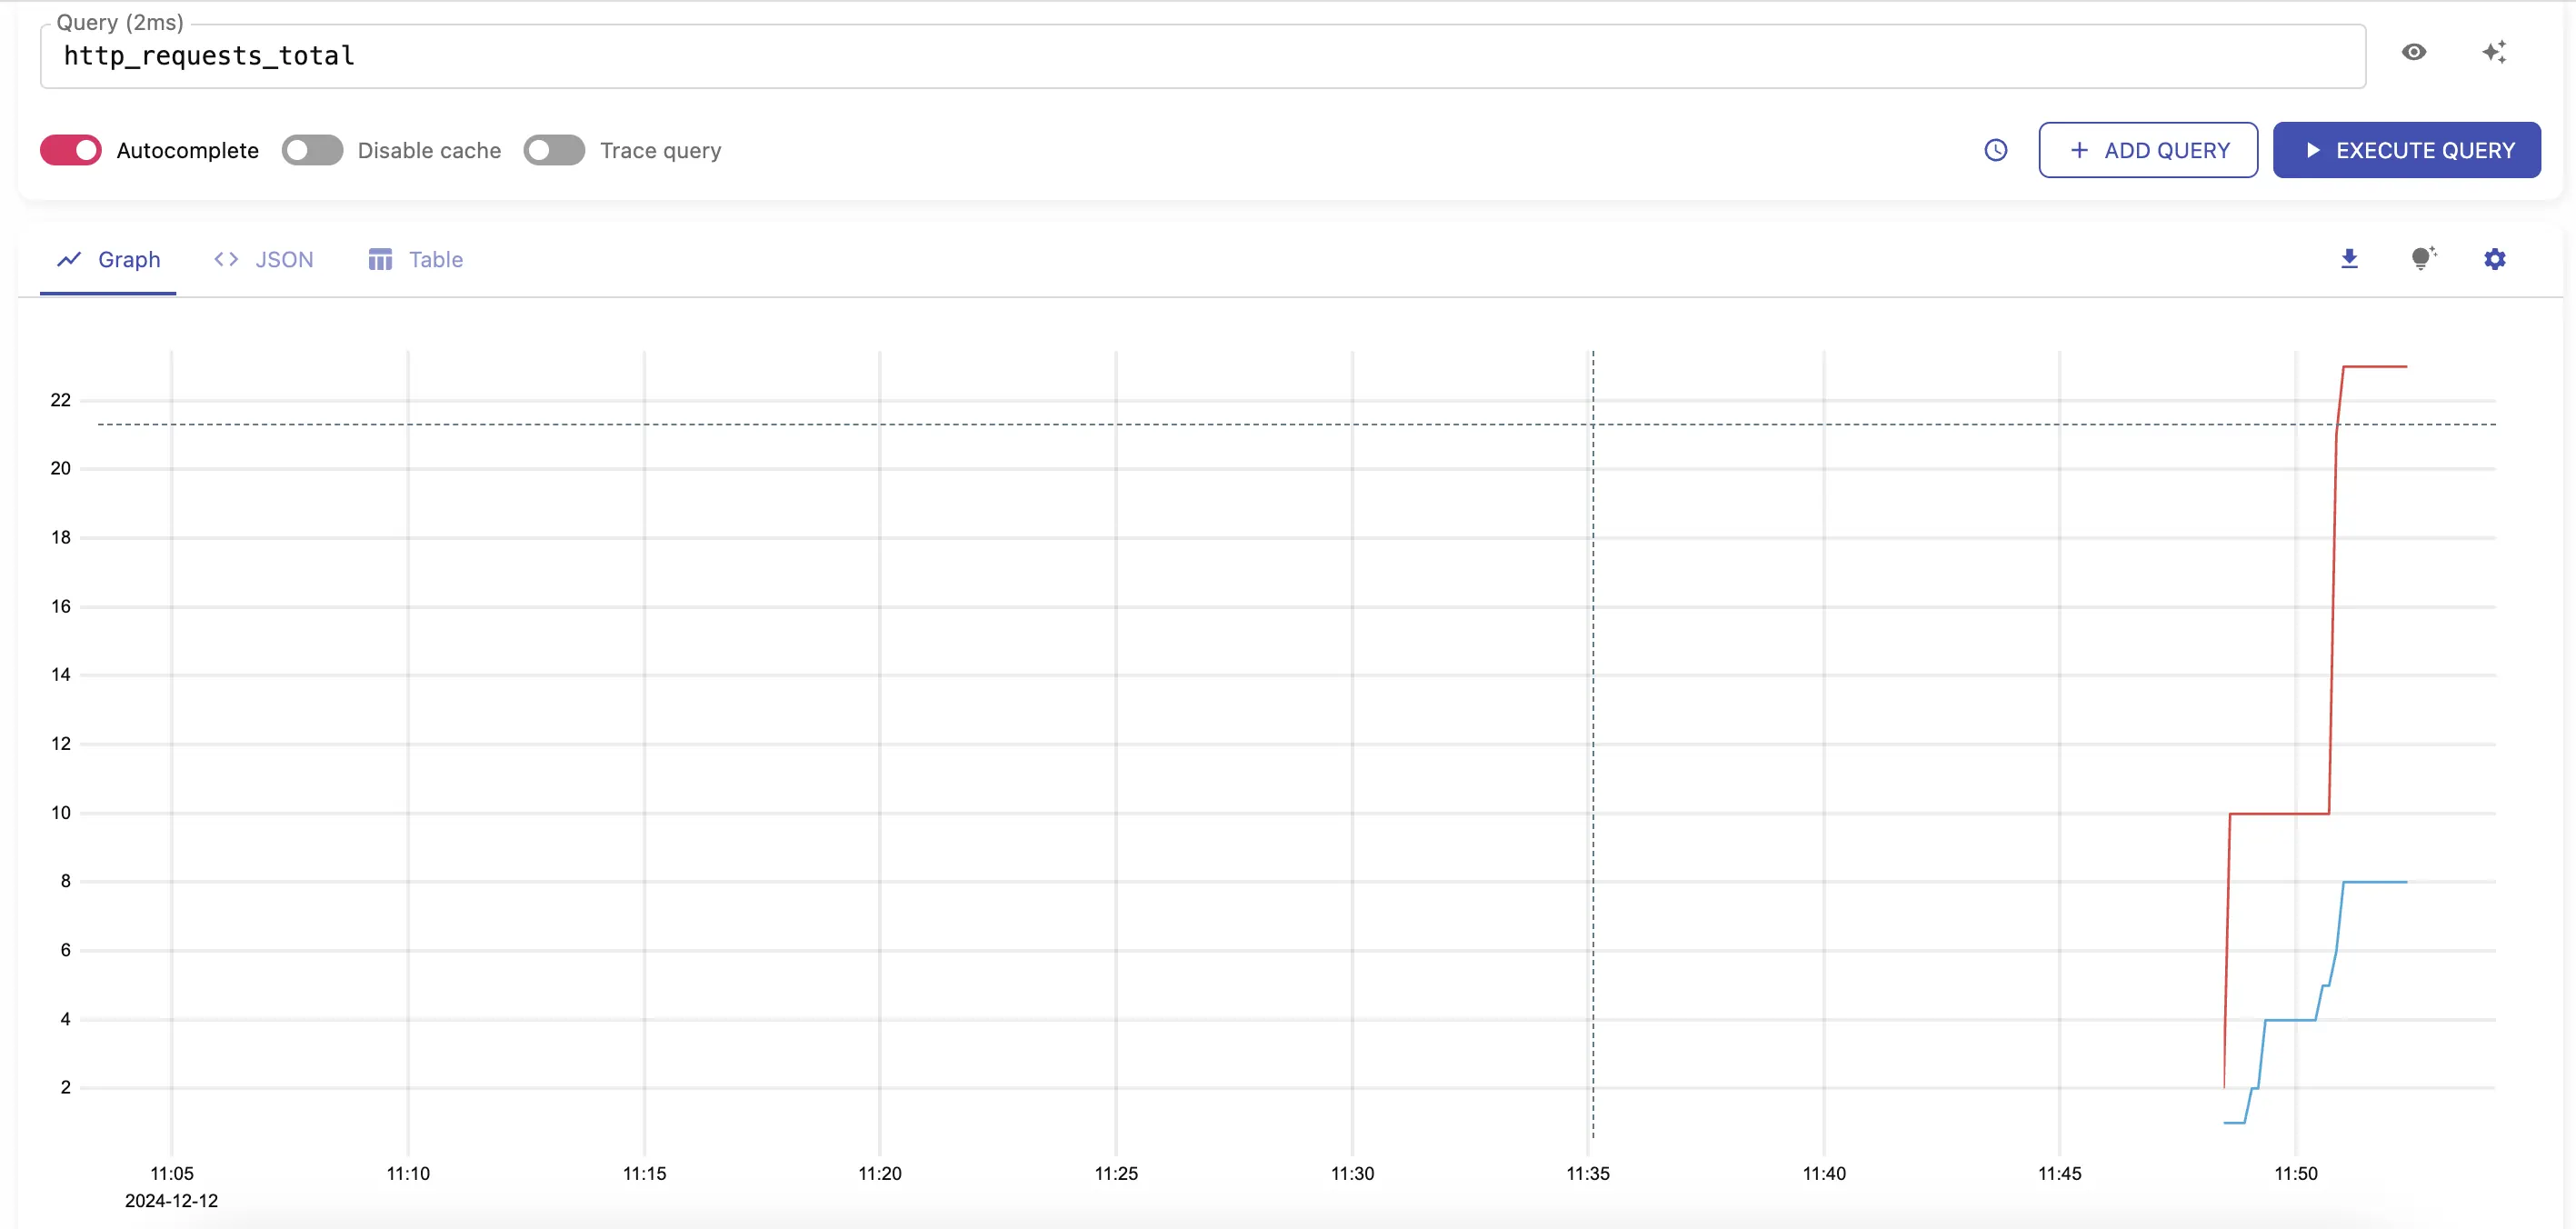
http_requests_totalCheck other available metrics by visiting the cardinality explorer page.
Logs should be available by visiting http://localhost:9428/select/vmui
using query service.name: unknown_service:otel.
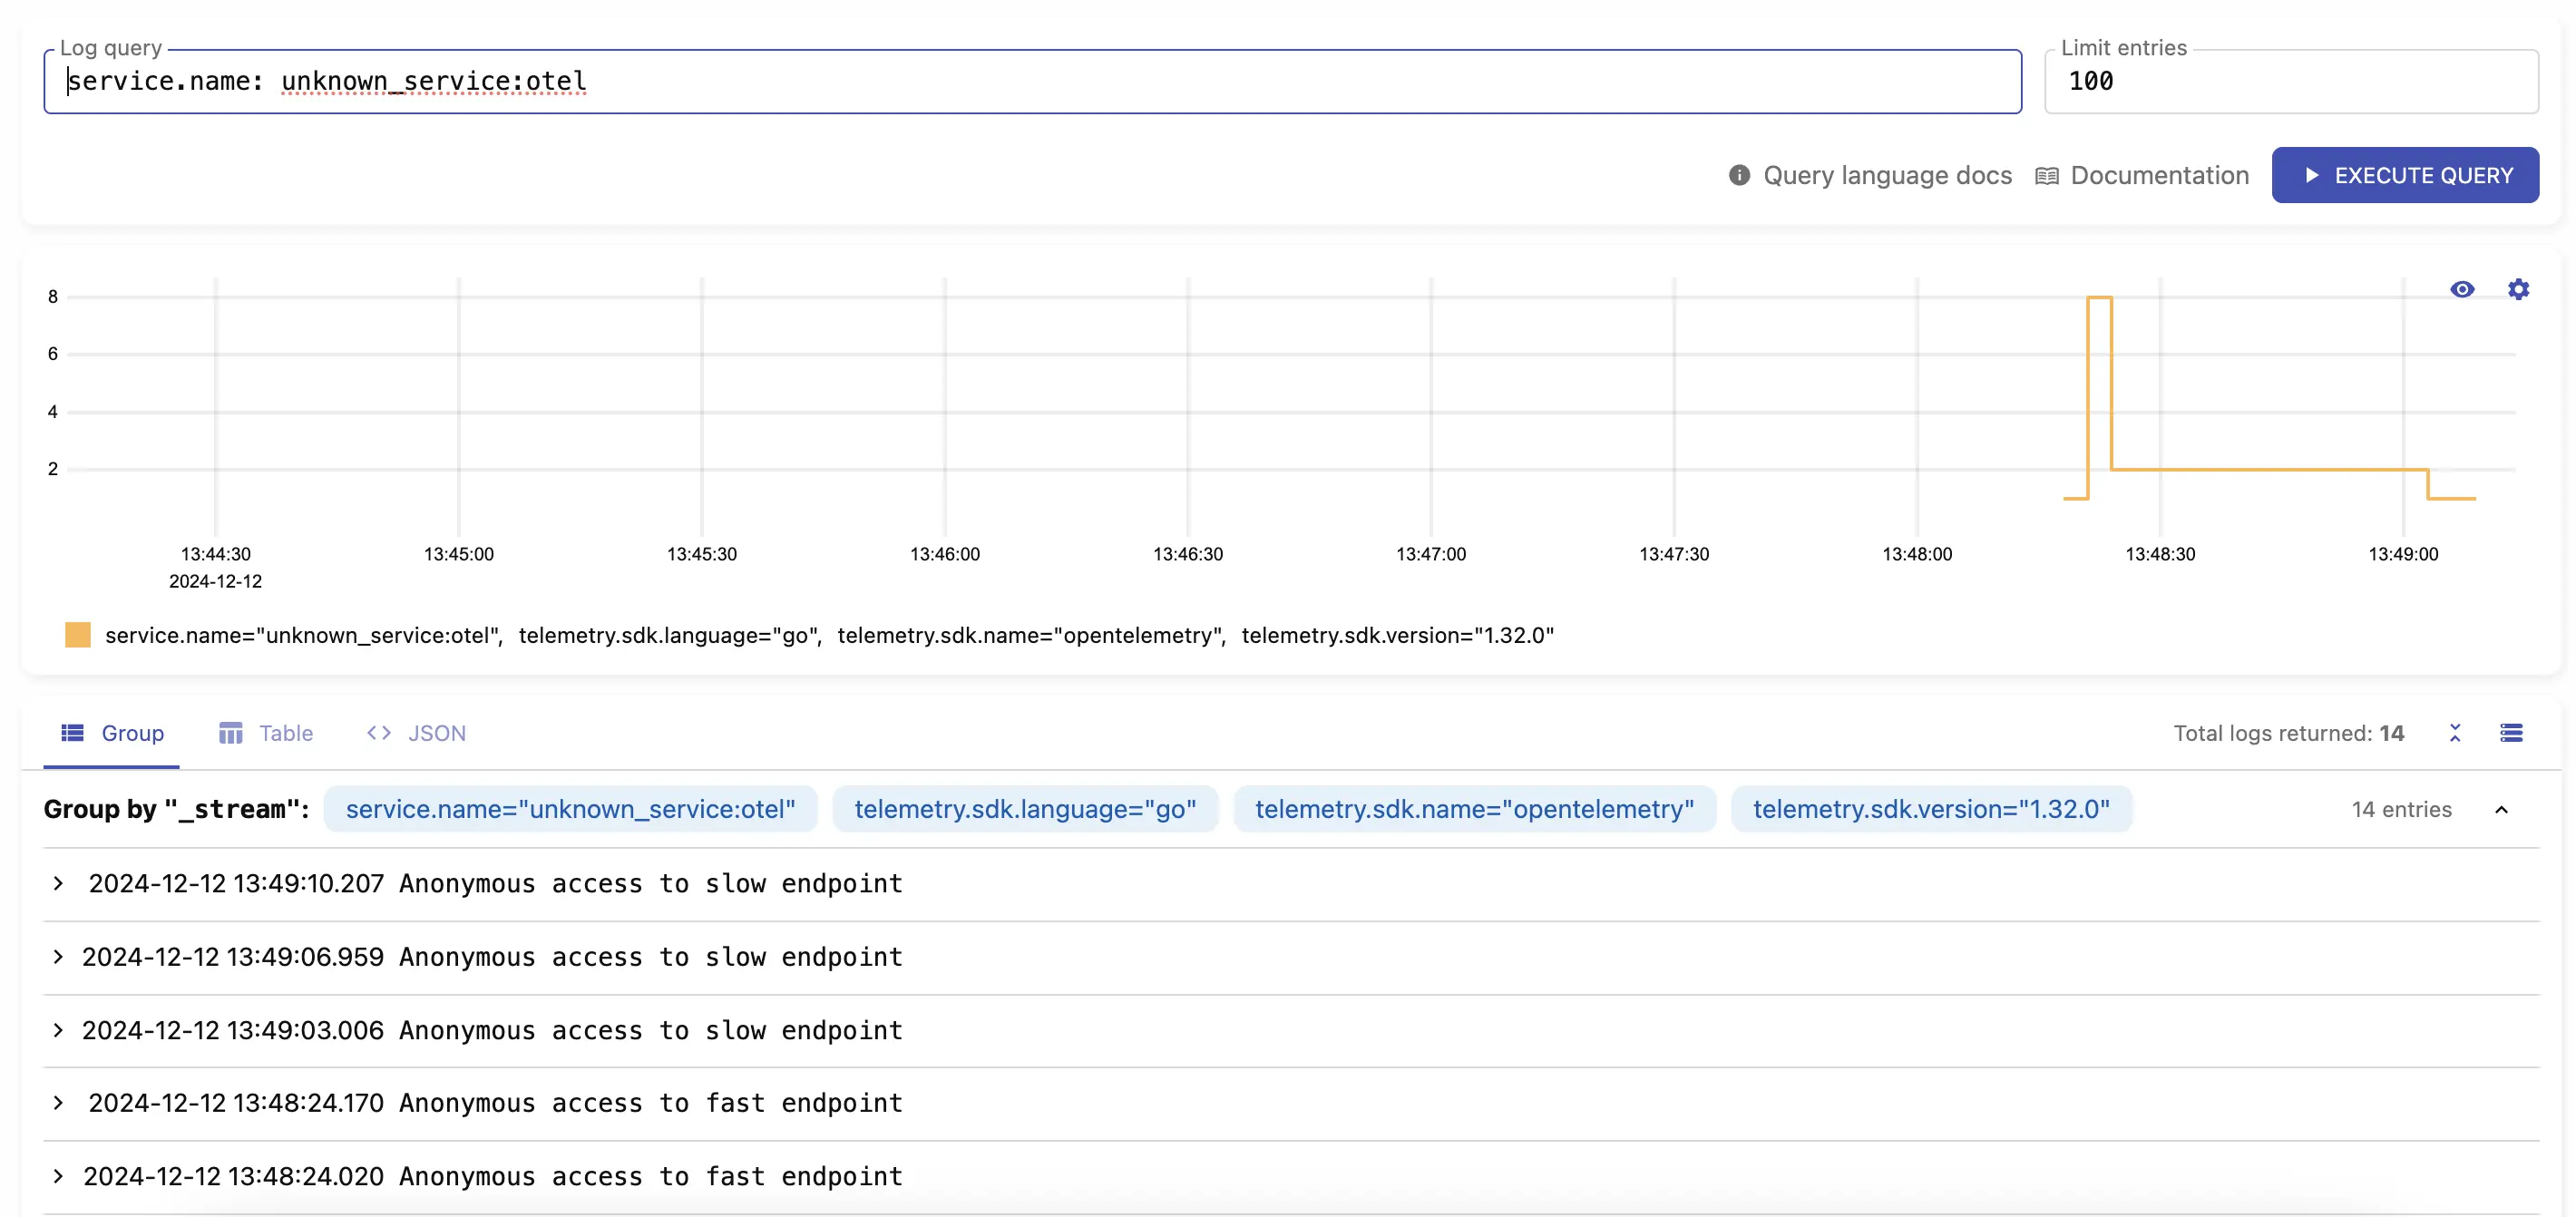
service.name: unknown_service:otelLimitations #
- VictoriaMetrics and VictoriaLogs do not support experimental JSON encoding format .