The VictoriaMetrics Kubernetes Operator simplifies deploying VictoriaMetrics Stack components on Kubernetes or OpenShift using declarative YAML custom resources .
By the end of this guide, you will be able to:
- Install and configure VictoriaMetrics cluster using the Operator.
- Scrape metrics from Kubernetes components.
- Store metrics in VictoriaMetrics time-series database.
- Visualize metrics in Grafana.
Preconditions
- A Kubernetes GKE cluster 1.33 or later
- Helm 4.1 or later
- kubectl 1.34 or later
We use a GKE cluster from GCP , but this guide can also be applied to any Kubernetes cluster, such as Amazon EKS or an on-premises cluster.
1. VictoriaMetrics Helm repository #
To start, add the VictoriaMetrics Helm repository with the following commands:
      helm repo add vm https://victoriametrics.github.io/helm-charts/
helm repo update
To verify that everything is set up correctly, you may run this command:
helm search repo vm/
You should see a list similar to this:
      NAME                                    CHART VERSION   APP VERSION     DESCRIPTION
vm/victoria-metrics-operator            0.58.1          v0.67.0         VictoriaMetrics Operator
vm/victoria-metrics-operator-crds       0.7.0           v0.67.0         VictoriaMetrics Operator CRDs
...(list continues)...
2. Install the VM Operator from the Helm chart #
helm install vmoperator vm/victoria-metrics-operator
The expected output is:
      NAME: vmoperator
LAST DEPLOYED: Fri Mar 21 12:01:52 2025
NAMESPACE: default
STATUS: deployed
REVISION: 1
TEST SUITE: None
NOTES:
victoria-metrics-operator has been installed. Check its status by running:
  kubectl --namespace default get pods -l "app.kubernetes.io/instance=vmoperator"

Get more information on https://github.com/VictoriaMetrics/helm-charts/tree/master/charts/victoria-metrics-operator.
See "Getting started guide for VM Operator" on https://docs.victoriametrics.com/guides/getting-started-with-vm-operator
Run the following command to check that VM Operator is up and running:
kubectl get pods -l "app.kubernetes.io/instance=vmoperator"
Wait until STATUS=Running and Ready=1/1, like this:
      NAME                                                    READY   STATUS    RESTARTS   AGE
vmoperator-victoria-metrics-operator-67cff44cd6-s47n6   1/1     Running   0          77s
3. Install VictoriaMetrics Cluster #
For this example, we use the default name for the cluster (name: example-vmcluster-persistent). Change the name to suit your needs.
First, create a YAML file to configure the deployment of VictoriaMetrics cluster version:
      cat << EOF > vmcluster-config.yml
apiVersion: operator.victoriametrics.com/v1beta1
kind: VMCluster
metadata:
  # define the name of the VM cluster
  name: example-vmcluster-persistent
spec:
  # define retention period (i.e., 12 months)
  retentionPeriod: "12"
  # define the number of pods for each of the services in the VM cluster
  vmstorage:
    replicaCount: 2
  vmselect:
    replicaCount: 2
  vminsert:
    replicaCount: 2
EOF
Let’s break down the main elements of the config file:
| Field | Purpose | Example |
|---|---|---|
metadata: name | Cluster name | example-vmcluster-persistent |
spec: retentionPeriod | Metrics retention | “12” (months) |
spec: vmstorage: replicaCount | vmstorage replicas | 2 |
spec: vmselect: replicaCount | vmselect replicas | 2 |
spec: vminsert: replicaCount | vminsert replicas | 2 |
A VictoriaMetrics cluster runs
three services
: vmstorage, vminsert, and vmselect. You can independently customize the number of replicas for each service.
Once you have defined the name, retention period, and number of replicas for your cluster, run the following command to deploy the VictoriaMetrics cluster in the default namespace:
kubectl apply -f vmcluster-config.yml
The command should output something like this:
vmcluster.operator.victoriametrics.com/example-vmcluster-persistent created
Pods may take some time to become ready. To check that the pods are started, run the following command:
kubectl get pods -l managed-by=vm-operator
The expected output is:
      NAME                                                     READY   STATUS    RESTARTS   AGE
vminsert-example-vmcluster-persistent-845849cb84-9vb6f   1/1     Running   0          5m15s
vminsert-example-vmcluster-persistent-845849cb84-r7mmk   1/1     Running   0          5m15s
vmselect-example-vmcluster-persistent-0                  1/1     Running   0          5m21s
vmselect-example-vmcluster-persistent-1                  1/1     Running   0          5m21s
vmstorage-example-vmcluster-persistent-0                 1/1     Running   0          5m25s
vmstorage-example-vmcluster-persistent-1                 1/1     Running   0          5m25s
The VictoriaMetrics Operator adds an extra command to get information about the state of the cluster:
kubectl get vmclusters
Output is typically:
      NAME                           INSERT COUNT   STORAGE COUNT   SELECT COUNT   AGE     STATUS
example-vmcluster-persistent   2              2               2              5m53s   operational
Install vmagent #
In order to send metrics to the VictoriaMetrics database, we need a
vmagent
service. This service scrapes metrics, applies relabeling, and forwards them to the vminsert service in the cluster.
First, we need to determine the URL for the vminsert service. Run the following command to obtain the service name of the service:
kubectl get svc -l app.kubernetes.io/name=vminsert
The expected output is:
      NAME                                    TYPE        CLUSTER-IP     EXTERNAL-IP   PORT(S)    AGE
vminsert-example-vmcluster-persistent   ClusterIP   10.43.42.217   <none>        8480/TCP   2d
The write URL for the vminsert service takes the form of http://<service-name>.<namespace>.svc.cluster.local:<port-number>. In our example, the URL is:
http://vminsert-example-vmcluster-persistent.default.svc.cluster.local:8480
Create a YAML file to configure vmagent. Ensure that spec: remoteWrite: url matches the vminsert service URL:
      cat <<EOF > vmagent-config.yml
apiVersion: operator.victoriametrics.com/v1beta1
kind: VMAgent
metadata:
  # You may change the name of the vmagent service here
  name: example-vmagent
spec:
  serviceScrapeNamespaceSelector: {}
  podScrapeNamespaceSelector: {}
  podScrapeSelector: {}
  serviceScrapeSelector: {}
  nodeScrapeSelector: {}
  nodeScrapeNamespaceSelector: {}
  staticScrapeSelector: {}
  staticScrapeNamespaceSelector: {}
  replicaCount: 1
  remoteWrite:
    # url must be "http://<service-name>.<namespace>.svc.cluster.local:<port-number>/insert/0/prometheus/api/v1/write"
    - url: "http://vminsert-example-vmcluster-persistent.default.svc.cluster.local:8480/insert/0/prometheus/api/v1/write"
EOF
Let’s break down the main settings in the config:
metadata: namedefines the name of the vmagent service (e.g.,example-vmagent)spec: remoteWrite: urldefines the fully qualified URL for thevminsertservice. Ensure the URL is correct and ends with/insert/0/prometheus/api/v1/write.
Install vmagent with:
kubectl apply -f vmagent-config.yml
You should get this message:
vmagent.operator.victoriametrics.com/example-vmagent created
Verify that vmagent is operational:
kubectl get vmagent
The expected output is:
      NAME              SHARDS COUNT   REPLICA COUNT   STATUS        AGE
example-vmagent                  1               operational   21h
Run the following command to make the service port accessible from the local machine:
kubectl port-forward svc/vmagent-example-vmagent 8429:8429
The terminal should show the following. Keep the session open to access the forwarded connection:
      Forwarding from 127.0.0.1:8429 -> 8429
Forwarding from [::1]:8429 -> 8429
To check that vmagent is collecting metrics by browsing http://127.0.0.1:8429/targets. You will see something like this:
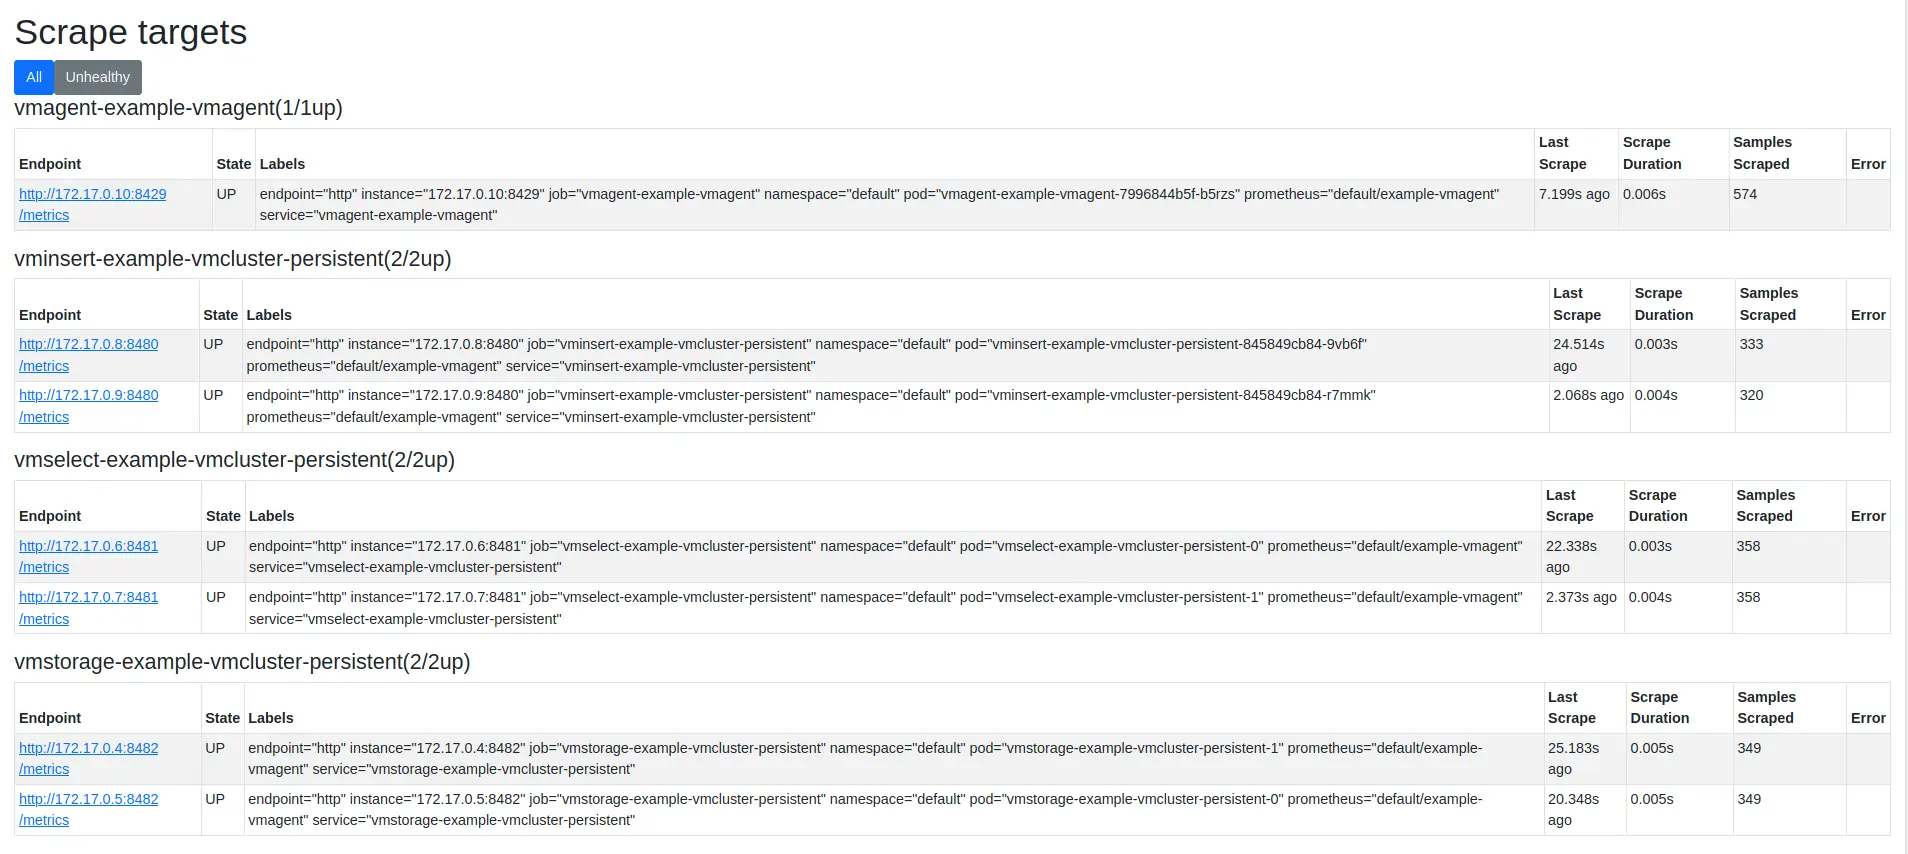
Notice that only the VictoriaMetrics services are being targeted. By default, vmagent does not scrape Kubernetes cluster metrics. The next section explains how to enable scraping in Kubernetes.
Enable Kubernetes metrics scraping #
This step is optional. Skip to the next section if you do not want to collect metrics from the Kubernetes control plane and node components.
To enable metric collection from the Kubernetes system, we need to update vmagent configuration and set up various
Scrape CRDs
.
Update the vmagent-config.yml file as follows. Ensure you define spec: remoteWrite: url: value is still correct as in the previous step.
      cat <<EOF >vmagent-config.yml
apiVersion: operator.victoriametrics.com/v1beta1
kind: VMAgent
metadata:
  name: example-vmagent
  namespace: default
spec:
  replicaCount: 1
  # Enable CRD-based scraping
  selectAllByDefault: true
  remoteWrite:
      # url takes the form of "http://<service-name>.<namespace>.svc.cluster.local:<port-number>/insert/0/prometheus/api/v1/write"
    - url: "http://vminsert-example-vmcluster-persistent.default.svc.cluster.local:8480/insert/0/prometheus/api/v1/write"
EOF
Update vmagent:
kubectl apply -f vmagent-config.yml
Download the
vmscrape-config.yml-example
file and rename it to vmscrape-config.yml. This config sets up scrape CRDs for key Kubernetes components, including nodes, pods, APIs, and services.
Apply the scrape CRDs:
kubectl apply -f vmscrape-config.yml
The expected output is:
      vmnodescrape.operator.victoriametrics.com/kubelet-cadvisor created
vmnodescrape.operator.victoriametrics.com/kubelet-metrics created
vmscrapeconfig.operator.victoriametrics.com/kubernetes-apiservers created
vmscrapeconfig.operator.victoriametrics.com/kubernetes-pods created
vmscrapeconfig.operator.victoriametrics.com/kubernetes-service-endpoints created
Go back to the vmagent target page by browsing http://127.0.0.1:8429/targets. This time, you should find targets such as nodeScrape/default/kubelet-cadvisor and nodeScrape/default/kubelet-metrics with an up status:

4. Verifying VictoriaMetrics cluster #
The next step is to install Grafana to visualize collected metrics.
Add the Grafana Helm repository with:
      helm repo add grafana-community https://grafana-community.github.io/helm-charts
helm repo update
Next, we need to determine the URL for the vmselect service. To get the service name, run the following command:
kubectl get svc -l app.kubernetes.io/name=vmselect
You should get a message like this:
      NAME                                     TYPE        CLUSTER-IP       EXTERNAL-IP   PORT(S)    AGE
vmselect-example-vmcluster-persistent    ClusterIP   None             <none>        8481/TCP   7m
We’ll need to supply a datasource URL for Grafana, which in VictoriaMetrics cluster takes the following form:
http://<service-name>.<namespace>.svc.cluster.local:<port-number>
Thus, in our example, the URL is:
http://vmselect-example-vmcluster-persistent.default.svc.cluster.local:8481/select/0/prometheus/
Create a values file for the Grafana Helm chart:
      cat << EOF > grafana-values.yml
  datasources:
    datasources.yaml:
      apiVersion: 1
      datasources:
        - name: victoriametrics
          type: prometheus
          orgId: 1
          # url takes the form of 'http://<vmselect-service-name>.<namespace>.svc.cluster.local:<port-number>/select/0/prometheus'
          url: http://vmselect-example-vmcluster-persistent.default.svc.cluster.local:8481/select/0/prometheus/
          access: proxy
          isDefault: true
          updateIntervalSeconds: 10
          editable: true

  dashboardProviders:
   dashboardproviders.yaml:
     apiVersion: 1
     providers:
     - name: 'default'
       orgId: 1
       folder: ''
       type: file
       disableDeletion: true
       editable: true
       options:
         path: /var/lib/grafana/dashboards/default

  dashboards:
    default:
      victoriametrics:
        gnetId: 11176
        datasource: victoriametrics
      vmagent:
        gnetId: 12683
        datasource: victoriametrics
      kubernetes:
        gnetId: 14205
        datasource: victoriametrics
EOF
Let’s break down the main parts of the config file:
datasources: datasources.yaml: datasources: urldefines the URL for thevmselectservice. This endpoint is the datasource Grafana uses to query the metrics database.dashboards: default:loads three starter dashboards to monitor the Kubernetes cluster, the VictoriaMetrics services, and thevmagentservice.
Install Grafana into the Kubernetes cluster with the name my-grafana in the default namespace with the following command:
helm install my-grafana grafana-community/grafana -f grafana-values.yml
The output should look similar to this:
      NAME: my-grafana
LAST DEPLOYED: Fri Feb  6 19:00:15 2026
NAMESPACE: default
STATUS: deployed
REVISION: 1
DESCRIPTION: Install complete
NOTES:
1. Get your 'admin' user password by running:

   kubectl get secret --namespace default my-grafana -o jsonpath="{.data.admin-password}" | base64 --decode ; echo


2. The Grafana server can be accessed via port 80 on the following DNS name from within your cluster:

   my-grafana.default.svc.cluster.local

   Get the Grafana URL to visit by running these commands in the same shell:
     export POD_NAME=$(kubectl get pods --namespace default -l "app.kubernetes.io/name=grafana,app.kubernetes.io/instance=my-grafana" -o jsonpath="{.items[0].metadata.name}")
     kubectl --namespace default port-forward $POD_NAME 3000

3. Login with the password from step 1 and the username: admin
#################################################################################
######   WARNING: Persistence is disabled!!! You will lose your data when   #####
######            the Grafana pod is terminated.                            #####
#################################################################################
Use the first command in the output to obtain the password for the admin user:
kubectl get secret --namespace default my-grafana -o jsonpath="{.data.admin-password}" | base64 --decode ; echo
The second part of the output shows how to port-forward the Grafana service to access it locally on 127.0.0.1:3000:
      export pod_name=$(kubectl get pods --namespace default -l "app.kubernetes.io/name=grafana,app.kubernetes.io/instance=my-grafana" -o jsonpath="{.items[0].metadata.name}")

kubectl --namespace default port-forward $pod_name 3000
5. Check the result you obtained in your browser #
To check that VictoriaMetrics
is collecting metrics from the Kubernetes cluster, open your browser to http://127.0.0.1:3000/dashboards and choose the VictoriaMetrics - cluster dashboard.
Use admin for login and the password obtained with kubectl get secret ....
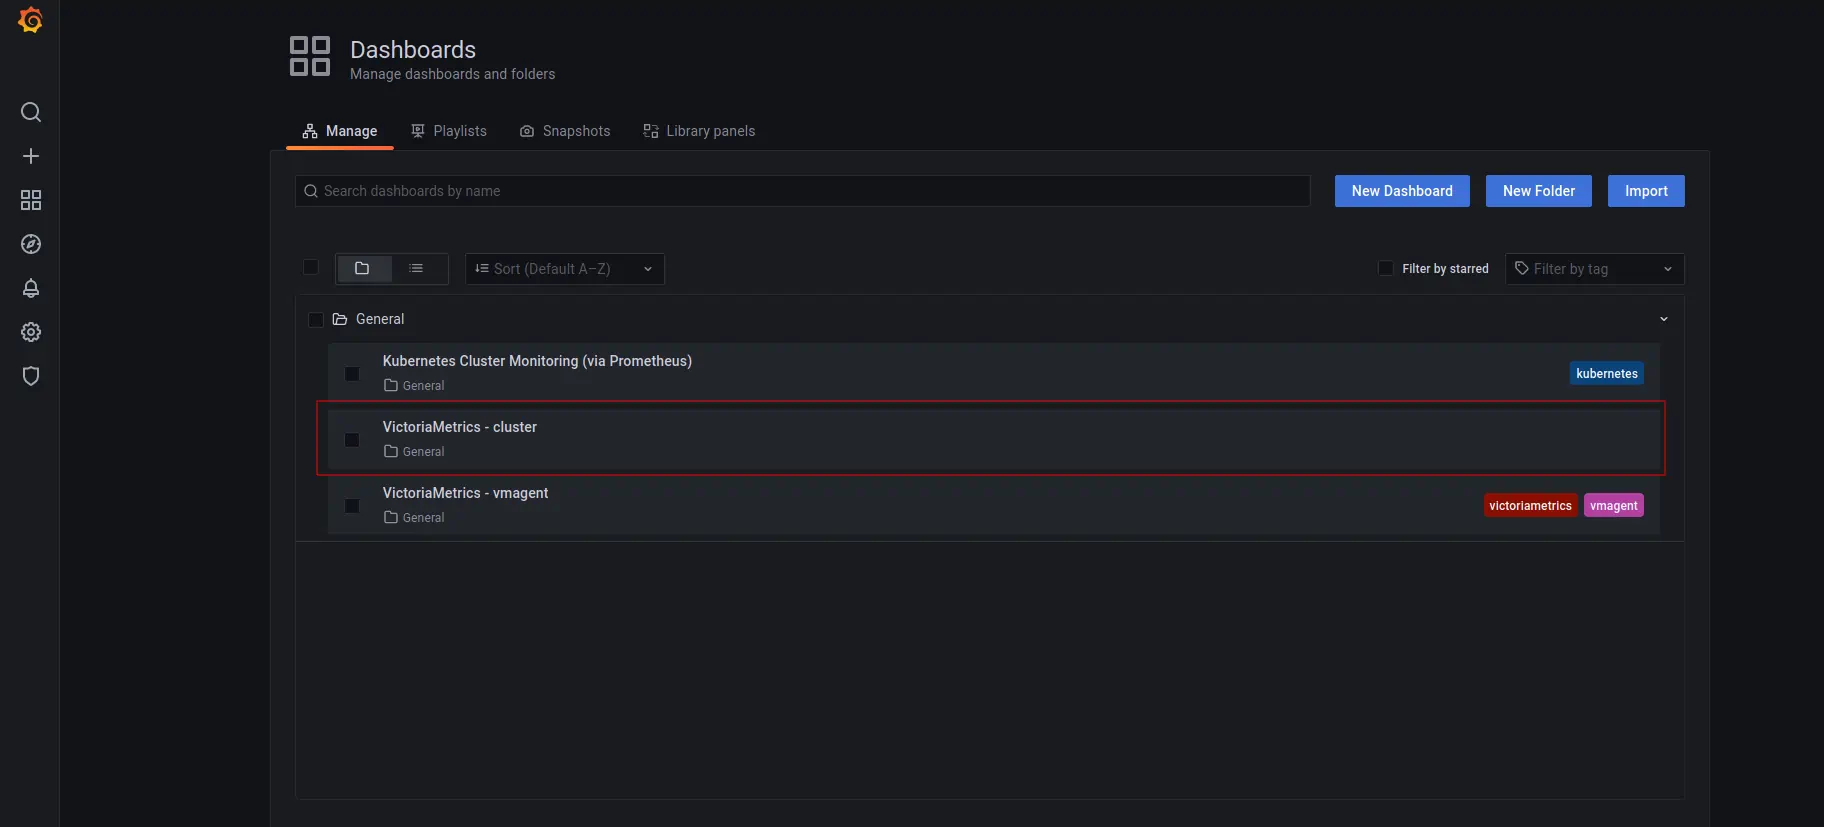
The “VictoriaMetrics - cluster” dashboard shows activity of the VictoriaMetrics services.

There is a separate dashboard for the vmagent service’s activity. This shows the ingestion rate and resource utilization.

If you added the scrape configs , the Kubernetes dashboard will be populated with metrics; otherwise, it will be empty.

6. Summary #
- We set up a Kubernetes Operator for VictoriaMetrics using CRDs.
- We collected metrics from all running services and stored them in the VictoriaMetrics database.
- We installed Grafana to visualize metrics
Consider reading these resources to complete your setup:
- VictoriaMetrics Operator Quickstart
- See VictoriaMetrics K8s Stack for an all-in-one solution for Kubernetes monitoring
- Grafana