Using Grafana with vmauth is an effective way to provide multi-tenant access to your metrics, logs, and traces. vmauth provides a way to authenticate users using JWT tokens Available from v1.138.0 issued by an external identity provider. Those tokens can include information about the user and their tenant, which vmauth can use to restrict access so users only see metrics in their own tenant.
This guide walks through configuring Grafana with OIDC to query metrics from both single-node and cluster deployments of VictoriaMetrics.
Prerequisites #
- Docker and docker compose must be installed.
- jq tool
- Add
grafanaandkeycloakhosts to the/etc/hostsfile, pointing to127.0.0.1.
      # /etc/hosts

# Setup vmauth - Multi-Tenant Access with Grafana & OIDC
# https://docs.victoriametrics.com/guides/grafana-vmauth-openid-configuration/#prerequisites
127.0.0.1 keycloak grafana
Identity provider #
The identity provider must be able to issue JWT tokens with the following vm_access claim:
      {
  "exp": 1772019469,
  "vm_access": {
    "metrics_account_id": 0,
    "metrics_project_id": 0,
    "metrics_extra_labels": [
      "team=dev"
    ],
    "metrics_extra_filters": [
     "{env=~\"aws|gcp\",cluster!=\"production\"}"
    ]
  }
}
Note: all properties inside vm_access are optional and could be omitted. vm_access: {} is a valid claim value.
Some identity providers support only string-based claim values, and vmauth supports these as well:
      {
  "exp": 1772019469,
  "vm_access": "{\"metrics_account_id\": 0, \"metrics_project_id\": 0}"
}
See details about all supported options in the vmauth - JWT token auth proxy .
Setup Keycloak #
Keycloak is an open-source identity provider that can issue JWT tokens.
Add the following section to your compose.yaml file to configure Keycloak:
      # compose.yaml
services:
  keycloak:
    image: quay.io/keycloak/keycloak:26.3
    command:
      - start-dev
      - --http-port=3001
    ports:
      - 127.0.0.1:3001:3001
    environment:
      KC_HOSTNAME_BACKCHANNEL_DYNAMIC: "true"
      KC_HOSTNAME: http://keycloak:3001/
      KC_BOOTSTRAP_ADMIN_USERNAME: admin
      KC_BOOTSTRAP_ADMIN_PASSWORD: change_me
    volumes:
      - keycloakdata:/opt/keycloak/data

volumes:
  keycloakdata: {}
Start the services:
docker compose up
Once Keycloak is available, follow the steps below to configure the OIDC client and users for Grafana:
Create client #
Open http://keycloak:3001 .
Log in with credentials.
- Username:
admin - Password:
change_me
- Username:
Go to
Clients->Create client.- Use
OpenID ConnectasClient Type. - Specify
grafanaasClient ID. - Click
Next.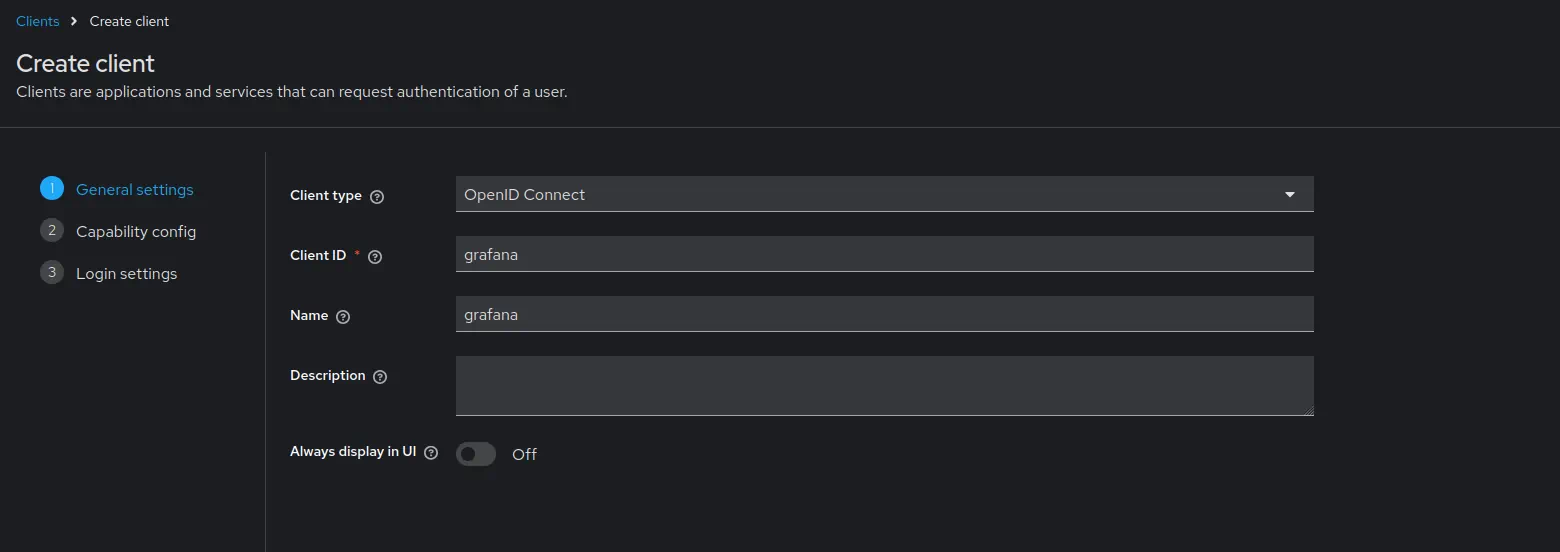
- Use
Enable
Client authentication- Enable
Authorization. - Enable
Direct access grants(this is only required for testing the token but it can be disabled in production)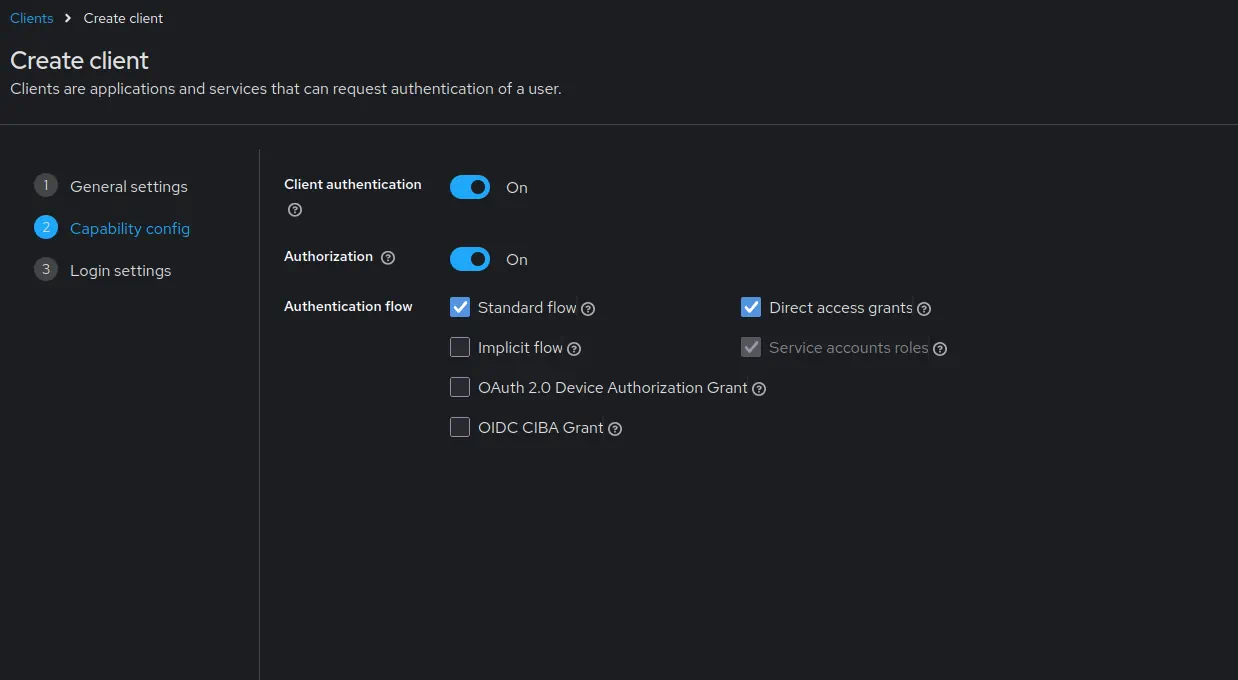
- Click
Next.
- Enable
Add the Grafana URL as
Root URL. For example,http://grafana:3000.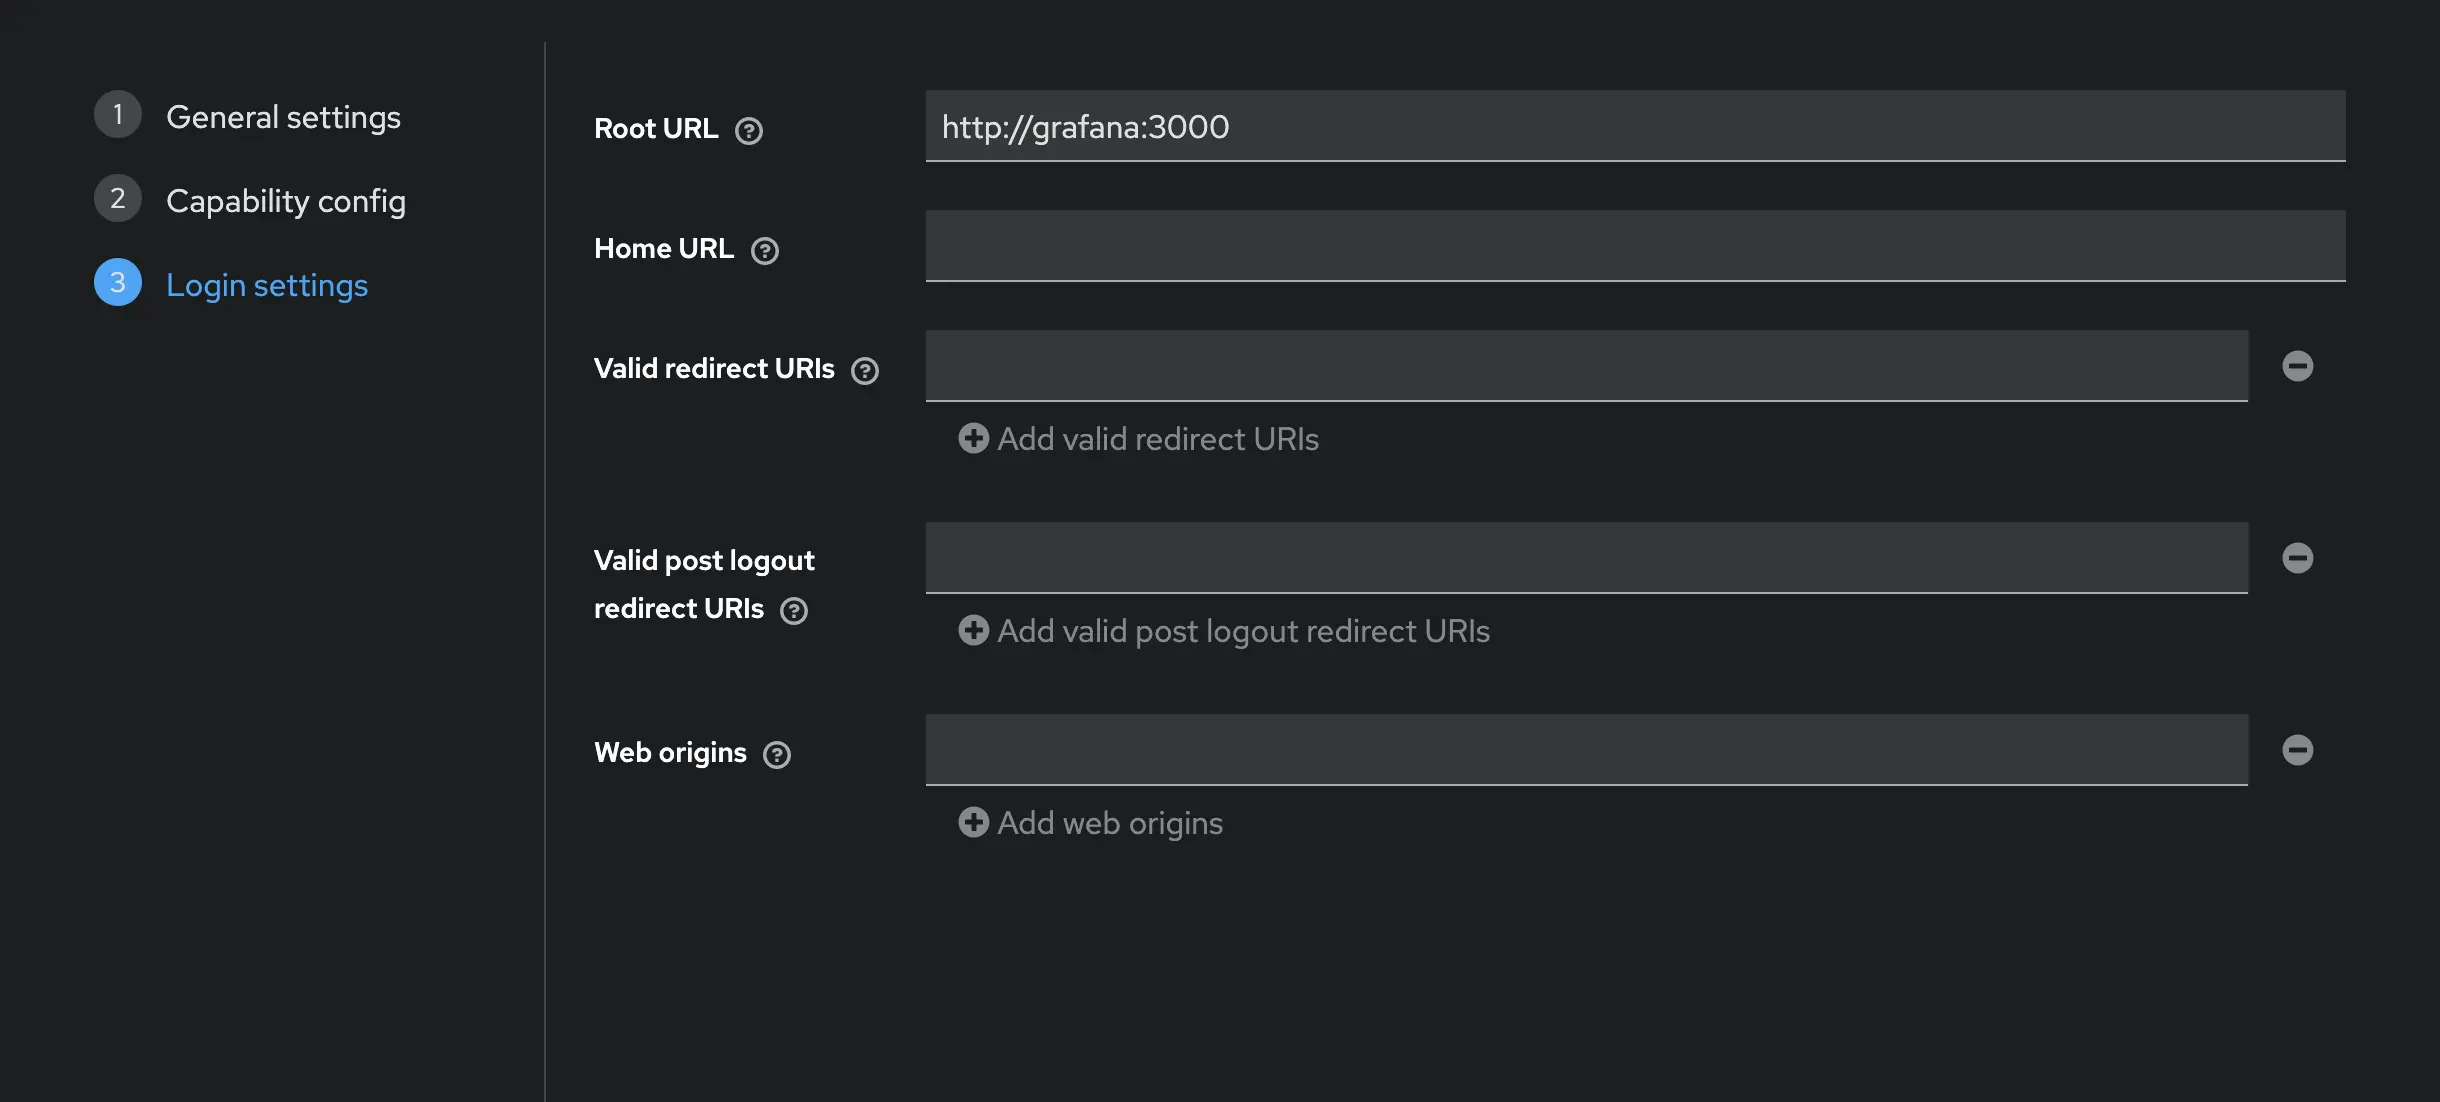
- Click
Save.
- Click
Go to
Clients->grafana->Client scopes.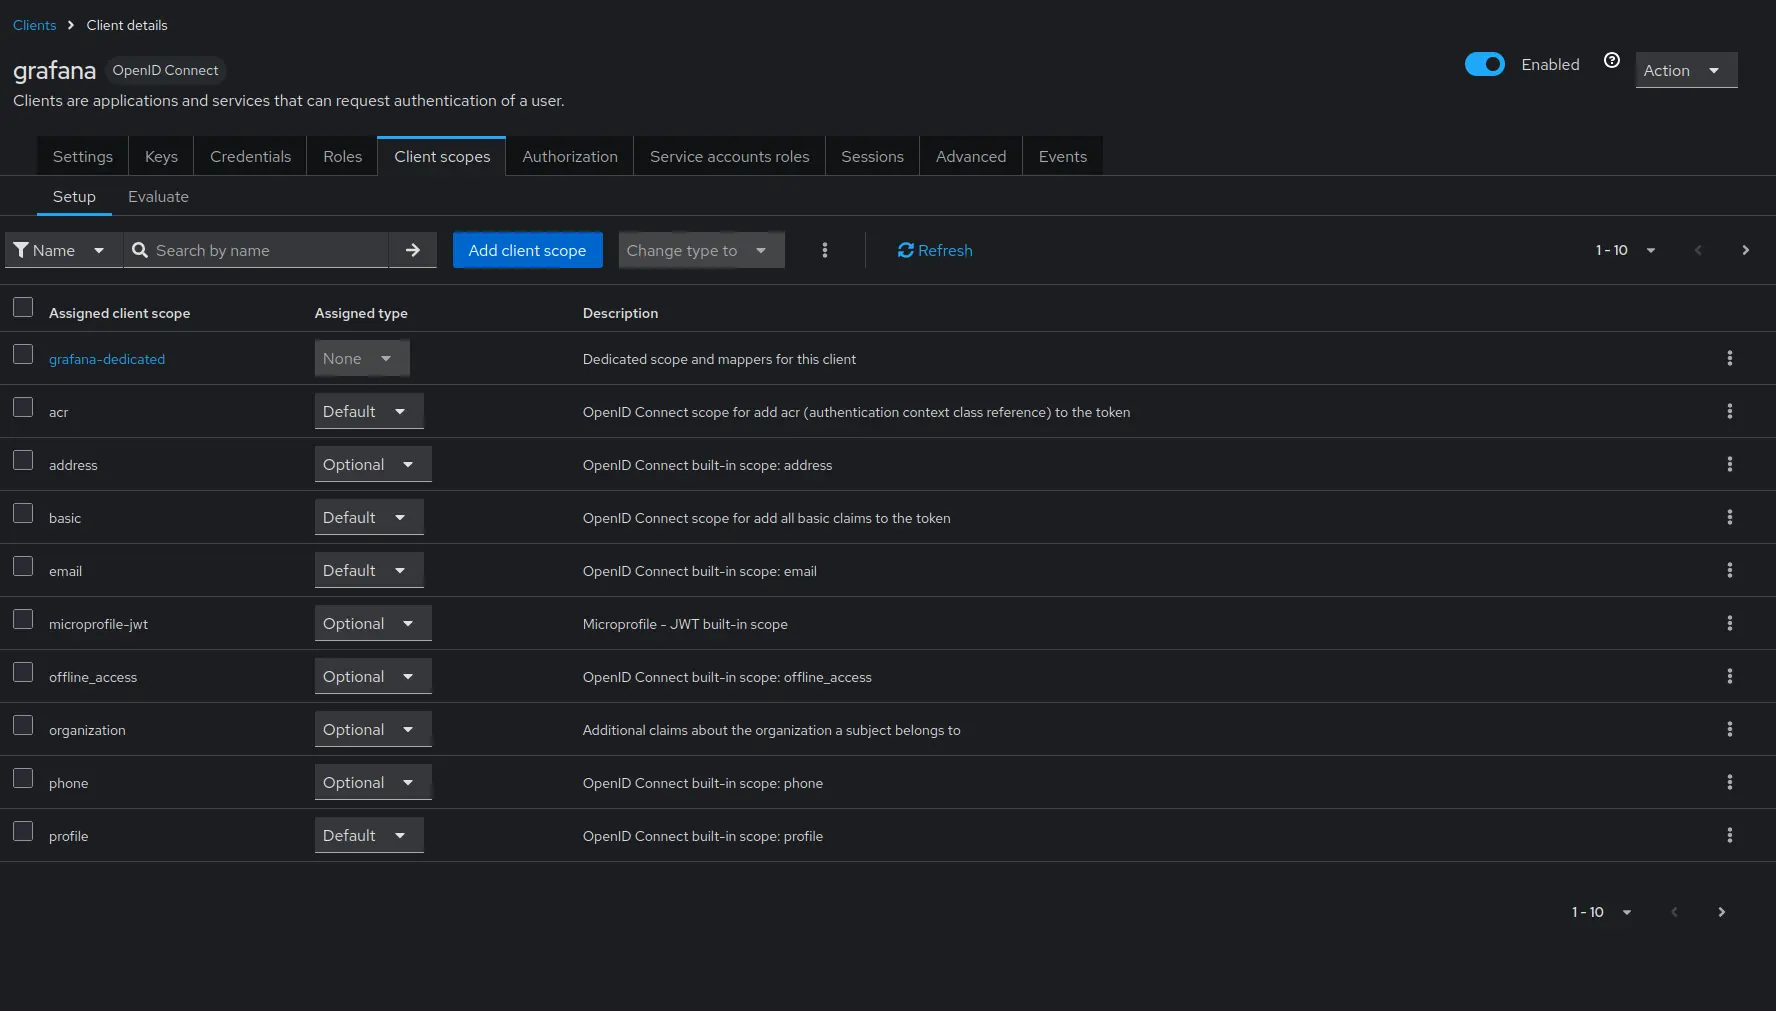
- Click on
grafana-dedicated->Configure a new mapper->User attribute.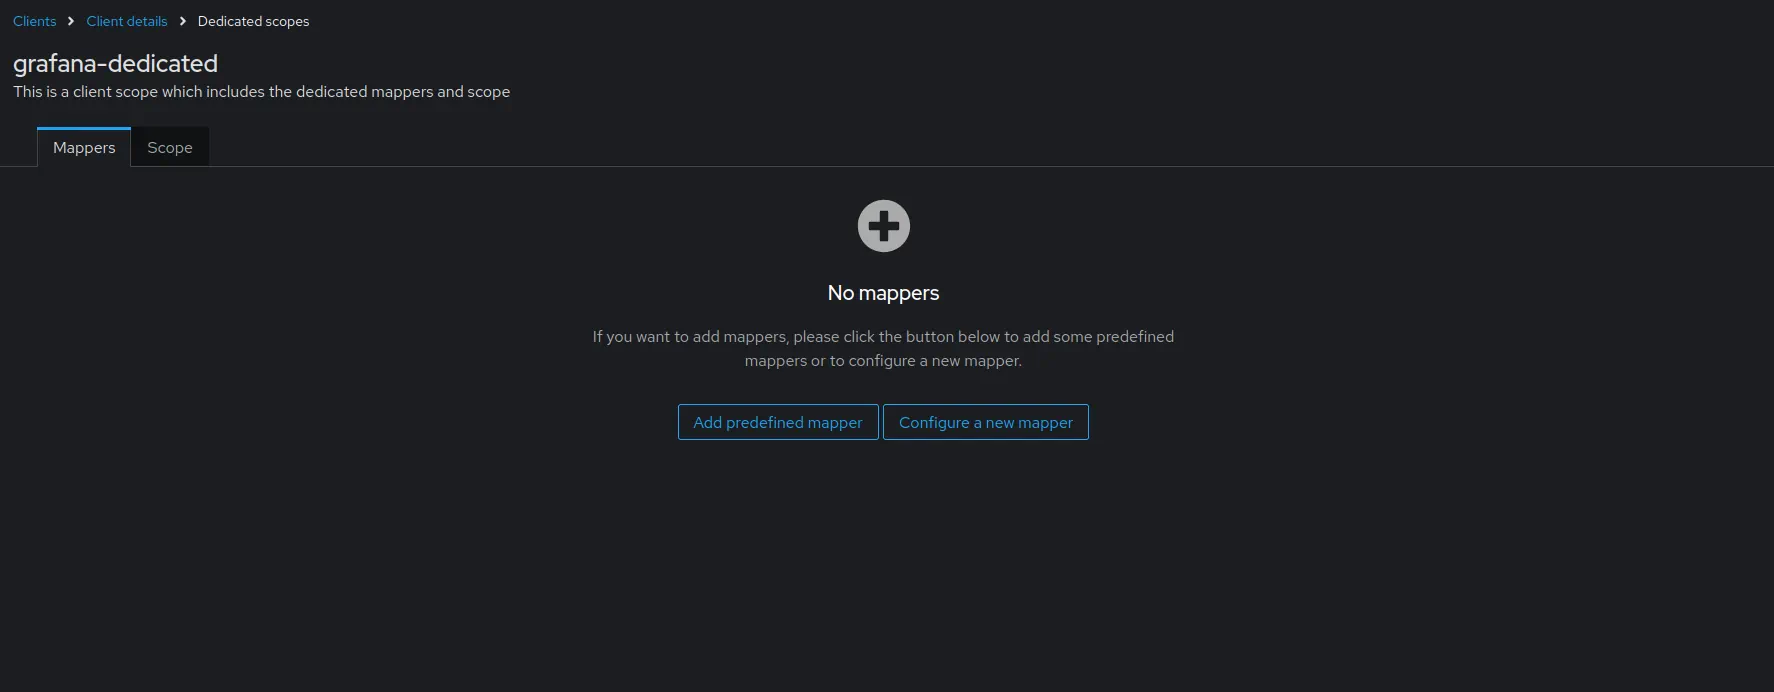
- Click on
Configure the mapper as follows:
- Set
Nametovm_access. - Set
User Attributetovm_access. - Set
Token Claim Nametovm_access. - Set
Claim JSON TypetoJSON. - Enable
Add to ID tokenandAdd to access token.
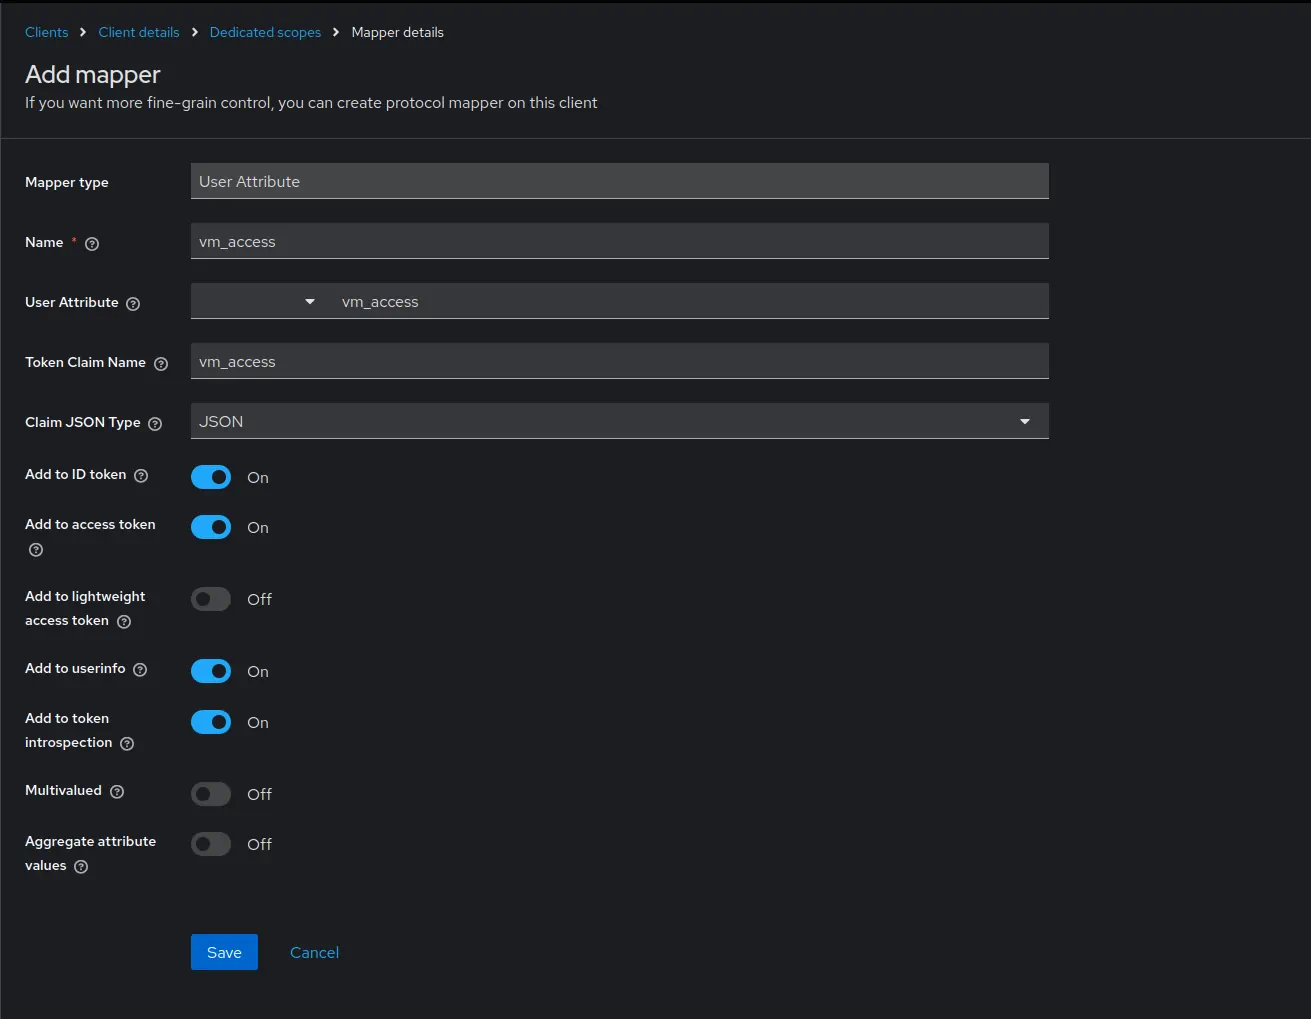
- Click
Save.
- Set
Create users #
Go to
Realm settings->User profile.- Click
Create attribute. - Specify
vm_accessasAttribute [Name].
- Click
Create.
- Click
Go to
Users->Add user.- Mark email as verified.
- Specify
test-devasUsername. - Specify
test-dev@example.comasEmail. - Specify
vm_accessas{"metrics_account_id": 1, "metrics_project_id": 2, "metrics_extra_labels": ["team=dev"]}. - Press
Create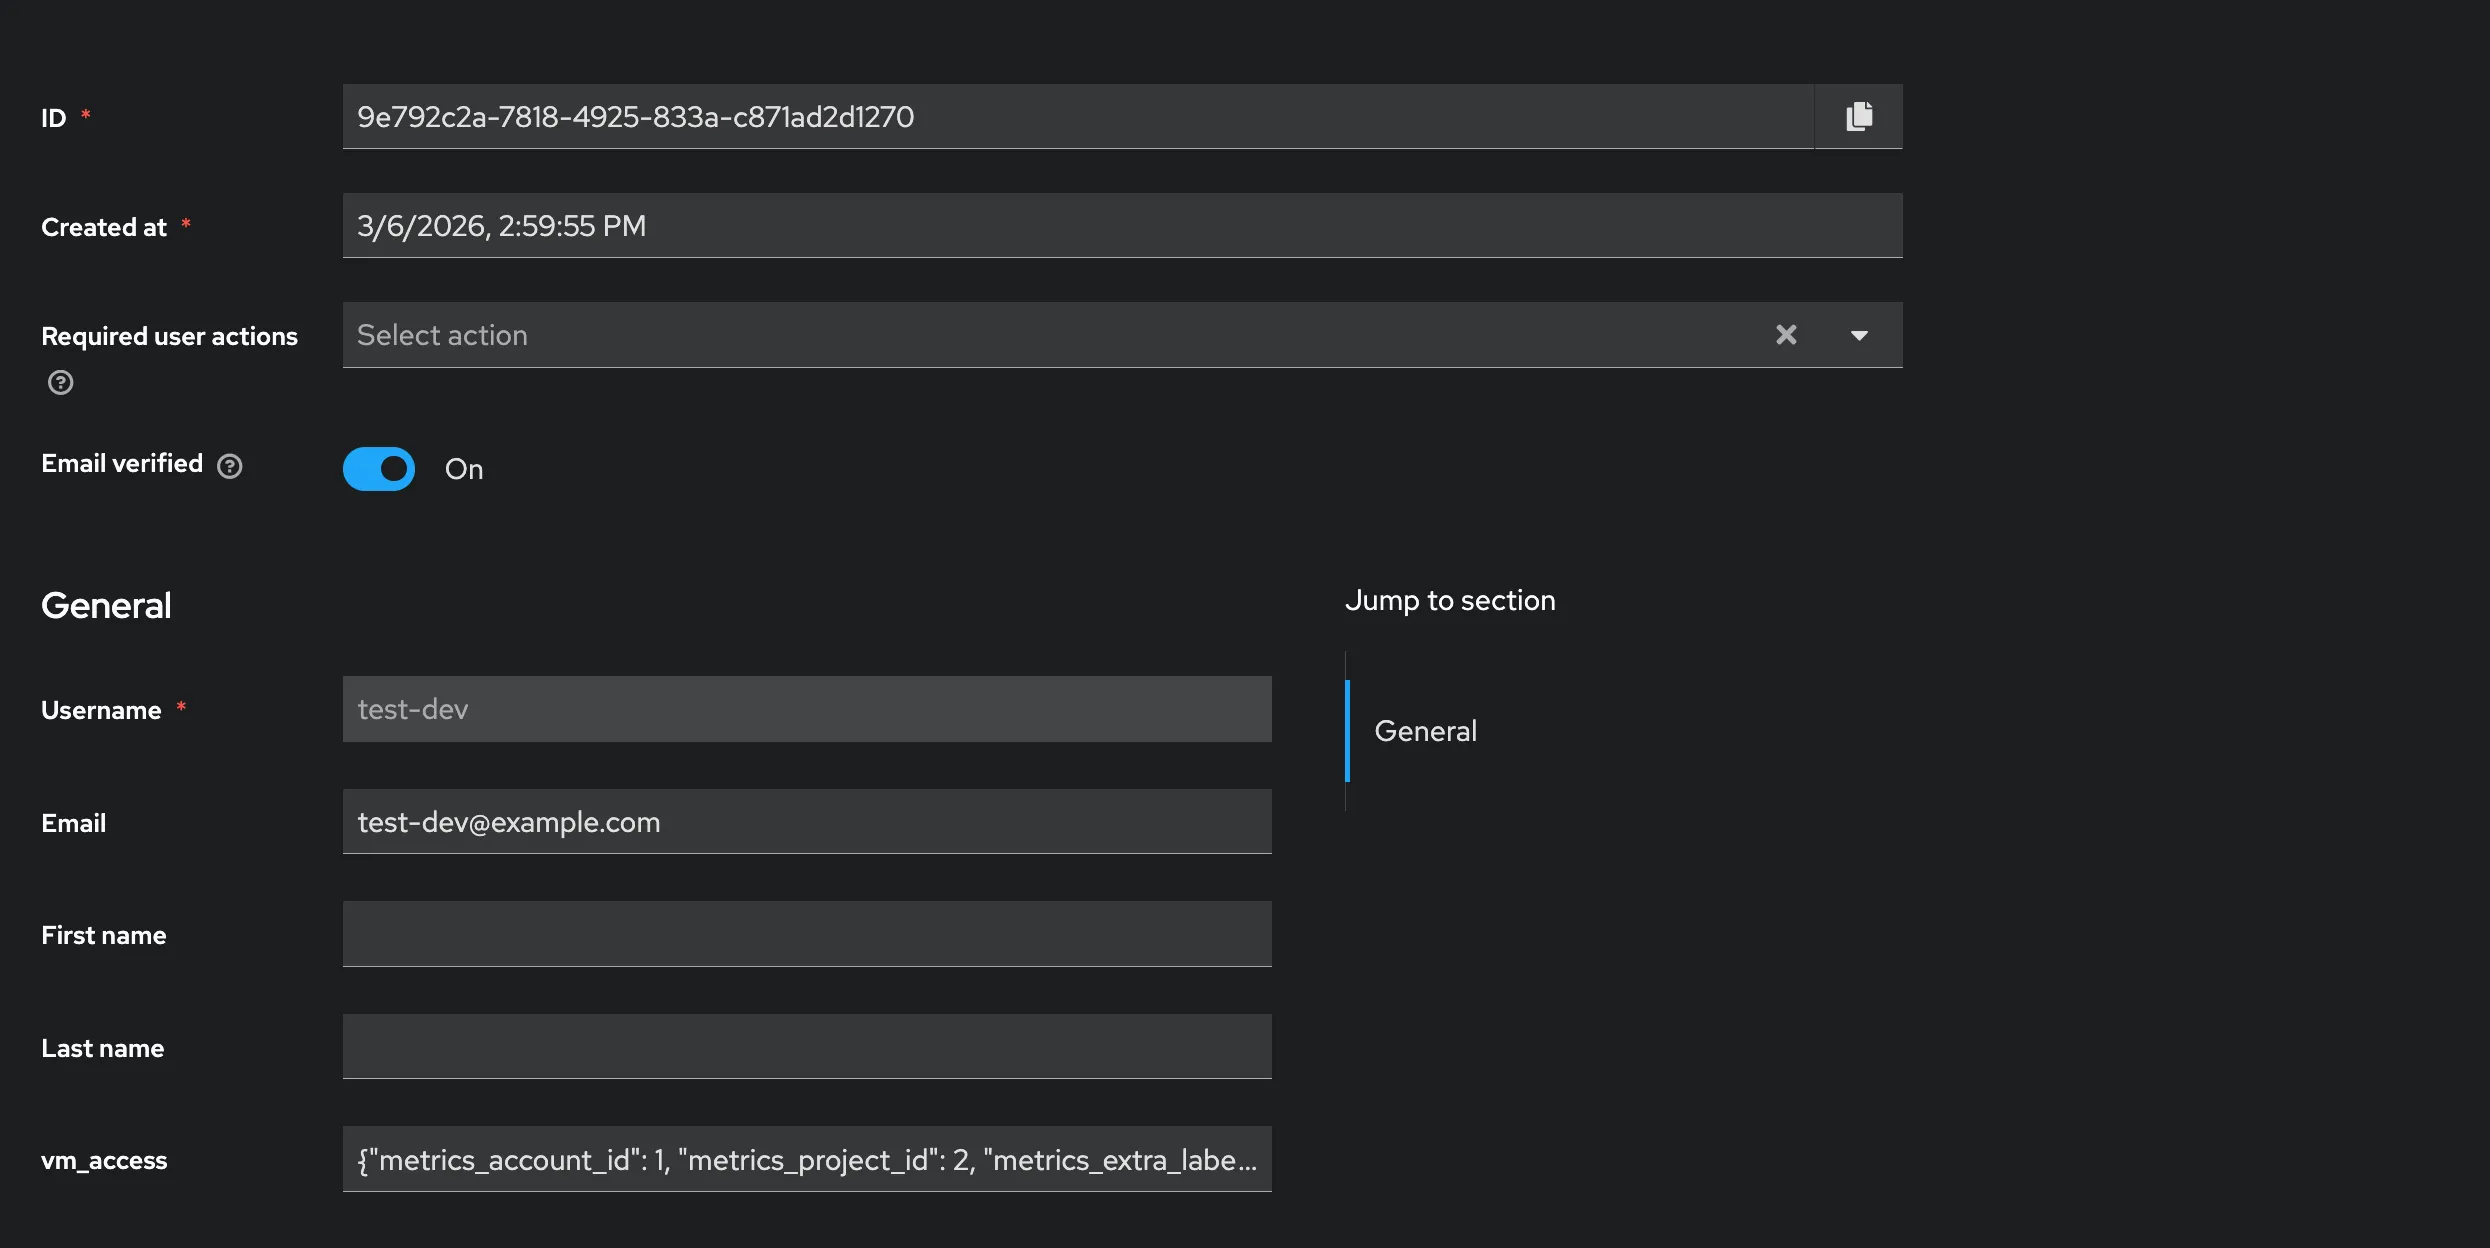
- Go to
Users->test-devuser ->Credentialstab. - Press
Set Password. - Type the password
testpass. - Disable
Temporaryoption - Press
Saveand confirm.
Go to
Users->adminuser.- Mark email as verified.
- Specify
admin@example.comasEmail. - Specify
vm_accessas{"metrics_account_id": 1, "metrics_project_id": 2, "metrics_extra_labels": ["team=admin"]}. - Click
Save.
Test identity provider #
Gather the following information needed to configure Grafana:
- The Realm name must be
master. To get the name, go toRealm settings->Generaland copy theName. - The Client ID must be
grafana. To get the ID, go toClients->grafana->Settingsand copy theClient ID. - The Client Secret is dynamically generated. To get the secret, go to
Clients->grafana->Credentialsand copy theClient Secret.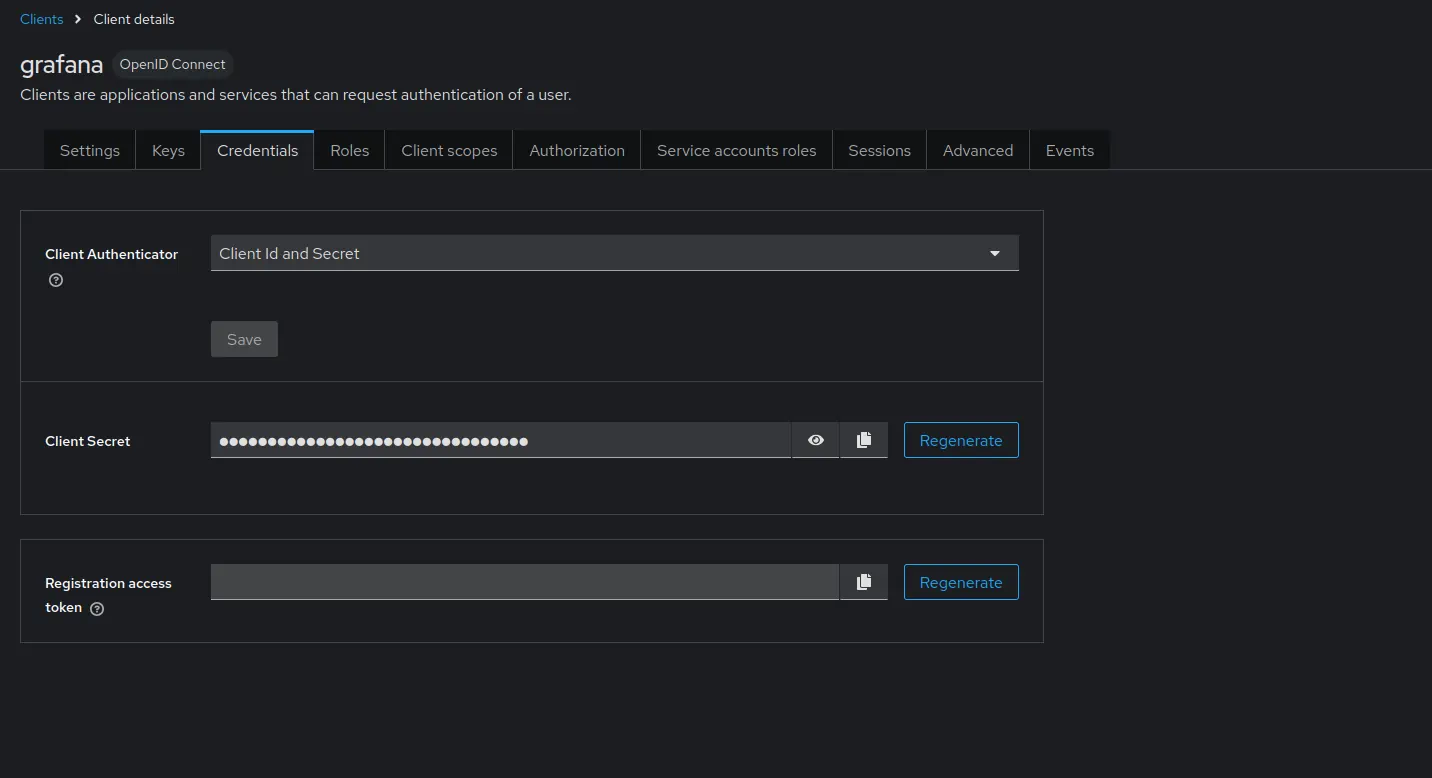
Test that everything is working by requesting a token using curl:
      TOKEN=$(curl --fail -s -X POST "http://keycloak:3001/realms/master/protocol/openid-connect/token" \
    -H "Content-Type: application/x-www-form-urlencoded" \
    -d "client_id=grafana" \
    -d "client_secret={CLIENT_SECRET}" \
    -d "grant_type=password" \
    -d "username=test-dev" \
    -d "password=testpass" | jq -r '.access_token') && echo $TOKEN
The response should contain a valid JWT token with the vm_access claim.
Use jwt.io
to decode and verify that the vm_access claim is present with the expected values.
Please note that the issued token is short-lived, so you might need to refresh it before use in later chapters.
VictoriaMetrics #
Storage and scraping #
First, create a scrape.yaml file with vmagent scrape configuration to ingest data into vmsingle and vmstorage for testing purposes:
      # scrape.yaml
scrape_configs:
  - job_name: stat
    metric_relabel_configs:
      # The team label showcases extra_filter functionality used with vmsingle.
      - if: "{instance =~ 'vmauth.*'}"
        action: replace
        target_label: team
        replacement: admin
      - if: "{instance =~ 'vmagent.*'}"
        action: replace
        target_label: team
        replacement: dev

      # The vm_account_id and vm_project_id labels showcase tenant functionality used with vmcluster
      - if: "{instance =~ 'vmauth.*'}"
        action: replace
        target_label: vm_account_id
        replacement: '1'
      - if: "{instance =~ 'vmauth.*'}"
        action: replace
        target_label: vm_project_id
        replacement: '2'
      - if: "{instance =~ 'vmagent.*'}"
        action: replace
        target_label: vm_account_id
        replacement: '1'
      - if: "{instance =~ 'vmagent.*'}"
        action: replace
        target_label: vm_project_id
        replacement: '2'
    static_configs:
      - targets:
          - vmagent:8429
          - vmauth:8427
Add VictoriaMetrics single-node and cluster to the compose.yaml file.
These services will be used to store metrics scraped by vmagent and to query them via Grafana using vmauth.
Relabeling rules will add the team label to the scraped metrics in order to test multi-tenant access.
Metrics from vmagent will be labeled with team=dev and metrics from vmauth will be labeled with team=admin.
vmagent will write data into VictoriaMetrics single-node and cluster (with tenant 1:2).
      # compose.yaml
services:
  vmsingle:
    image: victoriametrics/victoria-metrics:v1.139.0

  vmstorage:
    image: victoriametrics/vmstorage:v1.139.0-cluster

  vminsert:
    image: victoriametrics/vminsert:v1.139.0-cluster
    command:
      - -storageNode=vmstorage:8400

  vmselect:
    image: victoriametrics/vmselect:v1.139.0-cluster
    command:
      - -storageNode=vmstorage:8401

  vmagent:
    image: victoriametrics/vmagent:v1.139.0
    volumes:
      - ./scrape.yaml:/etc/vmagent/config.yaml
    command:
      - -promscrape.config=/etc/vmagent/config.yaml
      - -remoteWrite.url=http://vminsert:8480/insert/multitenant/prometheus/api/v1/write
      - -remoteWrite.url=http://vmsingle:8428/api/v1/write
Vmauth #
Before we start, let’s explore the concept of placeholders supported in the vmauth configuration.
Placeholders can be used inside the url_prefix property to restrict access by setting the
tenant
or
extra filters
.
A placeholder value is taken from the authenticated JWT token. The following placeholders are supported:
{{.MetricsTenant}}placeholder is a combination ofvm_access.metrics_account_idandvm_access.metrics_project_iddelimited by:.{{.MetricsExtraLabels}}placeholder is substituted fromvm_access.metrics_extra_labelsclaim property.{{.MetricsExtraFilters}}placeholder is substituted fromvm_access.metrics_extra_filtersclaim property.
Now, let’s create a vmauth configuration file auth.yaml that enables OIDC authorization using the
identity provider
.
For cluster access, we use the {{.MetricsTenant}} placeholder to route requests to a specific tenant.
For single-node access, we use {{.MetricsExtraLabels}}.
Read more about templating in vmauth
docs
.
      # auth.yaml
users:
  - jwt:
      oidc:
        issuer: 'http://keycloak:3001/realms/master'
    url_map:
      - src_paths:
          - "/insert/.*"
        drop_src_path_prefix_parts: 1
        url_prefix: "http://vminsert:8480/insert/{{.MetricsTenant}}/prometheus/"
      - src_paths:
          - "/select/.*"
        drop_src_path_prefix_parts: 1
        url_prefix: "http://vmselect:8481/select/{{.MetricsTenant}}/prometheus/"
      - src_paths:
          - "/single/.*"
        drop_src_path_prefix_parts: 1
        url_prefix: "http://vmsingle:8428?extra_label={{.MetricsExtraLabels}}"
Now add the vmauth service to compose.yaml:
      # compose.yaml
services:
  vmauth:
    image: docker.io/victoriametrics/vmauth:v1.139.0
    ports:
      - 8427:8427
    volumes:
      - ./auth.yaml:/auth.yaml
    command:
      - -auth.config=/auth.yaml
Test vmauth #
Start the services:
docker compose up
Use the token obtained in the Test identity provider section to test vmauth configuration.
Cluster select:
      curl --fail http://localhost:8427/select/api/v1/status/buildinfo -H "Authorization: Bearer $TOKEN"

# Output:
# {"status":"success","data":{"version":"2.24.0"}}
Cluster insert:
      curl --fail http://localhost:8427/insert/api/v1/write -H "Authorization: Bearer $TOKEN" -i
# Output
# HTTP/1.1 204 No Content
# ...
Single select:
      curl --fail http://localhost:8427/single/api/v1/status/buildinfo -H "Authorization: Bearer $TOKEN"

# Output:
# {"status":"success","data":{"version":"2.24.0"}}
Grafana #
Setup #
Add the Grafana service to the compose.yaml file.
This configuration enables OAuth authentication using the previously configured Keycloak service as the identity provider.
Don’t forget to replace the {CLIENT_SECRET} placeholder with the actual client secret gathered earlier.
      # compose.yaml
services:
  grafana:
    image: grafana/grafana:12.1.0
    ports:
      - 3000:3000
    environment:
      GF_SERVER_ROOT_URL: http://grafana:3000
      GF_AUTH_GENERIC_OAUTH_ENABLED: true
      GF_AUTH_GENERIC_OAUTH_ALLOW_SIGN_UP: true
      GF_AUTH_GENERIC_OAUTH_NAME: keycloak
      GF_AUTH_GENERIC_OAUTH_CLIENT_ID: grafana
      GF_AUTH_GENERIC_OAUTH_CLIENT_SECRET: '{CLIENT_SECRET}'
      GF_AUTH_GENERIC_OAUTH_EMAIL_ATTRIBUTE_PATH: email
      GF_AUTH_GENERIC_OAUTH_LOGIN_ATTRIBUTE_PATH: username
      GF_AUTH_GENERIC_OAUTH_NAME_ATTRIBUTE_PATH: full_name
      GF_AUTH_GENERIC_OAUTH_SCOPES: openid profile email
      GF_AUTH_GENERIC_OAUTH_USE_REFRESH_TOKEN: true
      GF_AUTH_GENERIC_OAUTH_AUTH_URL: http://keycloak:3001/realms/master/protocol/openid-connect/auth
      GF_AUTH_GENERIC_OAUTH_TOKEN_URL: http://keycloak:3001/realms/master/protocol/openid-connect/token
      GF_AUTH_GENERIC_OAUTH_API_URL: http://keycloak:3001/realms/master/protocol/openid-connect/userinfo
      GF_AUTH_GENERIC_OAUTH_ROLE_ATTRIBUTE_PATH: contains(groups[*], 'grafana-editor') && 'Editor' || 'GrafanaAdmin'
    volumes:
      - grafanadata:/var/lib/grafana/

volumes:
  grafanadata: {}
Alternatively, OAuth authentication can be enabled via the grafana.ini configuration file.
Don’t forget to mount it to the Grafana service at /etc/grafana/grafana.ini.
      # grafana.ini

[server]
root_url = http://grafana:3000

[auth.generic_oauth]
enabled = true
allow_sign_up = true
name = keycloak
client_id = grafana
client_secret = {CLIENT_SECRET}
scopes = openid profile email
auth_url = http://keycloak:3001/realms/master/protocol/openid-connect/auth
token_url = http://keycloak:3001/realms/master/protocol/openid-connect/token
api_url = http://keycloak:3001/realms/master/protocol/openid-connect/userinfo
use_refresh_token = true
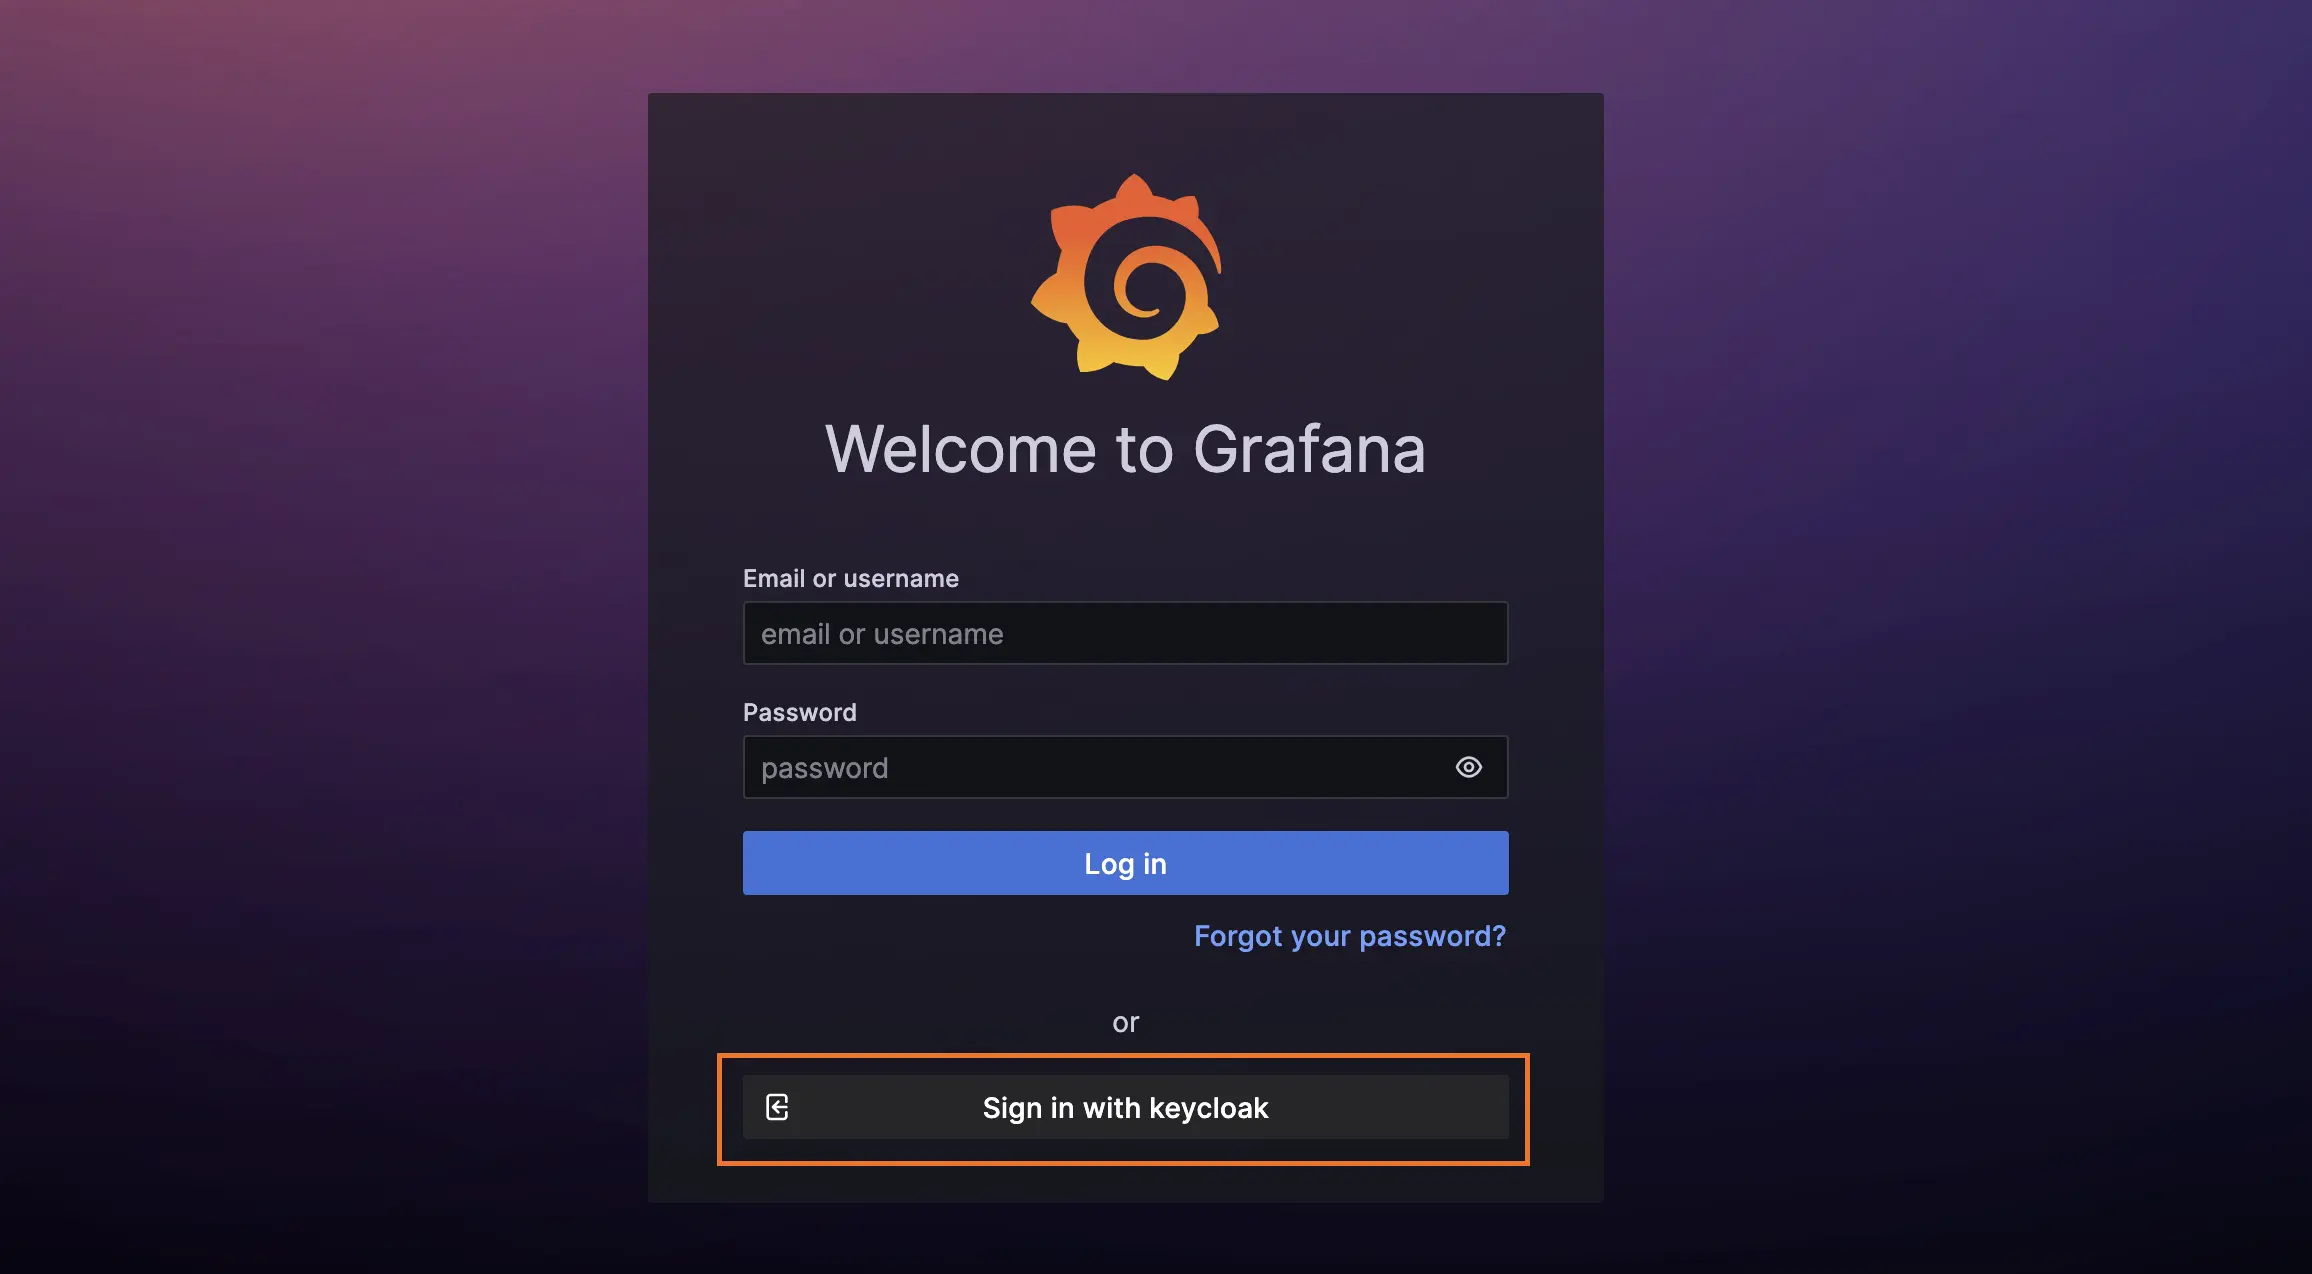
After starting Grafana with the new config, you should be able to log in http://grafana:3000 using your identity provider .
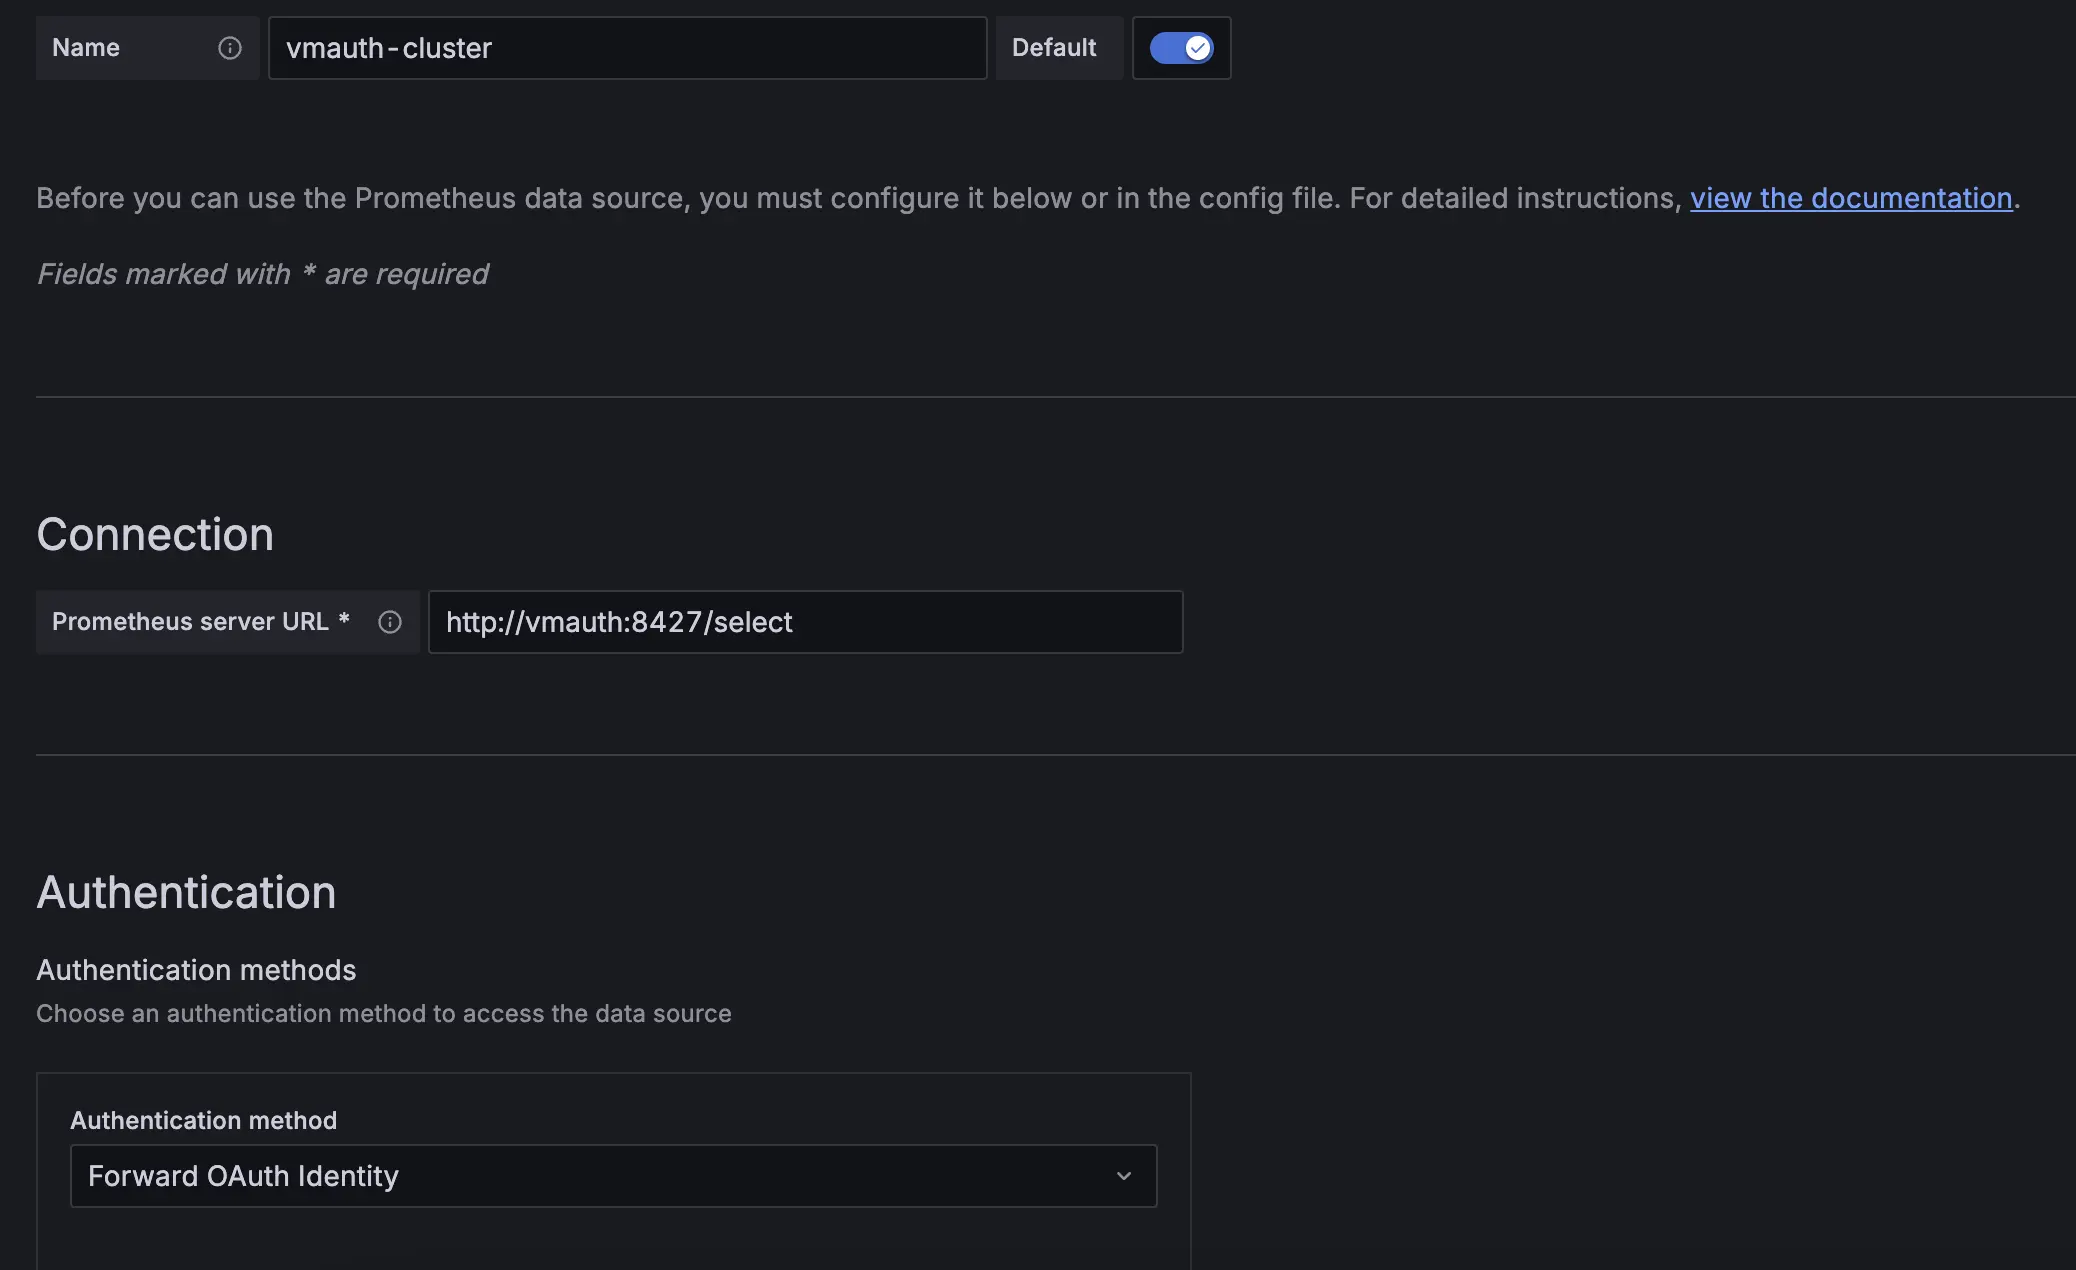
Datasource #
Create two Prometheus datasources in Grafana with the following URLs: http://vmauth:8427/select and http://vmauth:8427/single, pointing to the vmselect and vmsingle services, respectively. Make sure the authentication method is set to Forward OAuth identity.
You can also use the VictoriaMetrics Grafana datasource plugin. See installation instructions in Grafana datasource - Installation .
Users with the vm_access claim will be able to query metrics from the specified tenant with extra filters applied.
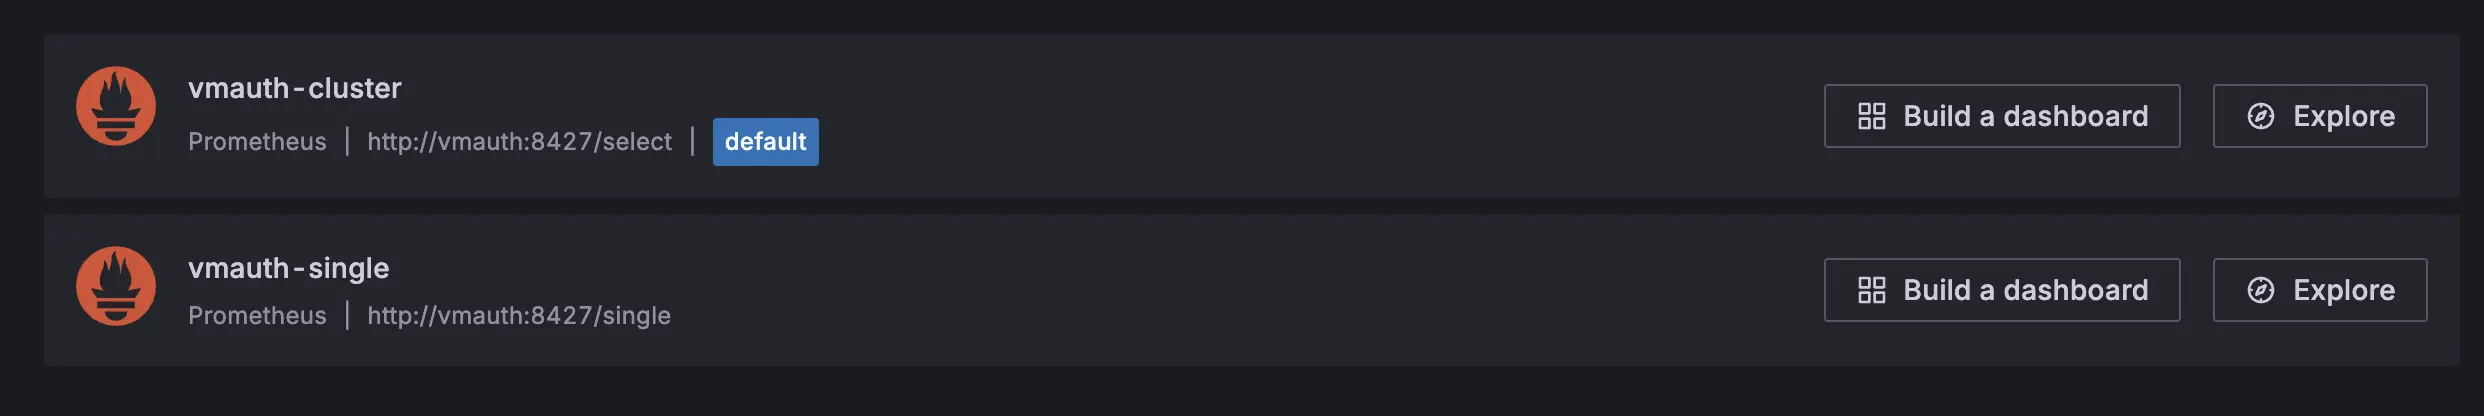
Test access #
The Grafana datasources configuration should be as follows:
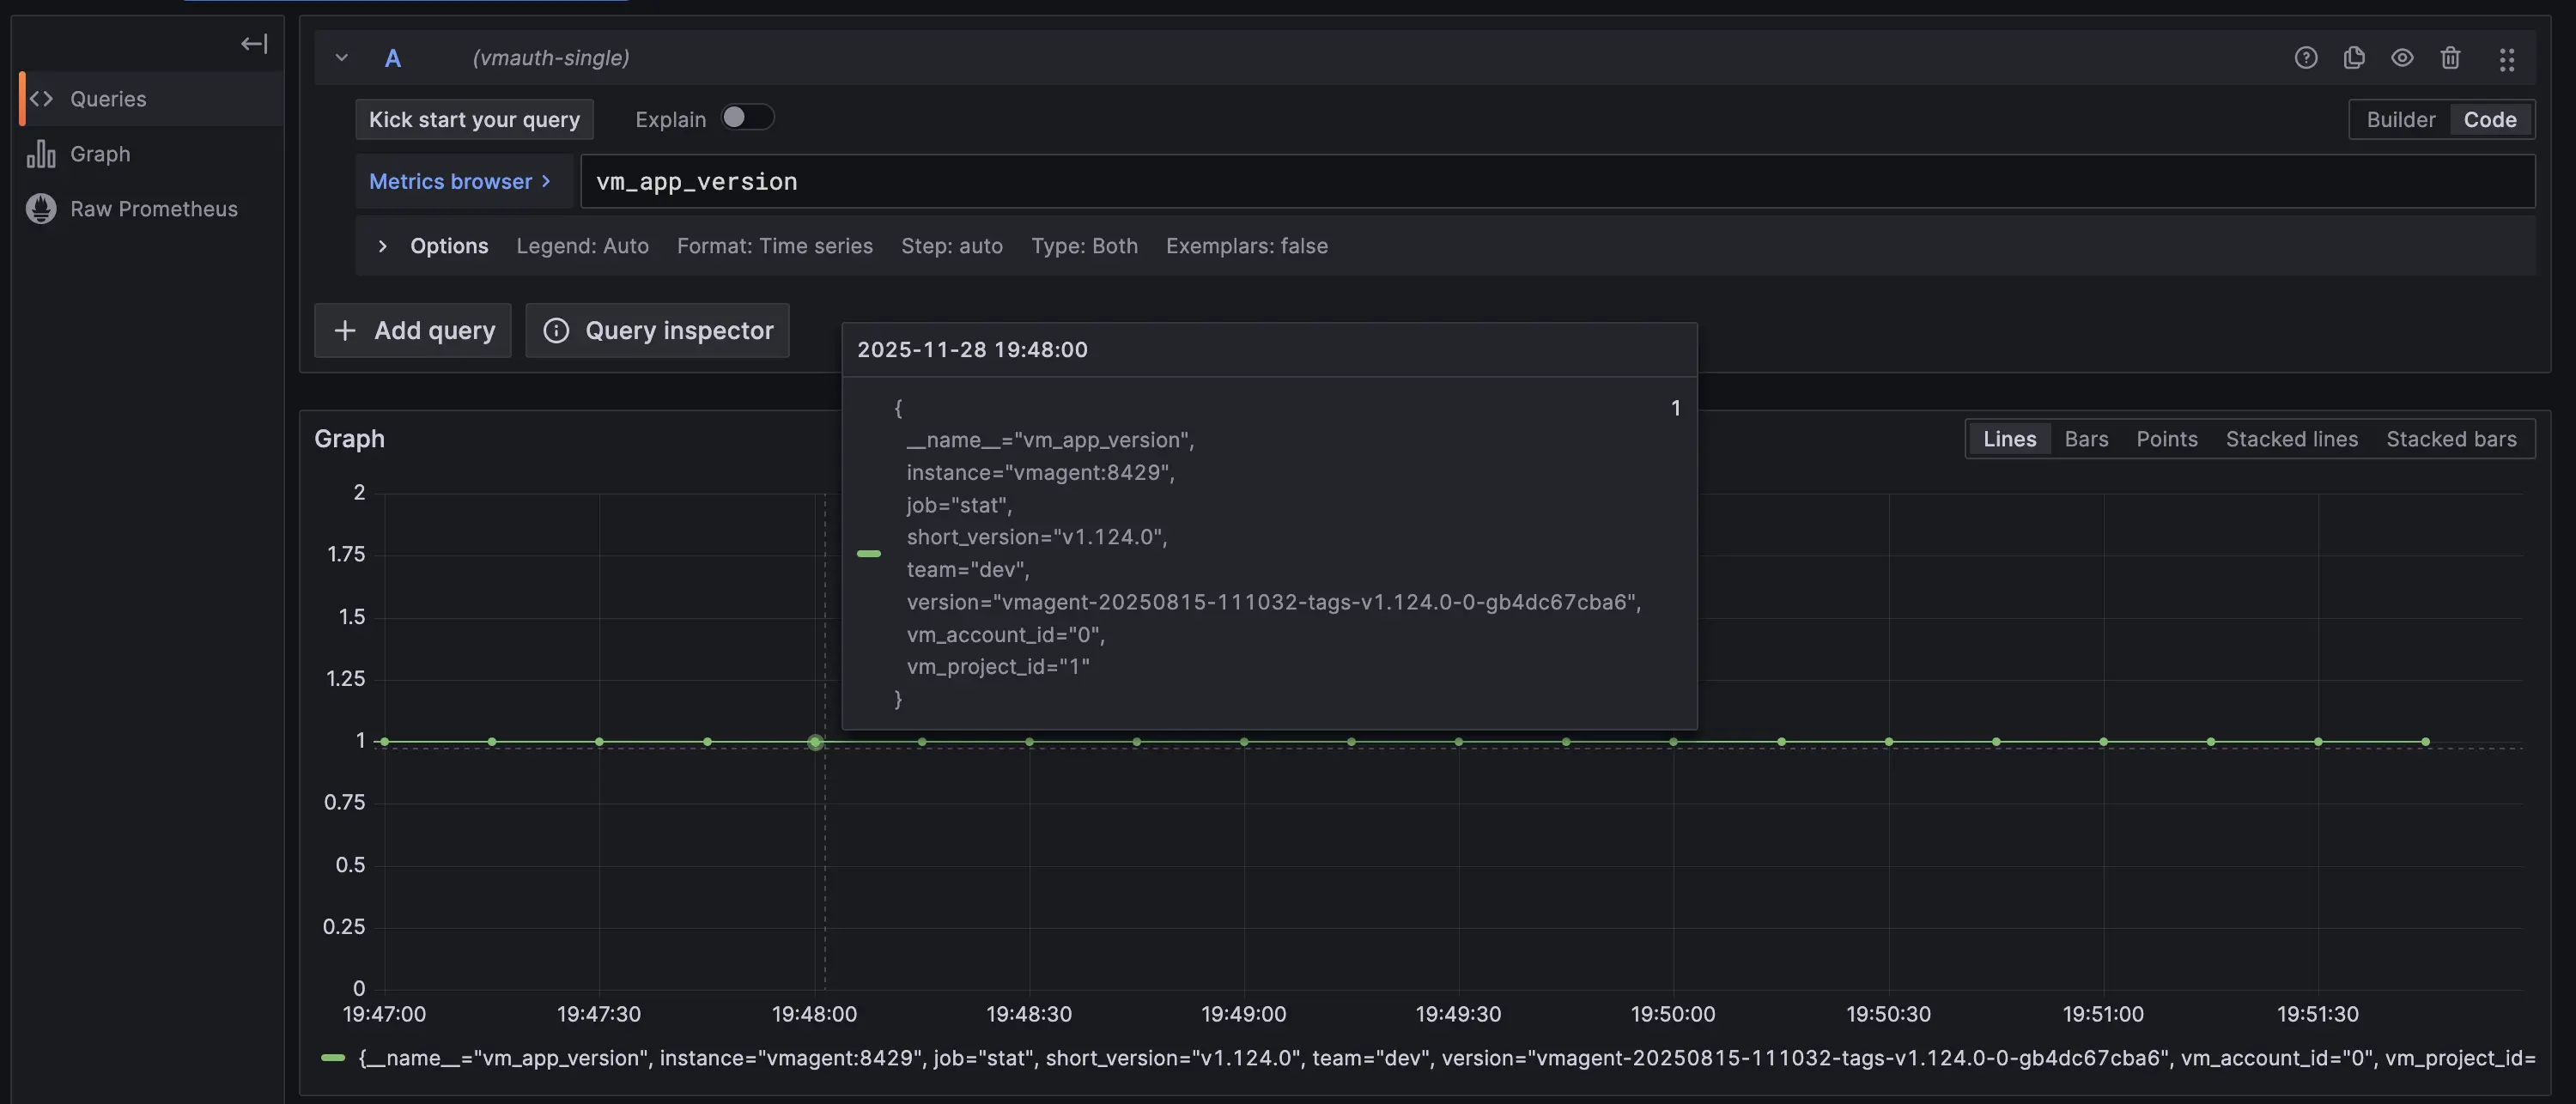
Let’s log in as a dev user in the VictoriaMetrics cluster and single versions. Both data sources should return the same metrics.
The only difference is the filter: for the VictoriaMetrics cluster, the vmauth-cluster data source must restrict results by tenant=1:2.
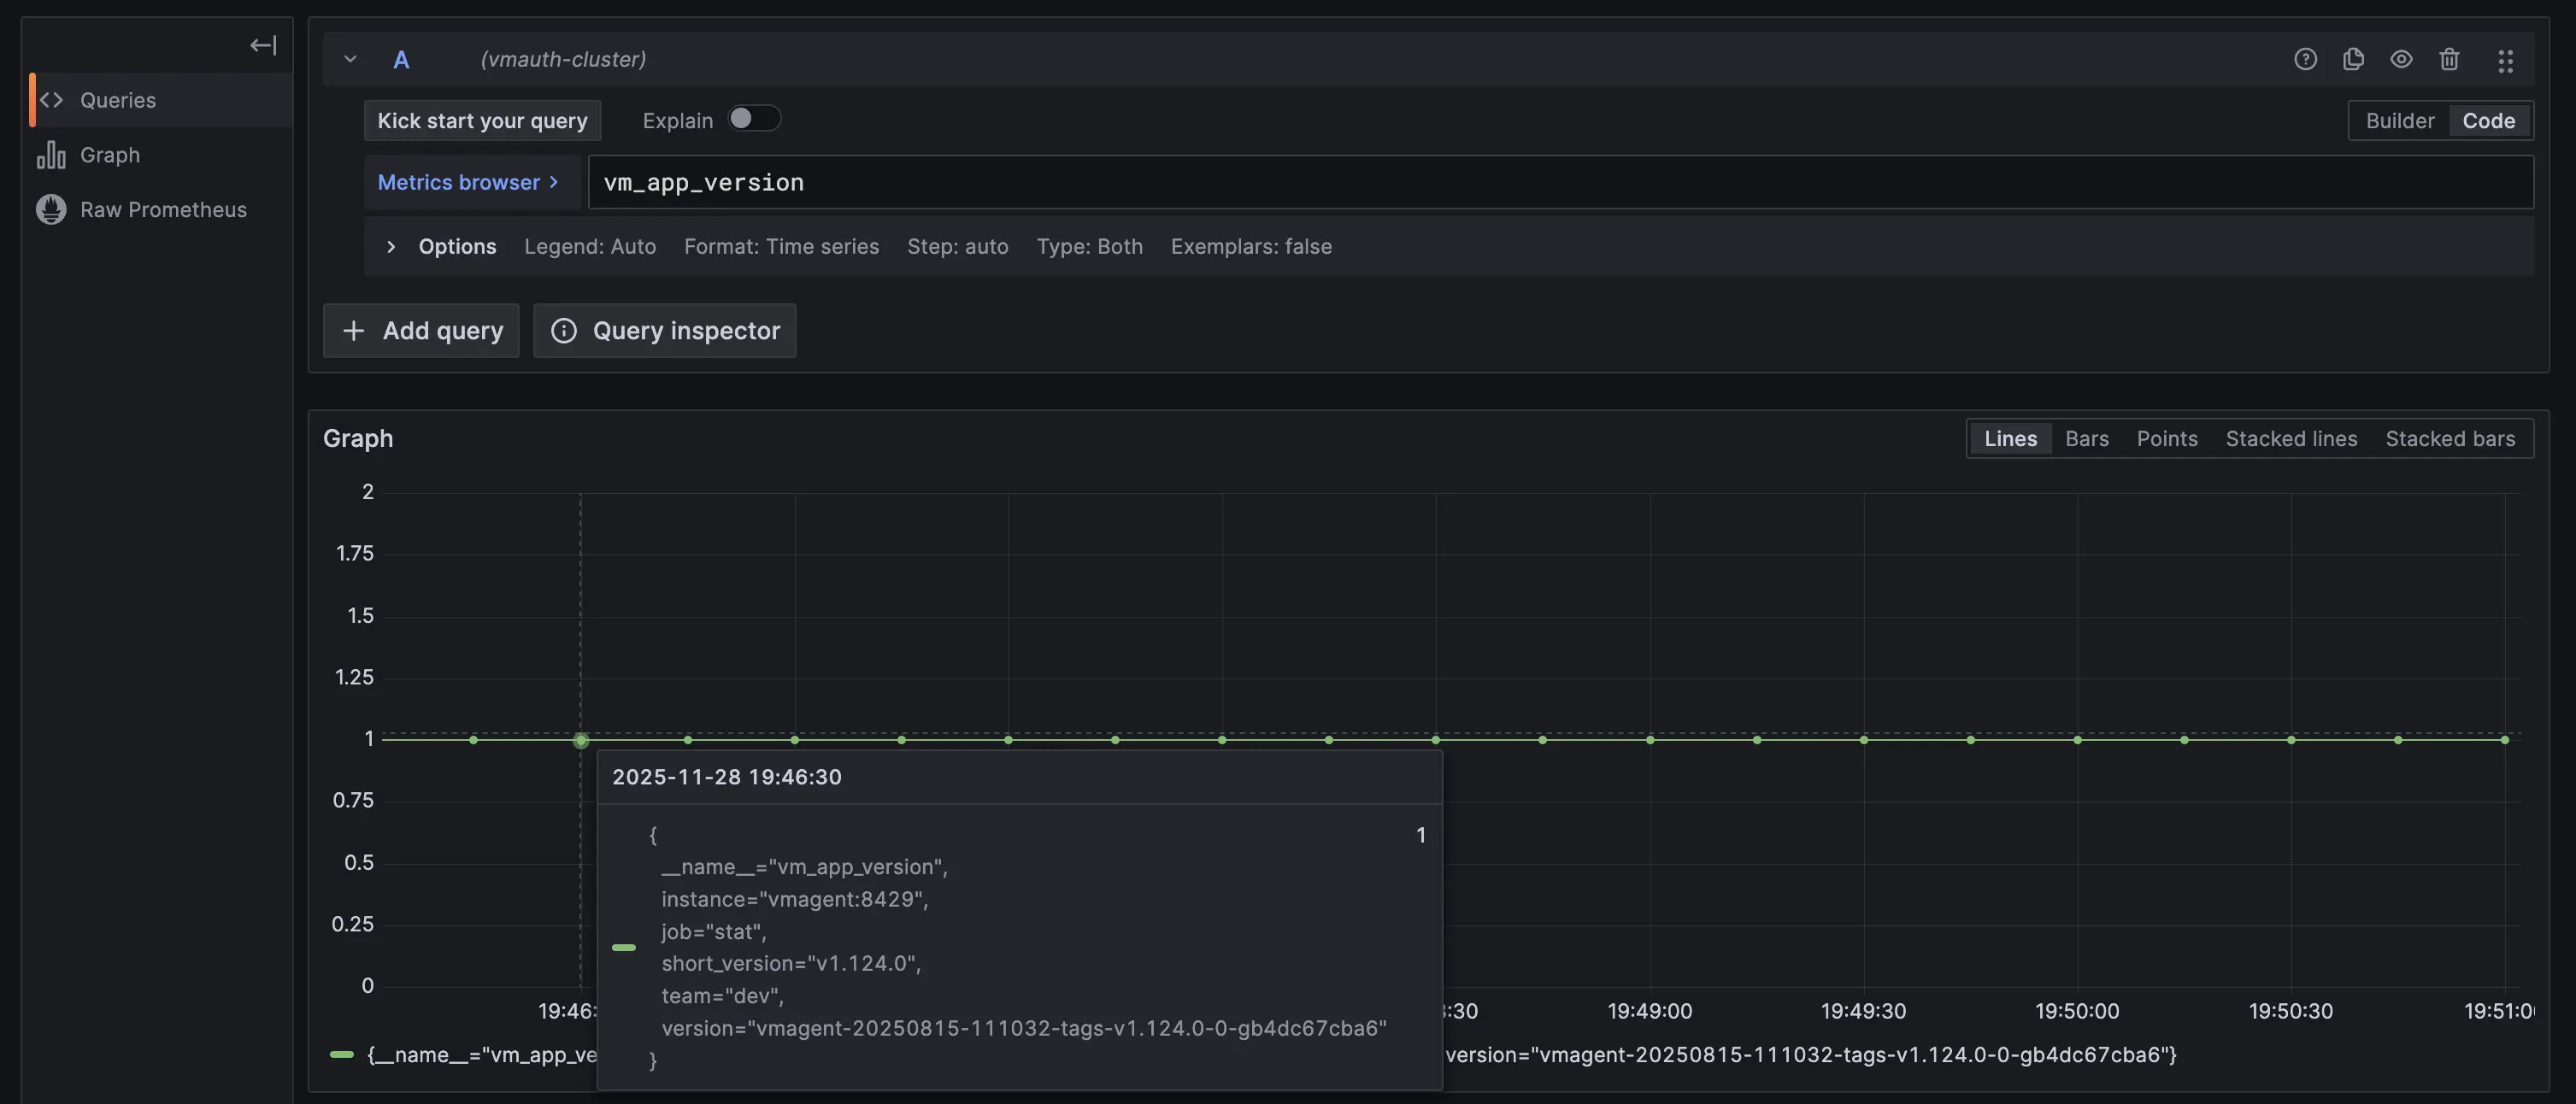
While on VictoriaMetrics single vmauth-single must apply the team=dev label filter instead.
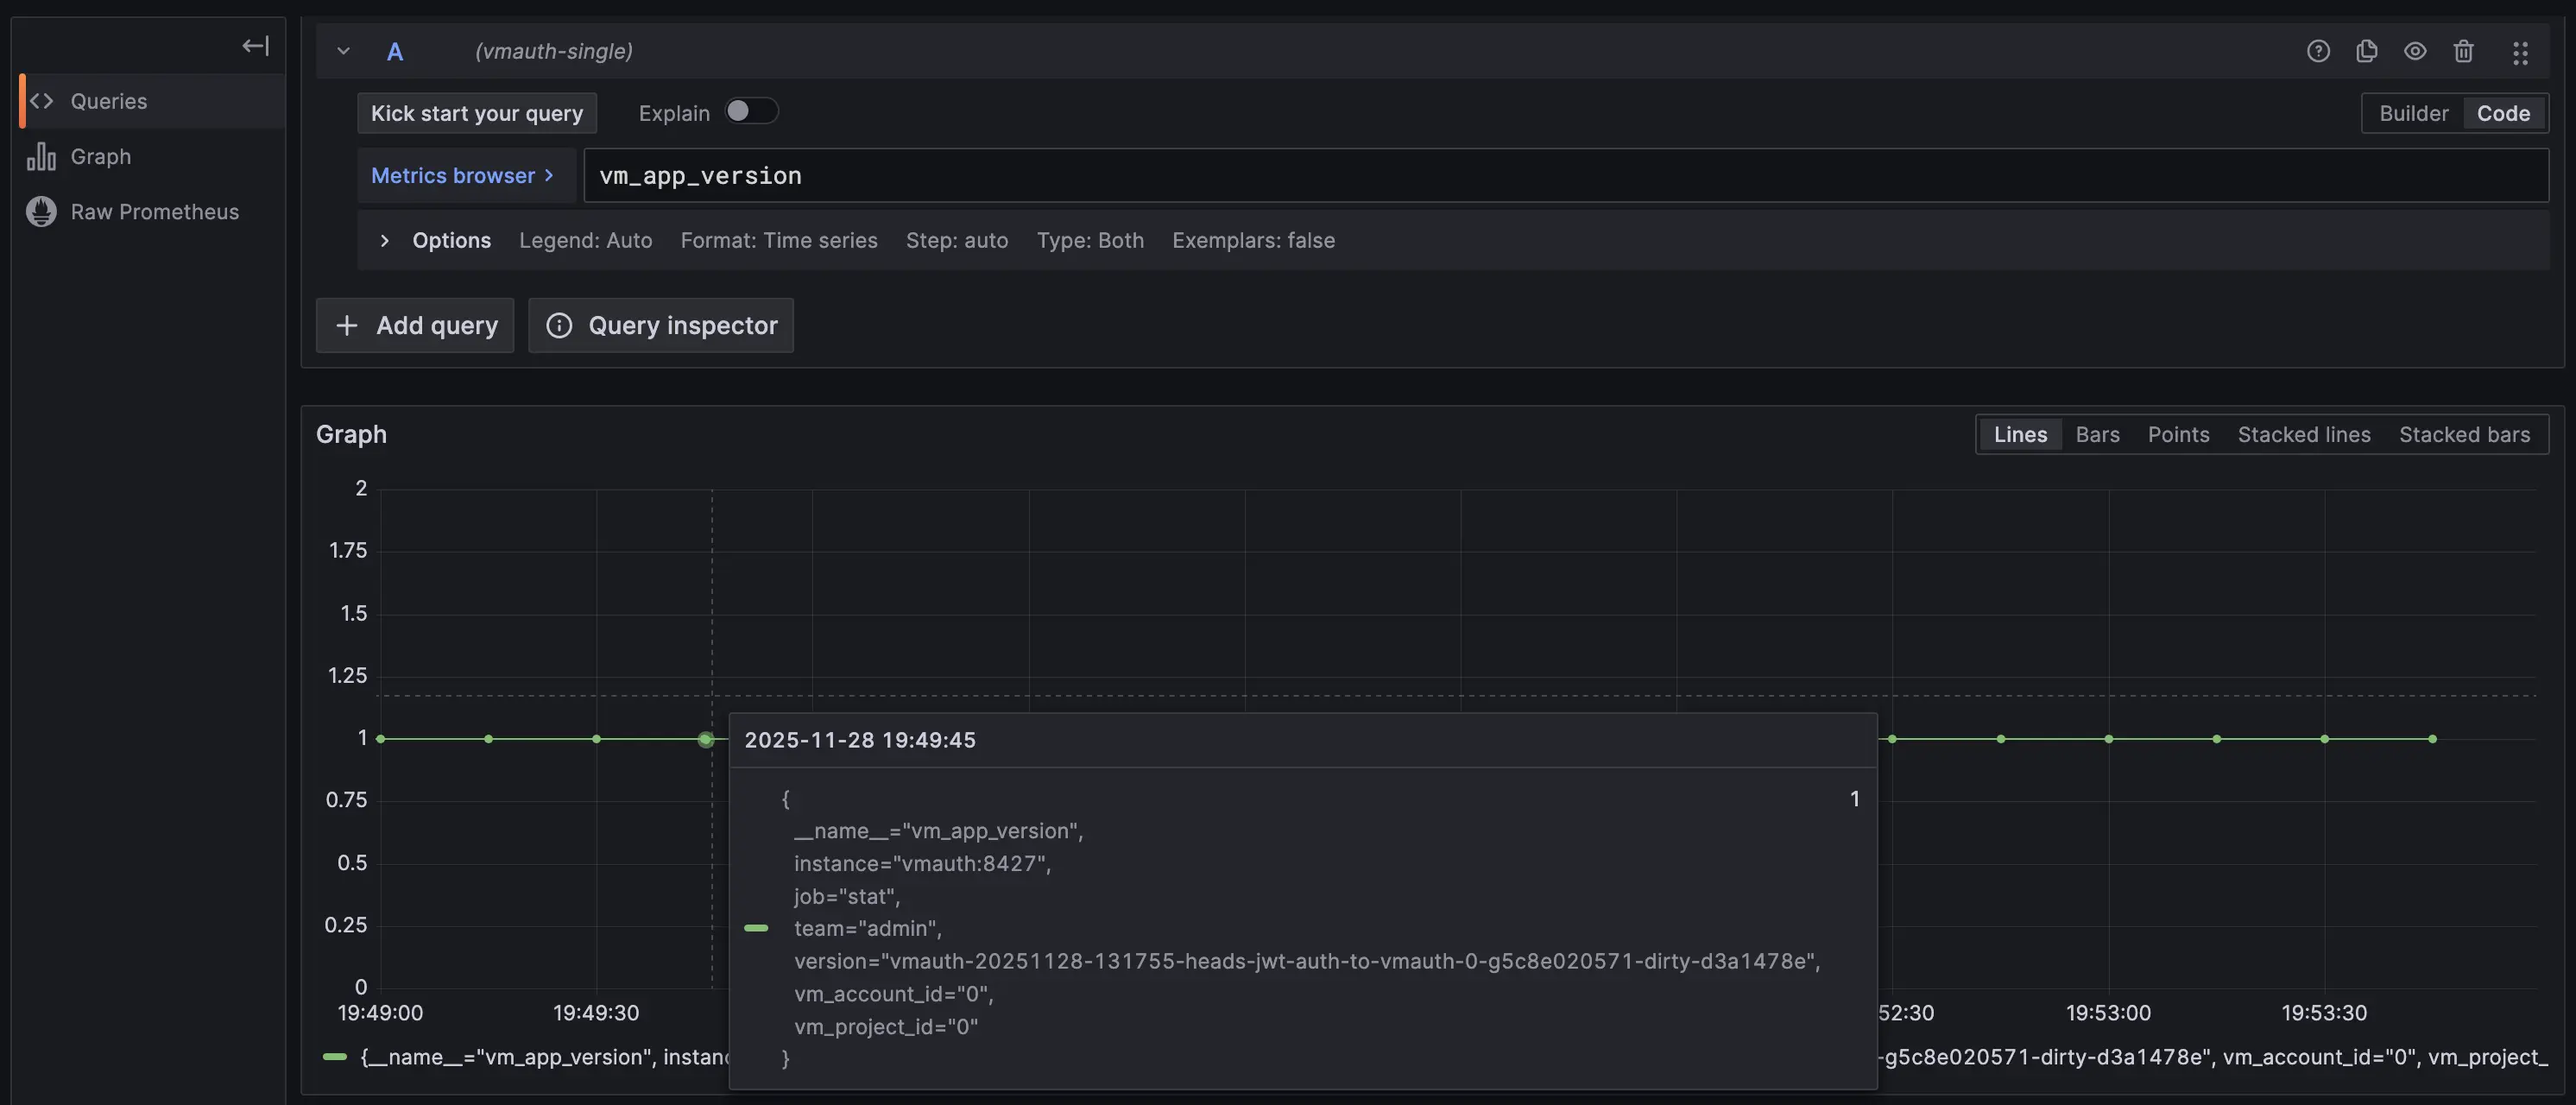
Let’s log in as an admin user. The vmauth-single data source should differ from the previous user, while vmauth-cluster should remain the same because both users use tenant 1:2.
The only difference is the filter: in the VictoriaMetrics cluster vmauth-cluster, the data source must restrict results by tenant=1:2.

While in VictoriaMetrics single vmauth-single must apply the team=admin label filter instead.
Summary #
In this guide, we demonstrated how to set up vmauth with OIDC authorization using Keycloak as the identity provider. We also showed how to provide multi-tenant access to your metrics stored in VictoriaMetrics, single-node or cluster, using Grafana and vmauth with OIDC authorization enabled.