vmgateway access control feature has been deprecated. Consider following the vmauth guide Setup vmauth - Multi-Tenant Access with Grafana & OIDC instead. See migration docs.
Using Grafana with vmgateway is a great way to provide multi-tenant access to your metrics. vmgateway provides a way to authenticate users using JWT tokens issued by an external identity provider. Those tokens can include information about the user and the tenant they belong to, which can be used to restrict access to metrics to only those that belong to the tenant.
Prerequisites #
- Identity service that can issue JWT tokens
- Grafana
- VictoriaMetrics single-node or cluster version
- vmgateway
- An active license key. You can obtain a trial license key here .
Configure identity service #
The identity service must be able to issue JWT tokens with the following vm_access claim:
      {
  "vm_access": {
    "tenant_id": {
      "account_id": 0,
      "project_id": 0
    }
  }
}
See details about all supported options in the vmgateway documentation .
Configuration example for Keycloak #
Keycloak is an open-source identity service that can issue JWT tokens.
Log in with admin credentials to your Keycloak instance
Go to
Clients->Create.
UseOpenID ConnectasClient Type.
SpecifygrafanaasClient ID.
ClickNext.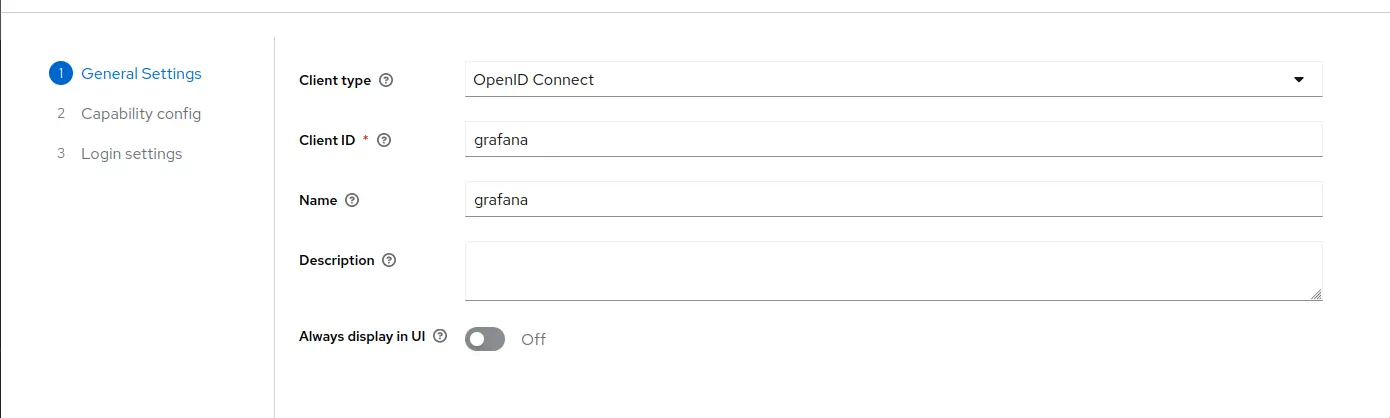
Enable
Client authentication.
EnableAuthorization.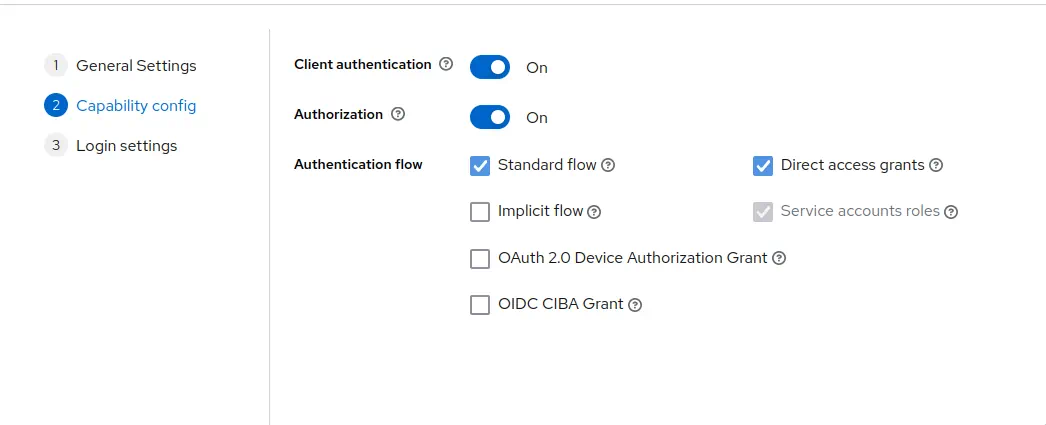 Click
Click Next.Add Grafana URL as
Root URL. For example,http://localhost:3000/.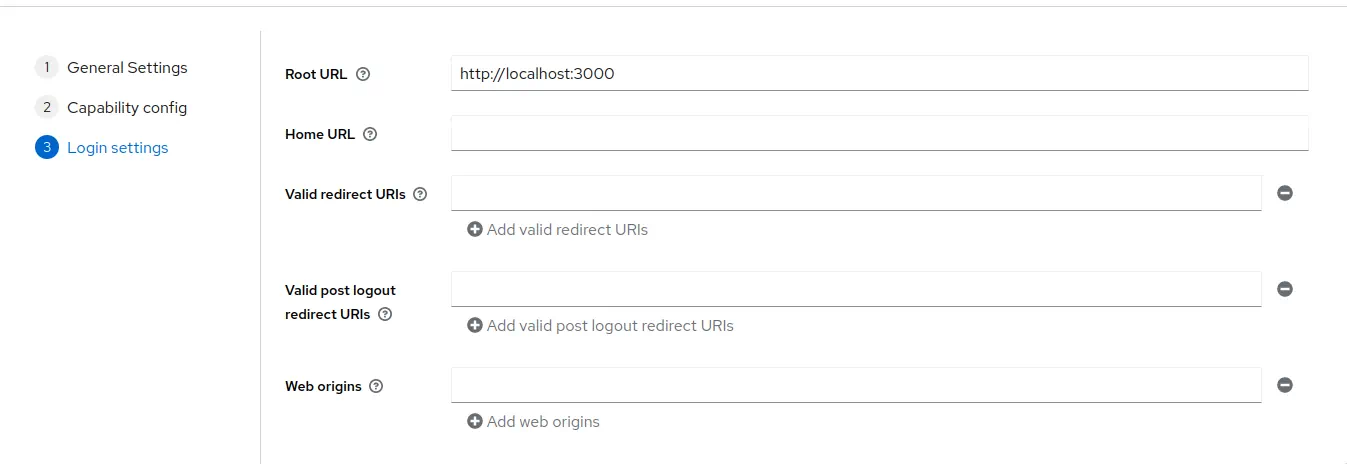 Click
Click Save.Go to
Clients->grafana->Credentials.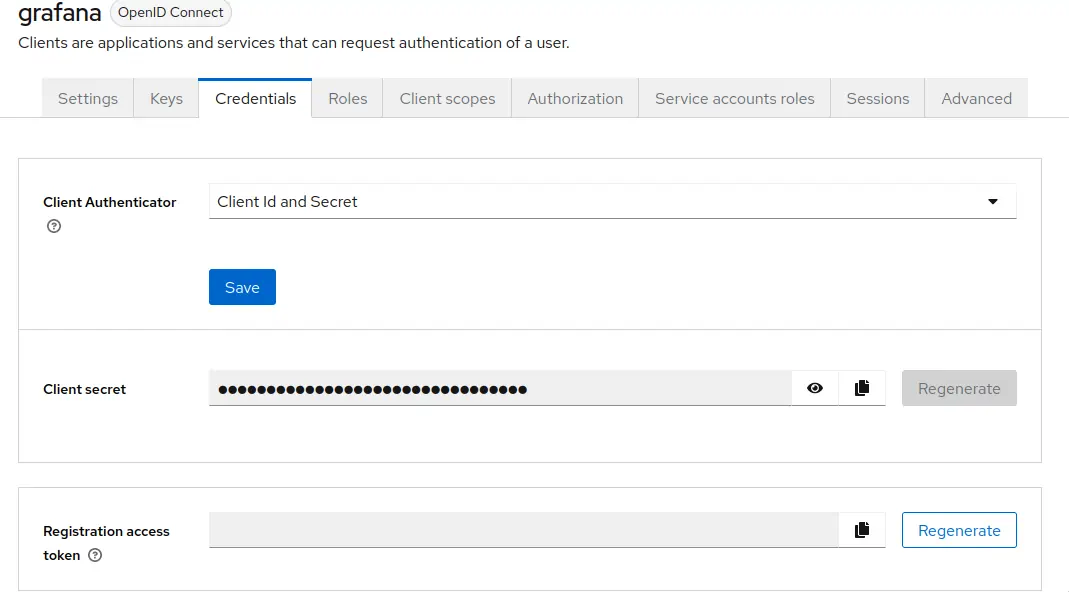 Copy the value of
 Client secret. It will be used later in Grafana configuration.Go to
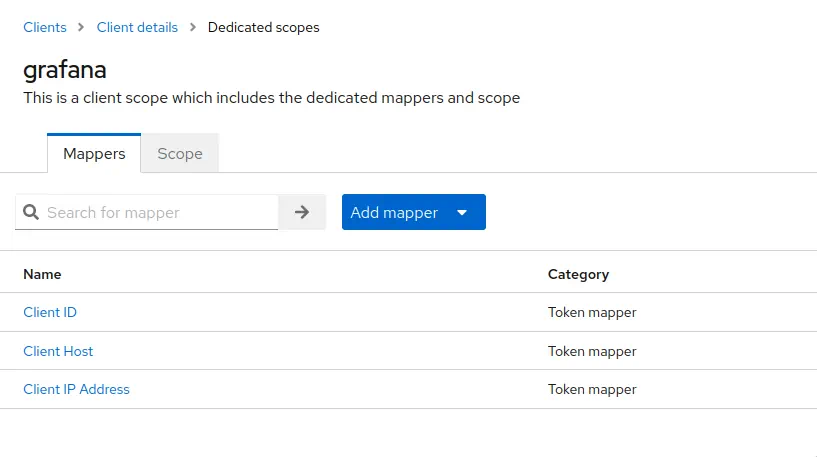
Clients->grafana->Client scopes.
Click atgrafana-dedicated->Configure a new mapper->User attribute.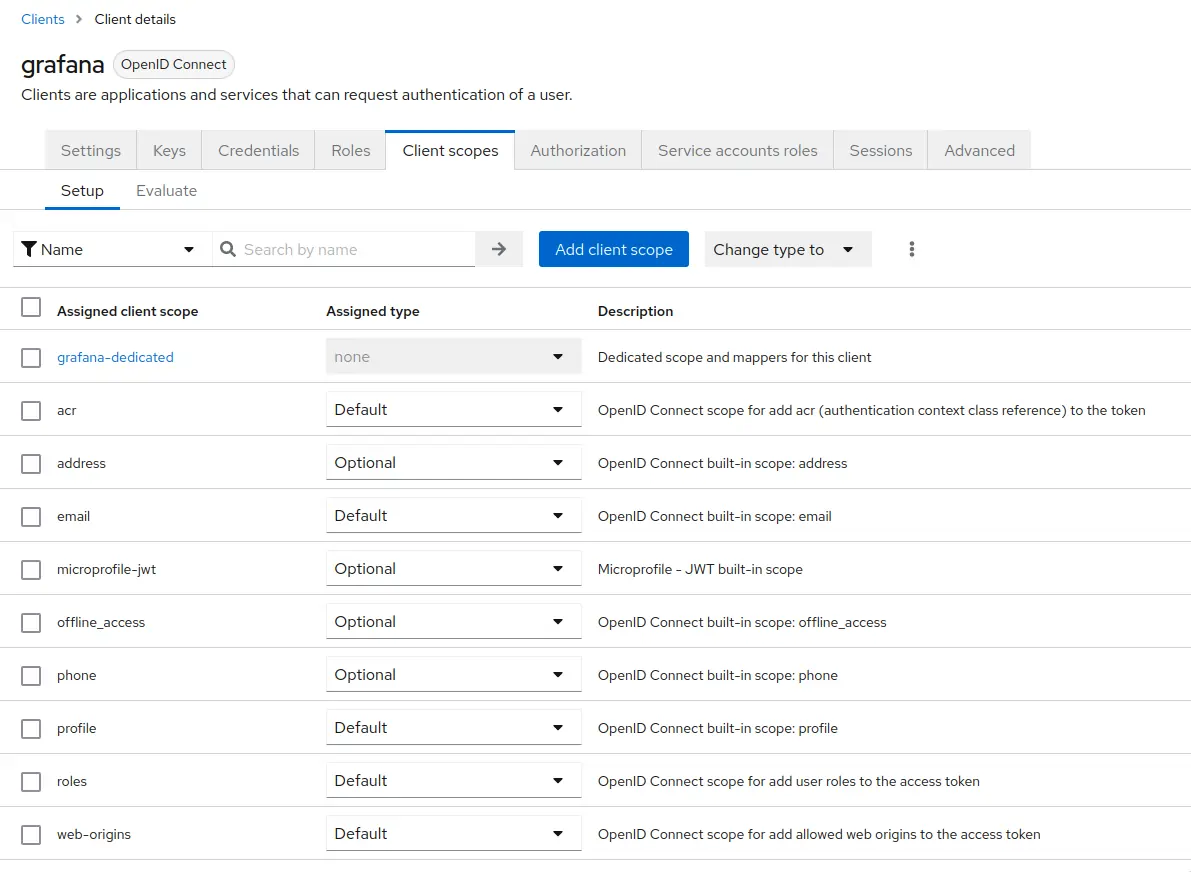
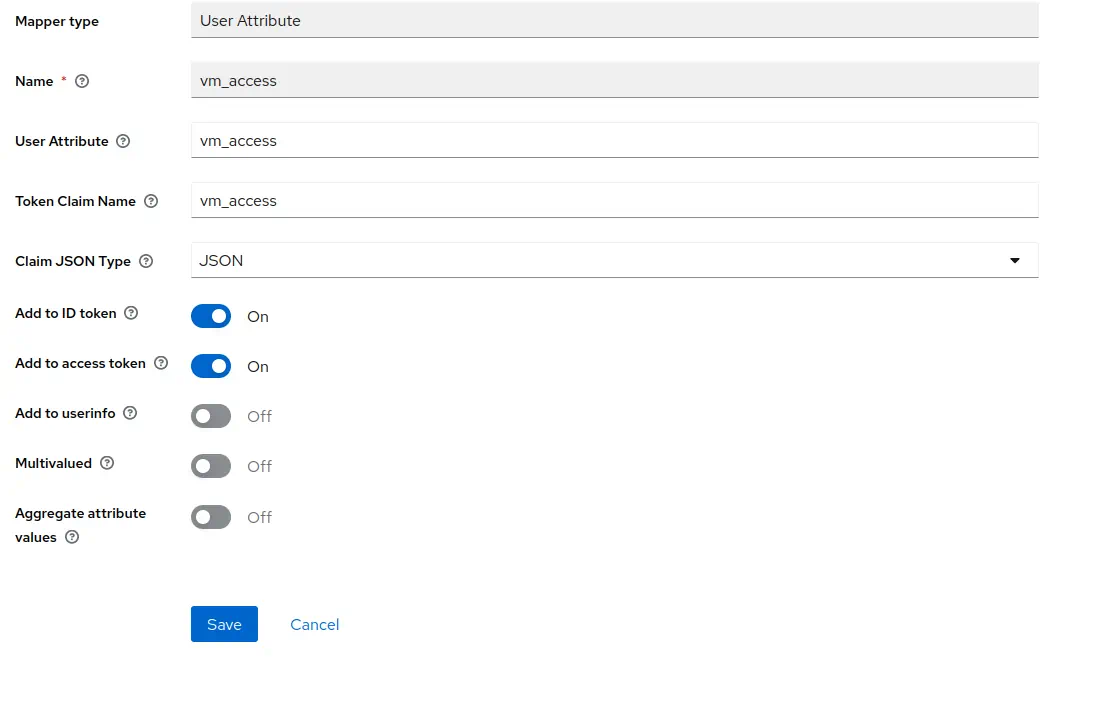
 Configure the mapper as follows
Nameasvm_access.Token Claim Nameasvm_access.User Attributeasvm_access.Claim JSON TypeasJSON. EnableAdd to ID tokenandAdd to access token.
 Click
Click Save.Go to
Realm settings->User profile.
ClickCreate attribute.
Specifyvm_accessasAttribute [Name].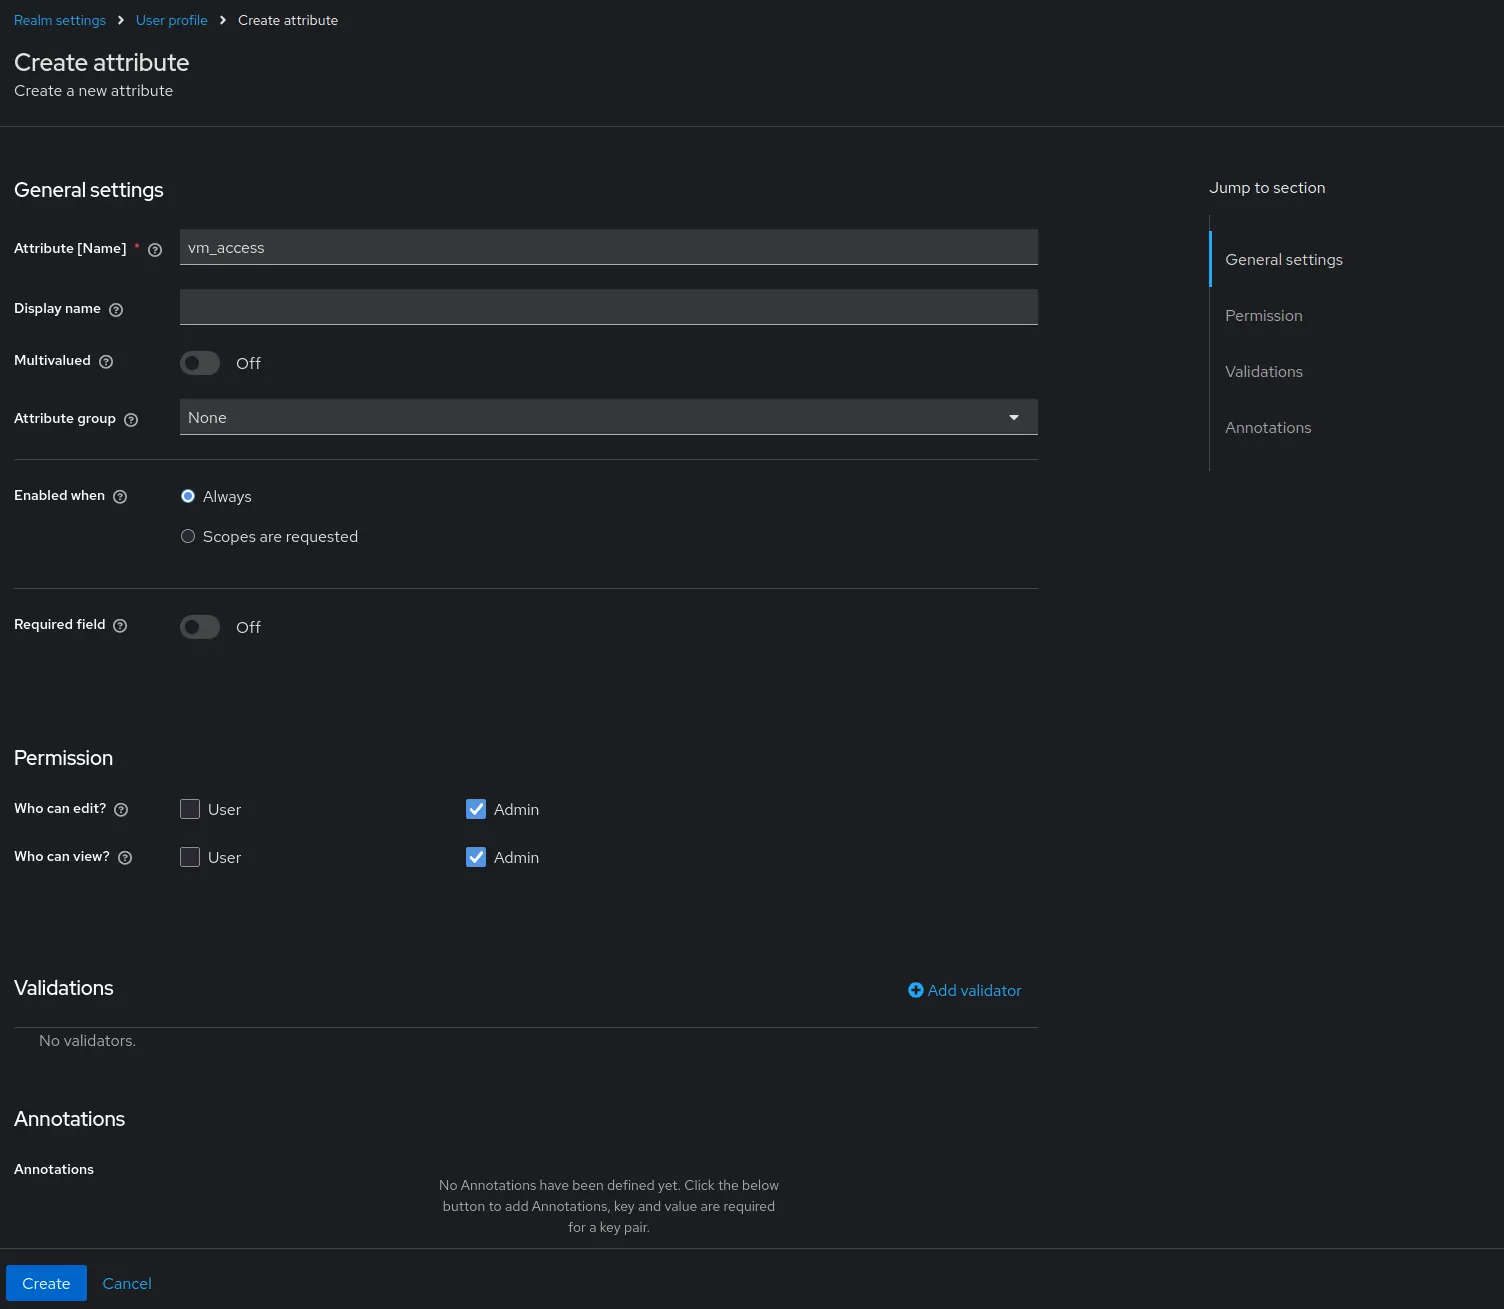 Click
Click Save.Go to
Users-> select user to configure.
Modify value ofvm_accessattribute.
For the purpose of this example, we will use 2 users:- for the first user we will specify
{"tenant_id" : {"account_id": 0, "project_id": 0 },"extra_labels":{ "team": "admin" }}asValue. - for the second user we will specify
{"tenant_id" : {"account_id": 0, "project_id": 1 },"extra_labels":{ "team": "dev" }}asValue.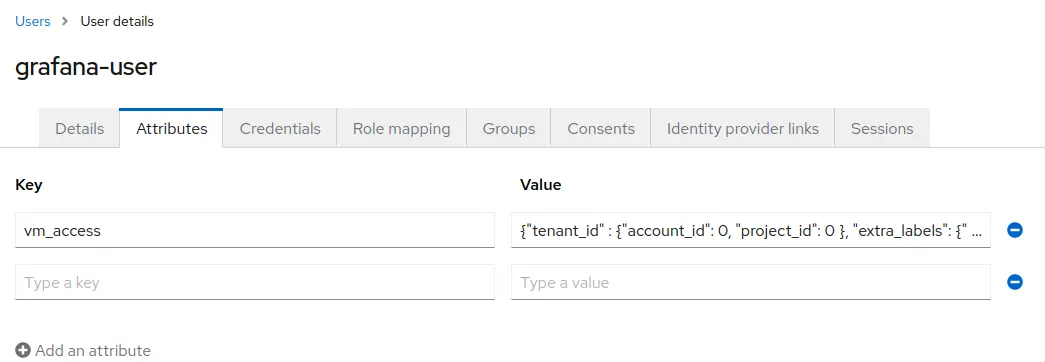 Click
Click Save.
- for the first user we will specify
Configure Grafana #
To forward JWT tokens, Grafana must be configured to use OpenID Connect authentication as follows:
      [auth.generic_oauth]
enabled = true
allow_sign_up = true
name = keycloak
client_id = {CLIENT_ID_FROM_IDENTITY_PROVIDER}
client_secret = {SECRET_FROM_IDENTITY_PROVIDER}
scopes = openid profile email
auth_url = http://localhost:3001/realms/{KEYCLOAK_REALM}/protocol/openid-connect/auth
token_url = http://localhost:3001/realms/{KEYCLOAK_REALM}/protocol/openid-connect/token
api_url = http://localhost:3001/realms/{KEYCLOAK_REALM}/protocol/openid-connect/userinfo
After restarting Grafana with the new config, you should be able to log in using your identity provider.
Start vmgateway #
Multi-tenant access for VictoriaMetrics cluster #
Now starting vmgateway with enabled authentication is as simple as adding the -enable.auth=true flag.
In order to enable multi-tenant access, you must also specify the -clusterMode=true flag.
      ./bin/vmgateway \
    -licenseFile=./vm-license.key
    -enable.auth=true \
    -clusterMode=true \
    -write.url=http://localhost:8480 \
    -read.url=http://localhost:8481
With this configuration, vmgateway will use the vm_access claim from the JWT token to restrict access to metrics.
For example, if the JWT token contains the following vm_access claim:
      {
  "vm_access": {
    "tenant_id": {
      "account_id": 0,
      "project_id": 0
    }
  }
}
Note: in case project_id is not specified, the default value 0 is used.
Then vmgateway will proxy the request to an endpoint with the following path:
http://localhost:8480/select/0:0/
This allows us to restrict access to specific tenants without having to create separate datasources in Grafana, or manually managing access at another proxy level.
Multi-tenant access for single-node VictoriaMetrics #
To use multi-tenant access with single-node VictoriaMetrics, you can use token claims such as extra_labels
or extra_filters filled dynamically by using the Identity Provider’s user information.
vmgateway uses those claims and
enhanced Prometheus querying API
to provide additional filtering capabilities.
For example, the following claims can be used to restrict user access to specific metrics:
      {
  "vm_access": {
    "extra_labels": {
      "team": "dev"
    },
    "extra_filters": ["{env=~\"aws|gcp\",cluster!=\"production\"}"]
  }
}
This will add the following query args to the proxied request:
extra_labels=team=devextra_filters={env=~"aws|gcp",cluster!="production"}
With this configuration, VictoriaMetrics will add the following filters to every query: {team="dev", env=~"aws|gcp", cluster!="production"}.
So when user will try to query vm_http_requests_total query will be transformed to vm_http_requests_total{team="dev", env=~"aws|gcp", cluster!="production"}.
Token signature verification #
It is also possible to enable
JWT token signature verification
at
vmgateway.
To do this by using the OpenID Connect discovery endpoint, you need to specify the -auth.oidcDiscoveryEndpoints flag. For example:
      ./bin/vmgateway \
    -licenseFile=./vm-license.key
    -enable.auth=true \
    -clusterMode=true \
    -write.url=http://localhost:8480 \
    -read.url=http://localhost:8481
    -auth.oidcDiscoveryEndpoints=http://localhost:3001/realms/master/.well-known/openid-configuration
Now vmgateway will print the following message on startup:
2023-03-13T14:45:31.552Z info VictoriaMetrics/app/vmgateway/main.go:154 using 2 keys for JWT token signature verification
That means that vmgateway has successfully fetched the public keys from the OpenID Connect discovery endpoint.
It is also possible to provide the public keys directly via the -auth.publicKeys flag. See the
vmgateway documentation
for details.
Use Grafana to query metrics #
Create a new Prometheus datasource in Grafana with the following URL http://<vmgateway>:8431.
URL should point to the vmgateway instance.
In the “Type and version” section, it is recommended to set the type to “Prometheus” and the version to at least “2.24.x”:
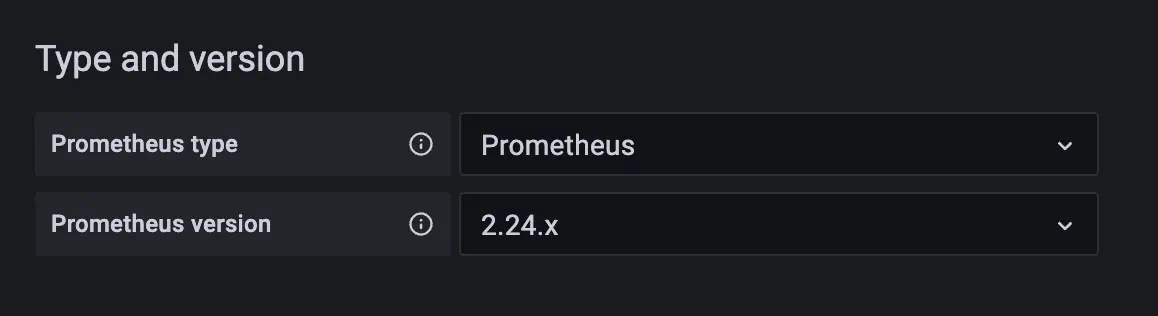
This allows Grafana to use a more efficient API to get label values.
You can also use VictoriaMetrics Grafana datasource plugin. See installation instructions here .
Enable Forward OAuth identity flag.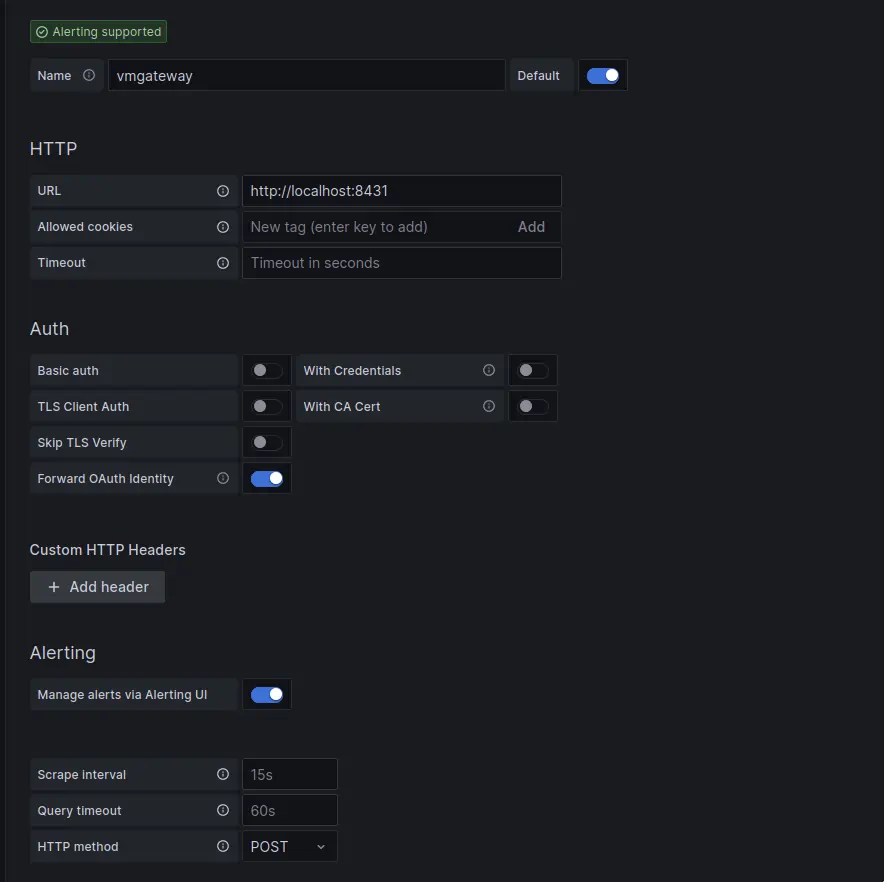
Now you can use Grafana to query metrics from the specified tenant.
Users with a vm_access claim will be able to query metrics from the specified tenant.
Test multi-tenant access #
For the test purpose, we will set up the following services as docker-compose manifest:
- Grafana
- Keycloak
- vmagent to generate test metrics
- VictoriaMetrics cluster
- vmgateway configured to work in cluster mode
- VictoriaMetrics single node
- vmgateway configured to work in single node mode
      version: '3'

services:
  keycloak:
    image: quay.io/keycloak/keycloak:26.1
    command:
      - start-dev
    ports:
      - 3001:8080
    environment:
      KC_BOOTSTRAP_ADMIN_USERNAME: admin
      KC_BOOTSTRAP_ADMIN_PASSWORD: change_me

  grafana:
    image: grafana/grafana:11.5.2
    network_mode: host
    volumes:
      - ./grafana.ini:/etc/grafana/grafana.ini
      - grafana_data:/var/lib/grafana/

  vmsingle:
    image: victoriametrics/victoria-metrics:v1.137.0
    command:
      - -httpListenAddr=0.0.0.0:8429

  vmstorage:
    image: victoriametrics/vmstorage:v1.137.0-cluster

  vminsert:
    image: victoriametrics/vminsert:v1.137.0-cluster
    command:
      - -storageNode=vmstorage:8400
      - -httpListenAddr=0.0.0.0:8480

  vmselect:
    image: victoriametrics/vmselect:v1.137.0-cluster
    command:
      - -storageNode=vmstorage:8401
      - -httpListenAddr=0.0.0.0:8481

  vmagent:
    image: victoriametrics/vmagent:v1.137.0
    volumes:
      - ./scrape.yaml:/etc/vmagent/config.yaml
    command:
      - -promscrape.config=/etc/vmagent/config.yaml
      - -remoteWrite.url=http://vminsert:8480/insert/0/prometheus/api/v1/write
      - -remoteWrite.url=http://vmsingle:8429/api/v1/write

  vmgateway-cluster:
    image: victoriametrics/vmgateway:v1.137.0-enterprise
    ports:
      - 8431:8431
    volumes:
      - ./vm-license.key:/opt/vm-license.key
    command:
      - -licenseFile=/opt/vm-license.key
      - -license.forceOffline=true
      - -enable.auth=true
      - -clusterMode=true
      - -write.url=http://vminsert:8480
      - -read.url=http://vmselect:8481
      - -httpListenAddr=0.0.0.0:8431
      - -auth.oidcDiscoveryEndpoints=http://keycloak:8080/realms/master/.well-known/openid-configuration

  vmgateway-single:
    image: victoriametrics/vmgateway:v1.137.0-enterprise
    ports:
      - 8432:8431
    volumes:
      - ./vm-license.key:/opt/vm-license.key
    command:
      - -licenseFile=/opt/vm-license.key
      - -enable.auth=true
      - -write.url=http://vmsingle:8429
      - -read.url=http://vmsingle:8429
      - -httpListenAddr=0.0.0.0:8431
      - -auth.oidcDiscoveryEndpoints=http://keycloak:8080/realms/master/.well-known/openid-configuration

volumes:
  grafana_data:
For the test purpose, vmagent will be configured to scrape metrics from the following targets(scrape.yaml contents):
      scrape_configs:
  - job_name: stat
    metric_relabel_configs:
      - if: "{instance =~ 'vmgateway.*'}"
        action: replace
        target_label: team
        replacement: admin
      - if: "{instance =~ 'localhost.*'}"
        action: replace
        target_label: team
        replacement: dev
    static_configs:
      - targets:
          - localhost:8429
          - vmgateway-single:8431
          - vmgateway-cluster:8431
Relabeling rules will add the team label to the scraped metrics in order to test multi-tenant access.
Metrics from localhost will be labeled with team=dev and metrics from vmgateway will be labeled with team=admin.
vmagent will write data into VictoriaMetrics single-node and cluster(with tenant 0:0).
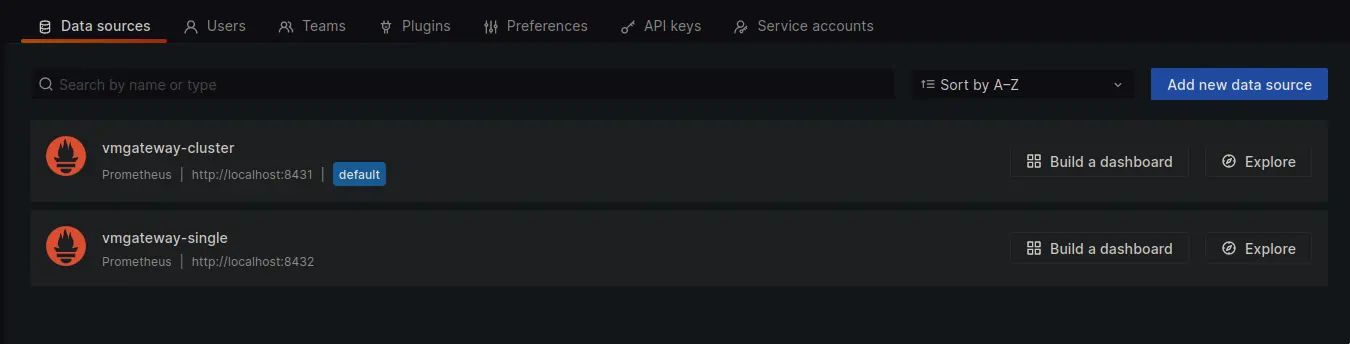
Grafana datasources configuration will be the following:
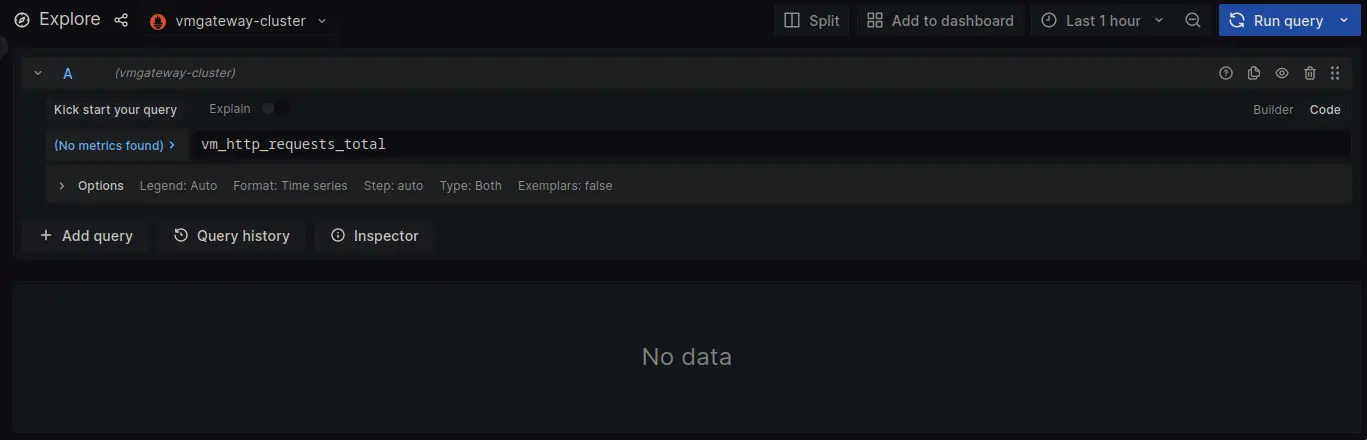
Let’s log in as a user with team=dev labels limitation set via claims.
Using vmgateway-cluster results in No data response as the proxied request will go to tenant 0:1.
Since vmagent is configured to write only to 0:0, the No data response is expected.
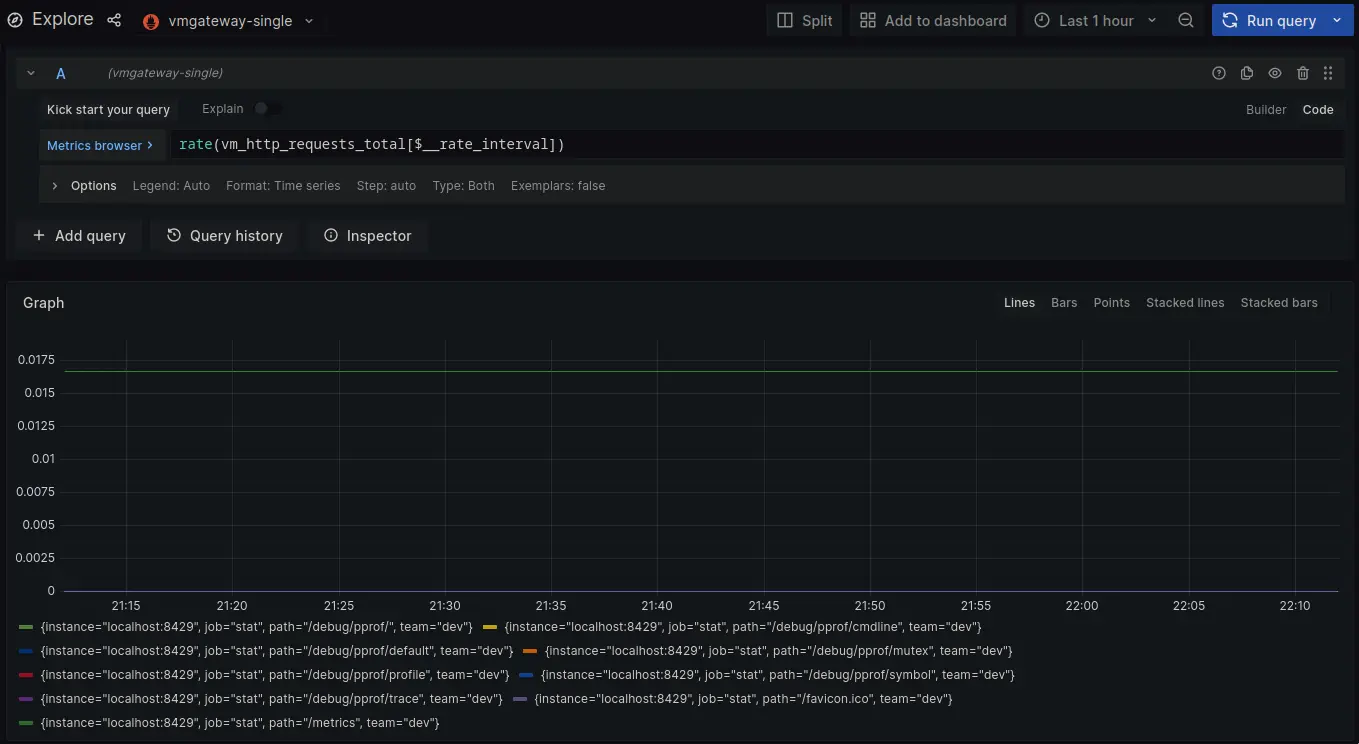
Switching to vmgateway-single does have data. Note that it is limited to metrics with the team=dev label.
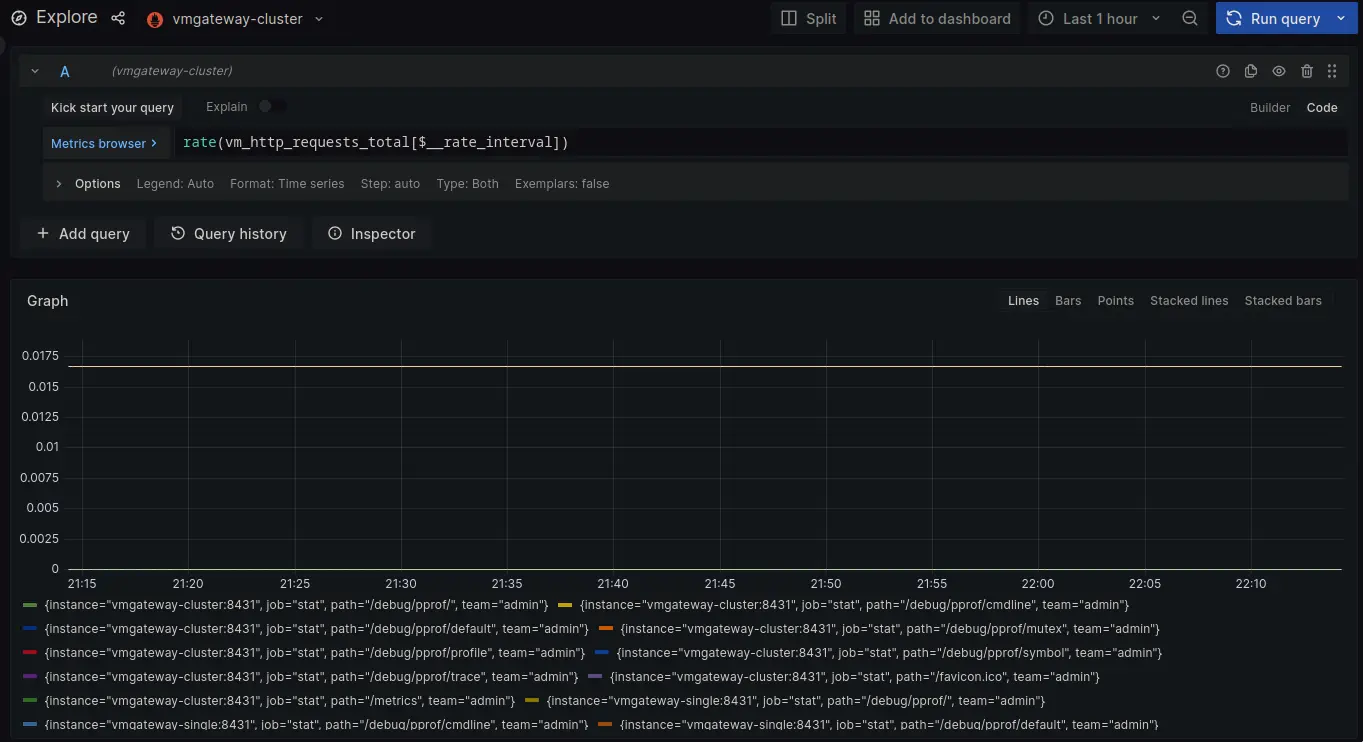
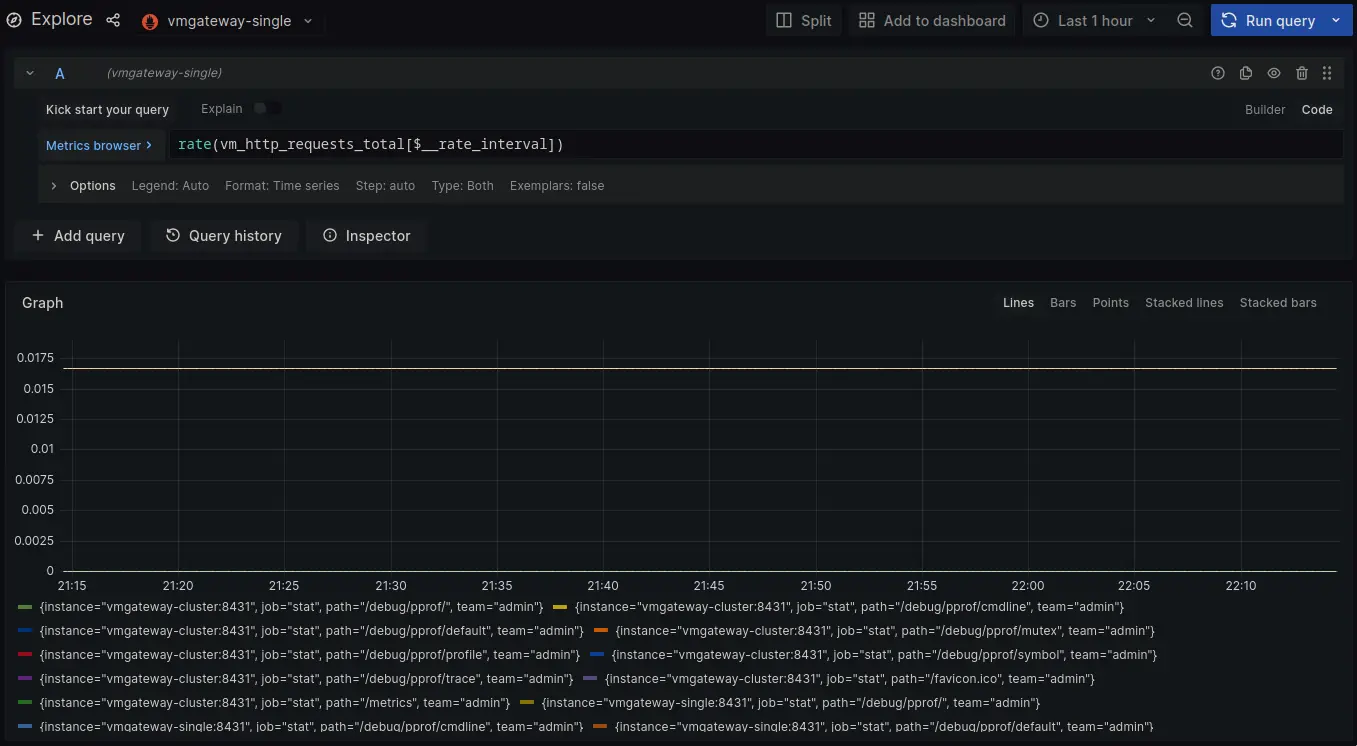
Now let’s log in as a user with team=admin.
Both cluster and single-node datasources now return metrics for team=admin.
Using OAuth for remote write with vmagent #
vmagent can be configured to use OAuth for remote write. This adds authentication to write requests.
In order to create a client for vmagent to use, follow the steps below:
Log in with admin credentials to your Keycloak instance
Go to
Clients->Create.
UseOpenID ConnectasClient Type.
SpecifyvmagentasClient ID.
ClickNext.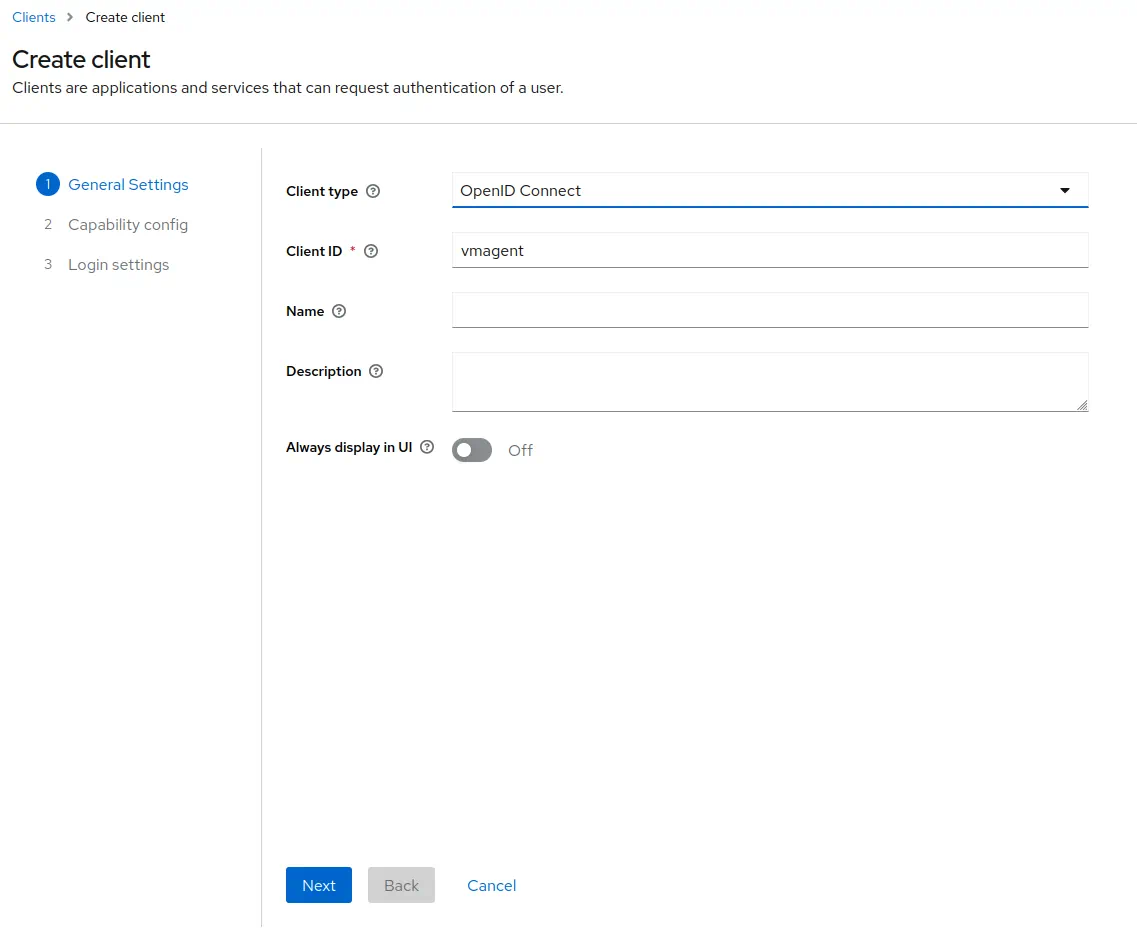
Enable
Client authentication.
EnableAuthorization.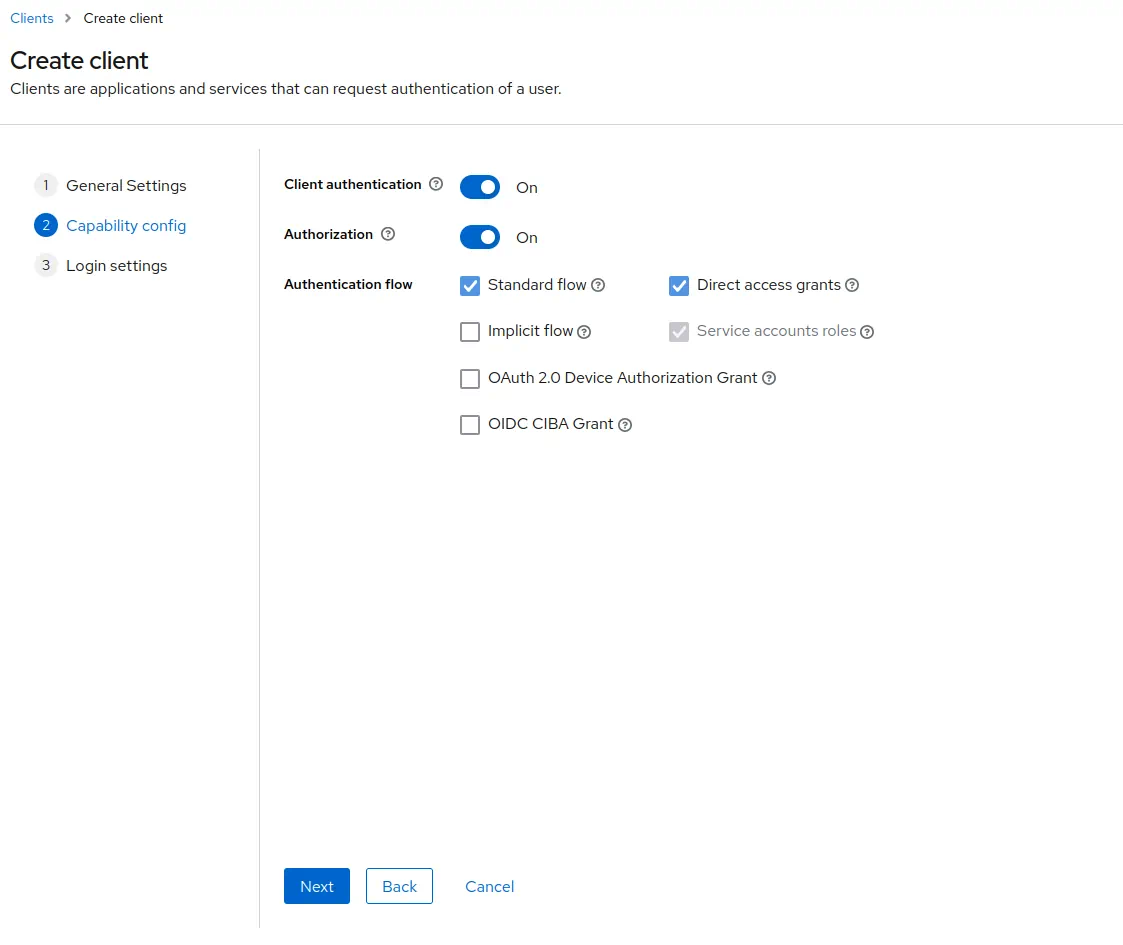 Click
Click Next.Leave the URLs section empty, as vmagent will not use any.
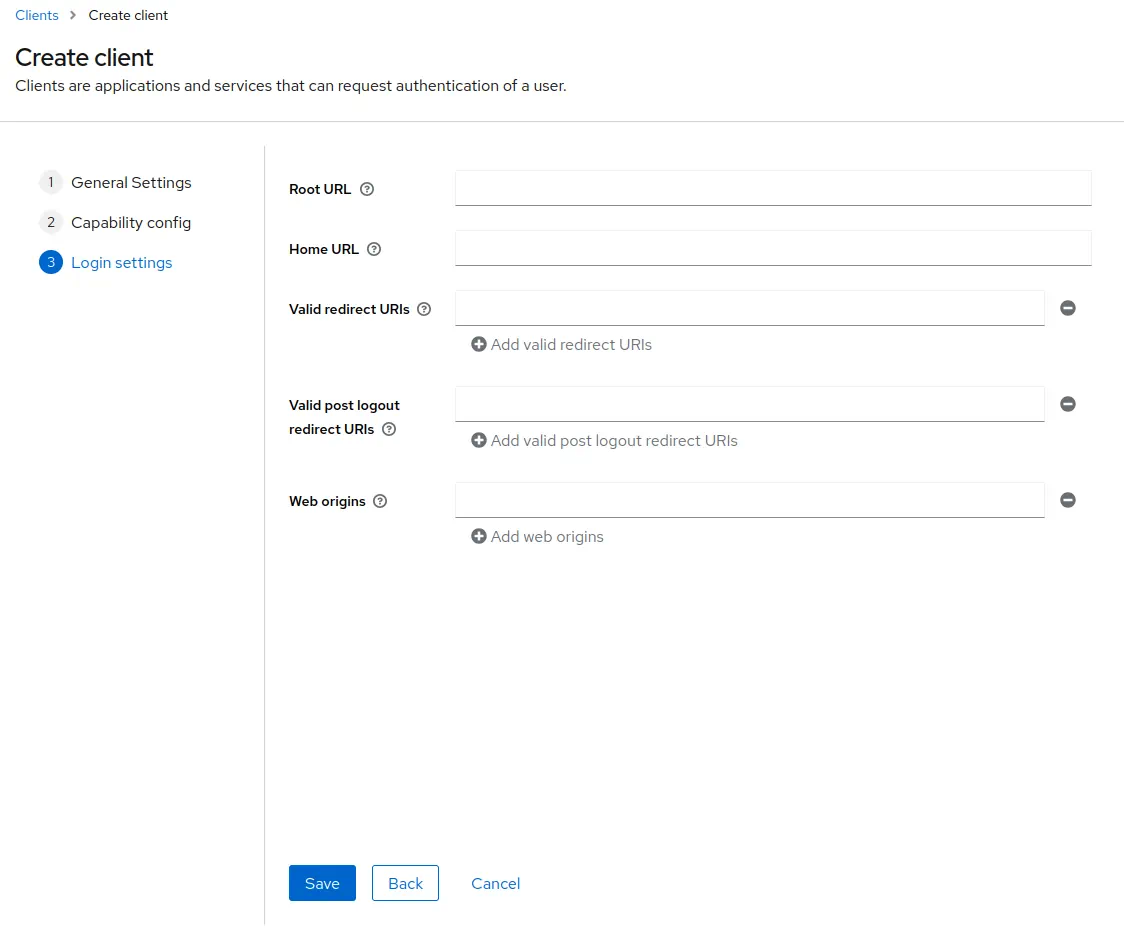 Click
Click Save.Go to
Clients->vmagent->Credentials.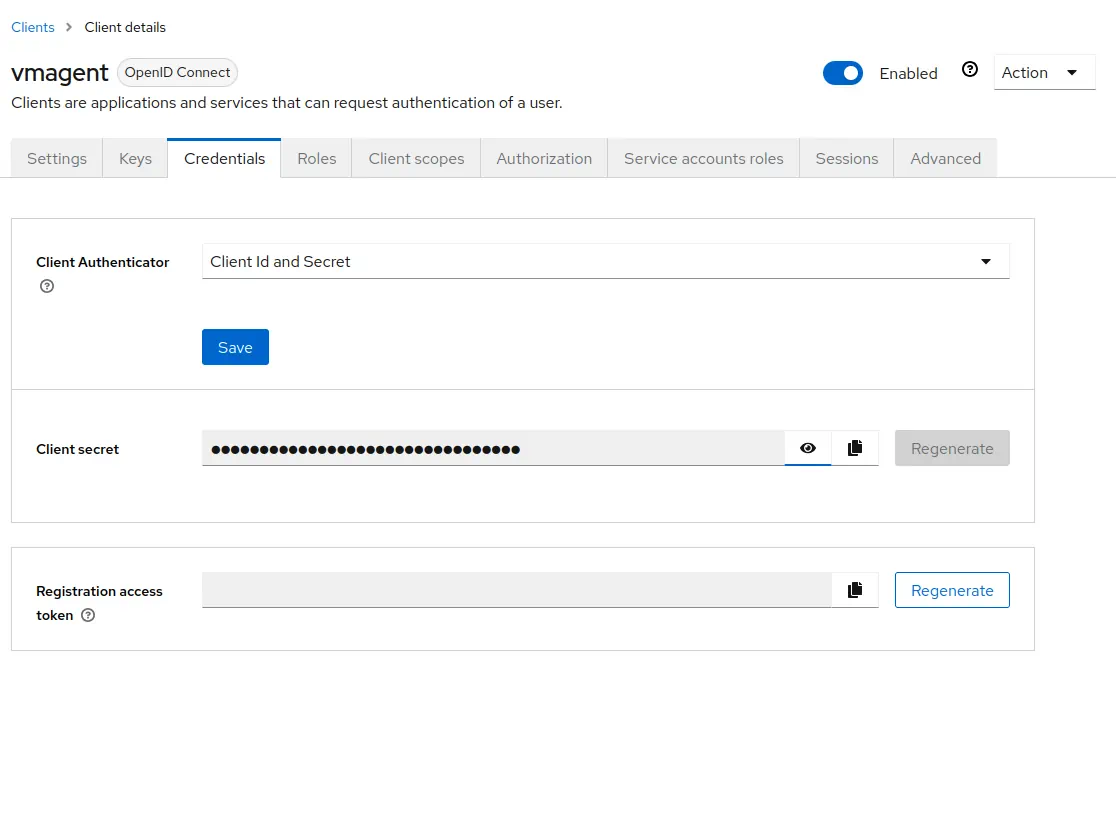 Copy the value of
 Client secret. It will be used later in vmagent configuration.Go to
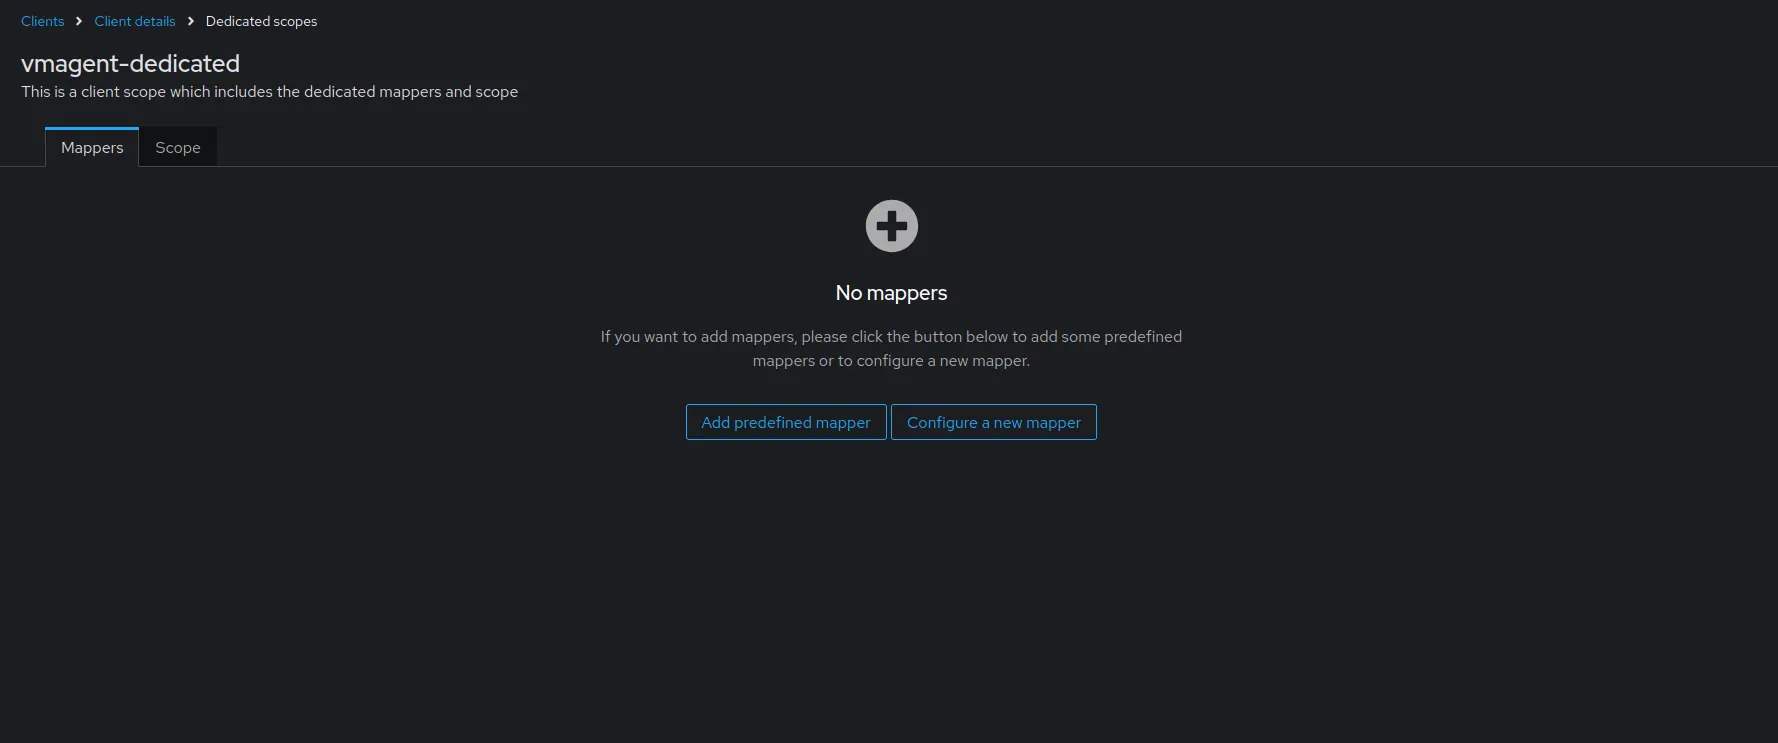
Clients->vmagent->Client scopes.
Click atvmagent-dedicated->Configure a new mapper->User attribute.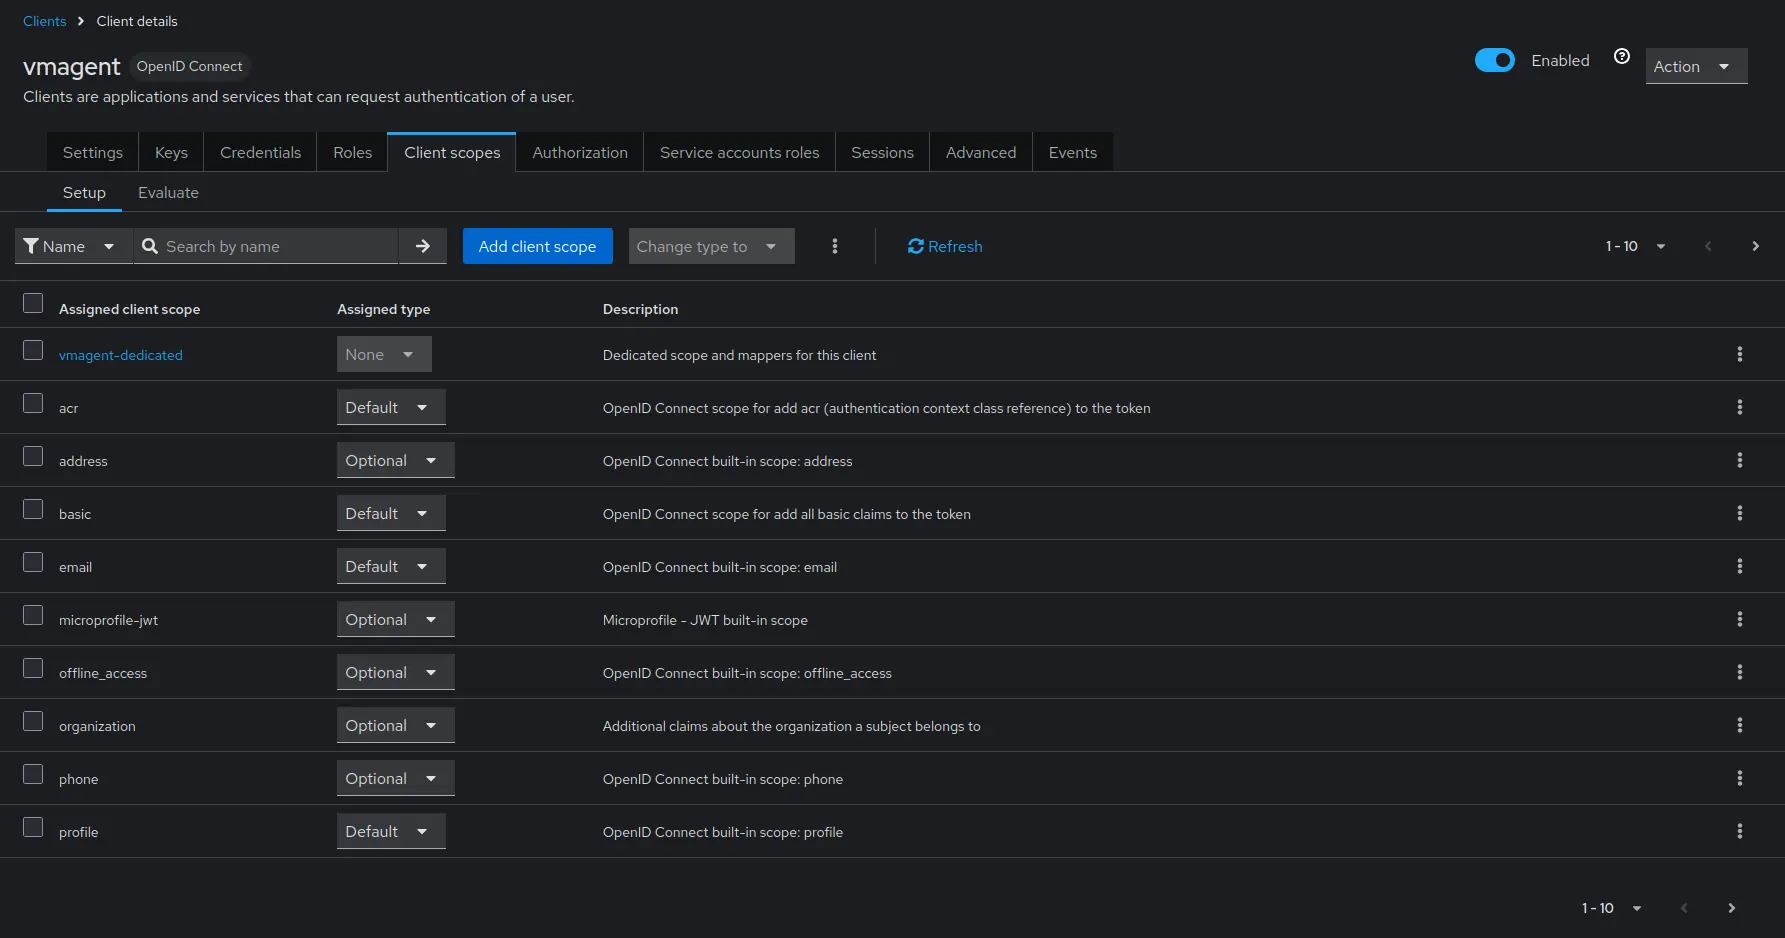
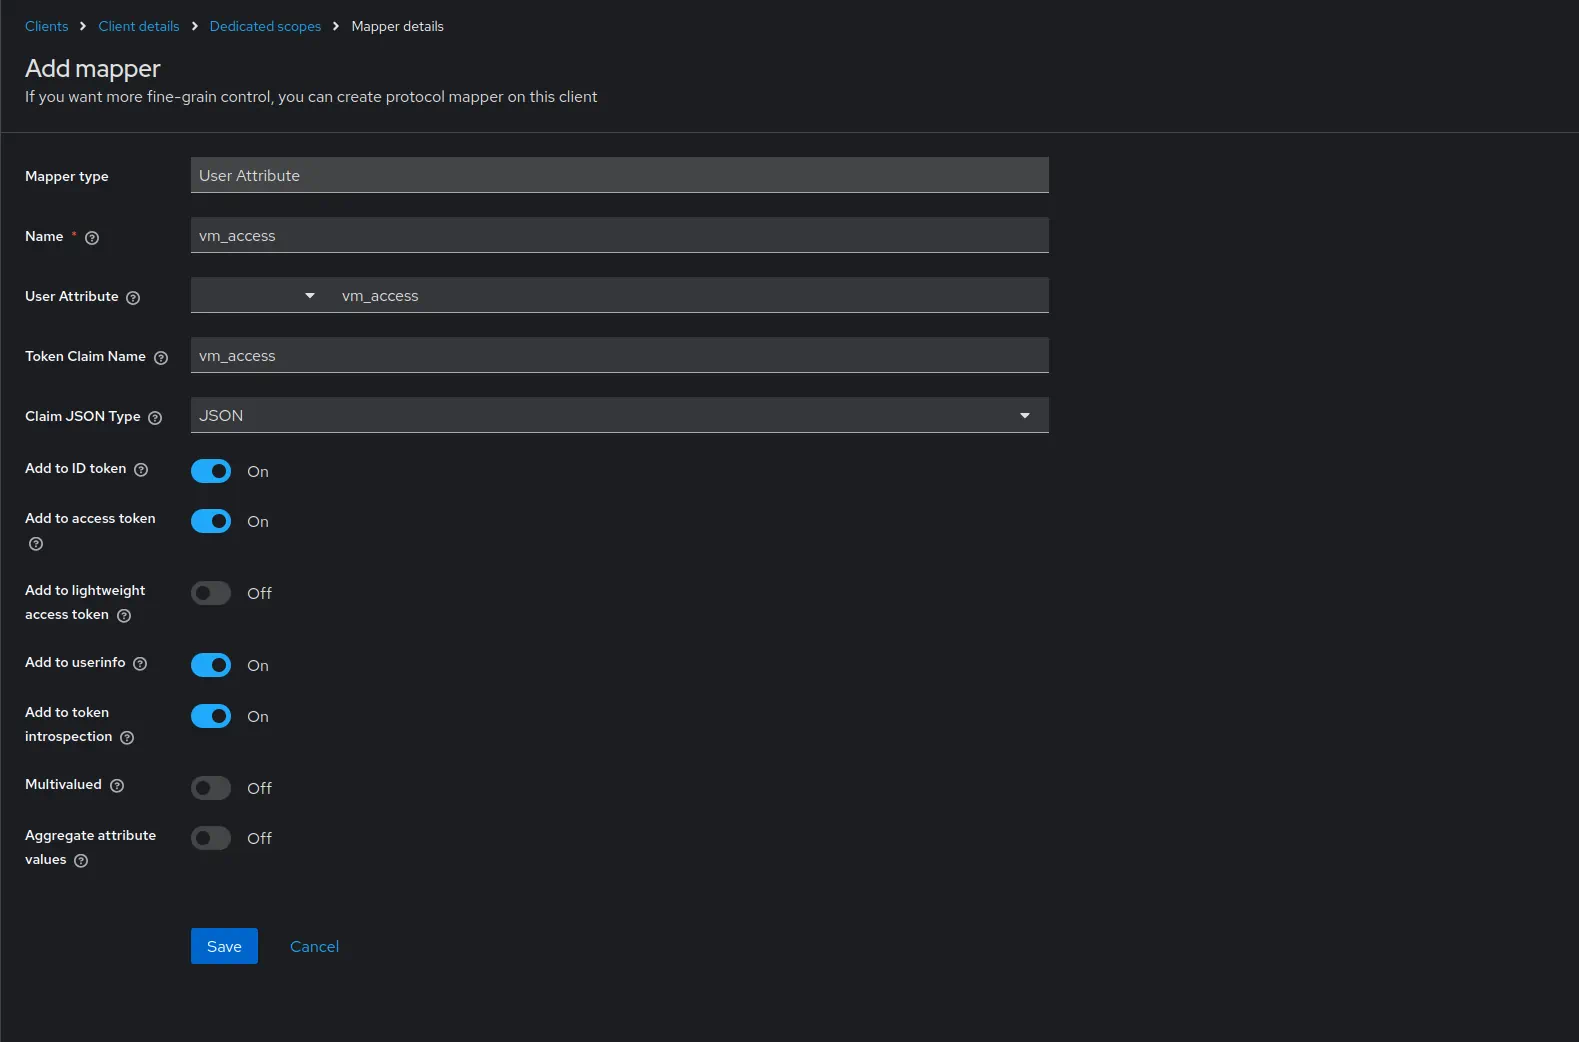
 Configure the mapper as follows
Nameasvm_access.Token Claim Nameasvm_access.User Attributeasvm_access.Claim JSON TypeasJSON. EnableAdd to ID tokenandAdd to access token.
 Click
Click Save.Go to
Service account roles-> click onservice-account-vmagent.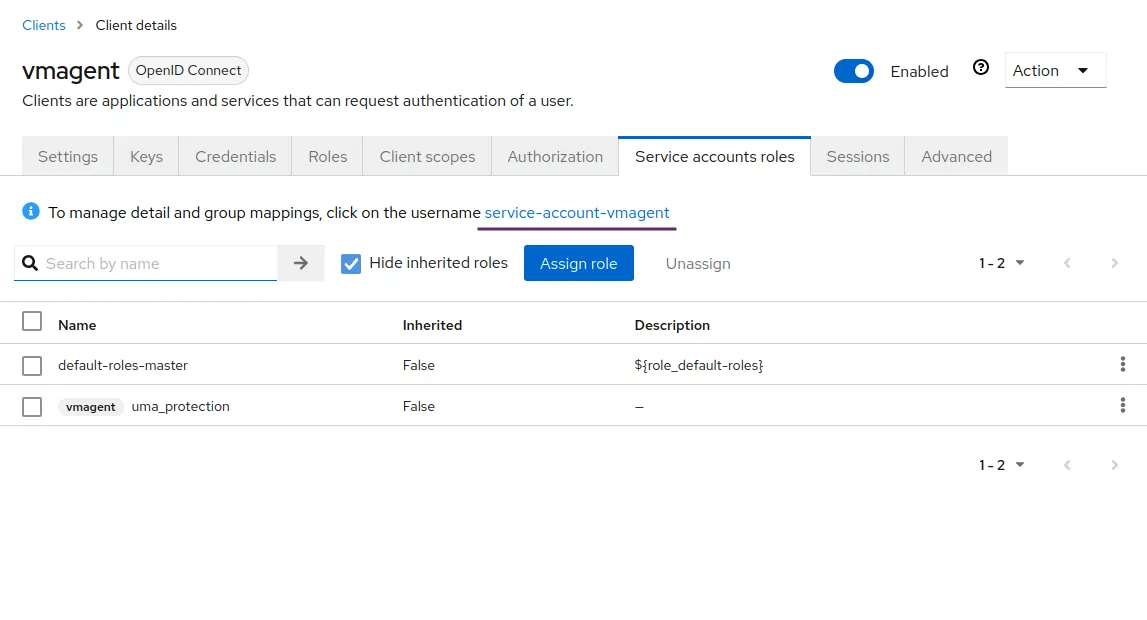
Go to the
Attributestab and add an attribute. Changevm_accessattribute value to{"tenant_id" : {"account_id": 0, "project_id": 0 }}.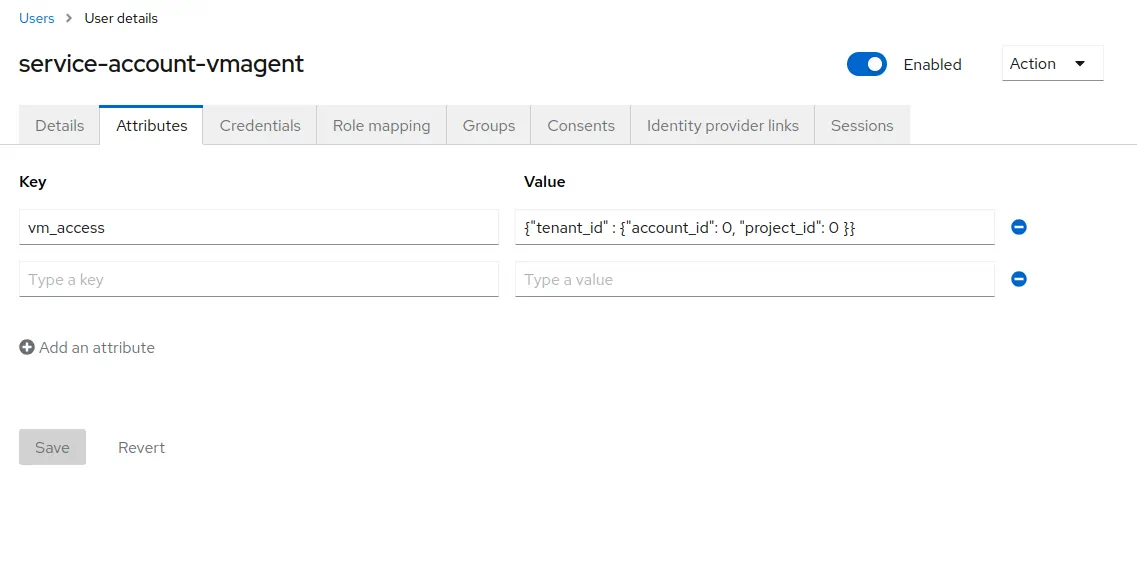 Click
Click Save.
Once the iDP configuration is done, the vmagent configuration needs to be updated to use OAuth for remote write:
        vmagent:
    image: victoriametrics/vmagent:v1.137.0
    volumes:
      - ./scrape.yaml:/etc/vmagent/config.yaml
      - ./vmagent-client-secret:/etc/vmagent/oauth2-client-secret
    command:
      - -promscrape.config=/etc/vmagent/config.yaml
      - -remoteWrite.url=http://vmgateway-cluster:8431/api/v1/write
      - -remoteWrite.url=http://vmgateway-single:8431/api/v1/write
      - -remoteWrite.oauth2.clientID={CLIENT_ID}
      - -remoteWrite.oauth2.clientSecretFile=/etc/vmagent/oauth2-client-secret
      - -remoteWrite.oauth2.tokenUrl=http://keycloak:8080/realms/master/protocol/openid-connect/token
      - -remoteWrite.oauth2.scopes=openid
It is required to replace {CLIENT_ID} with the client ID and provide the client secret in the vmagent-client-secret file.
Note that vmagent will use the same token for both single-node and cluster vmgateway. vmgateway running in cluster mode
will use the tenant information from the token to route the request to the correct tenant. vmgateway running in single-node mode
will just verify token validity.