Prerequisites:
- To use vmanomaly, part of the enterprise package, a license key is required. Obtain your key here for this tutorial or for enterprise use.
- In the tutorial, we’ll be using the following VictoriaMetrics components:
- VictoriaMetrics Single-Node (v1.148.0)
- vmalert (v1.148.0)
- vmagent (v1.148.0)
- Grafana (v12.2.0)
- Docker and Docker Compose
- Node exporter (v1.9.1) and Alertmanager (v0.28.1)
Configurations used throughout this guide can be found here
1. What is vmanomaly? #
VictoriaMetrics Anomaly Detection ( vmanomaly ) is a service that continuously scans time series stored in VictoriaMetrics and detects unexpected changes within data patterns in real-time. It does so by utilizing user-configurable machine learning models.
All the service parameters are defined in a config file.
Starting from
1.11.0
, each vmanomaly configuration file can support more that one model type, each attached to one (or more) schedulers. To utilize different models with different schedulers on your data, it is no longer necessary to run multiple instances of the vmanomaly process. Please refer to
model
and
scheduler
config sections for more details.
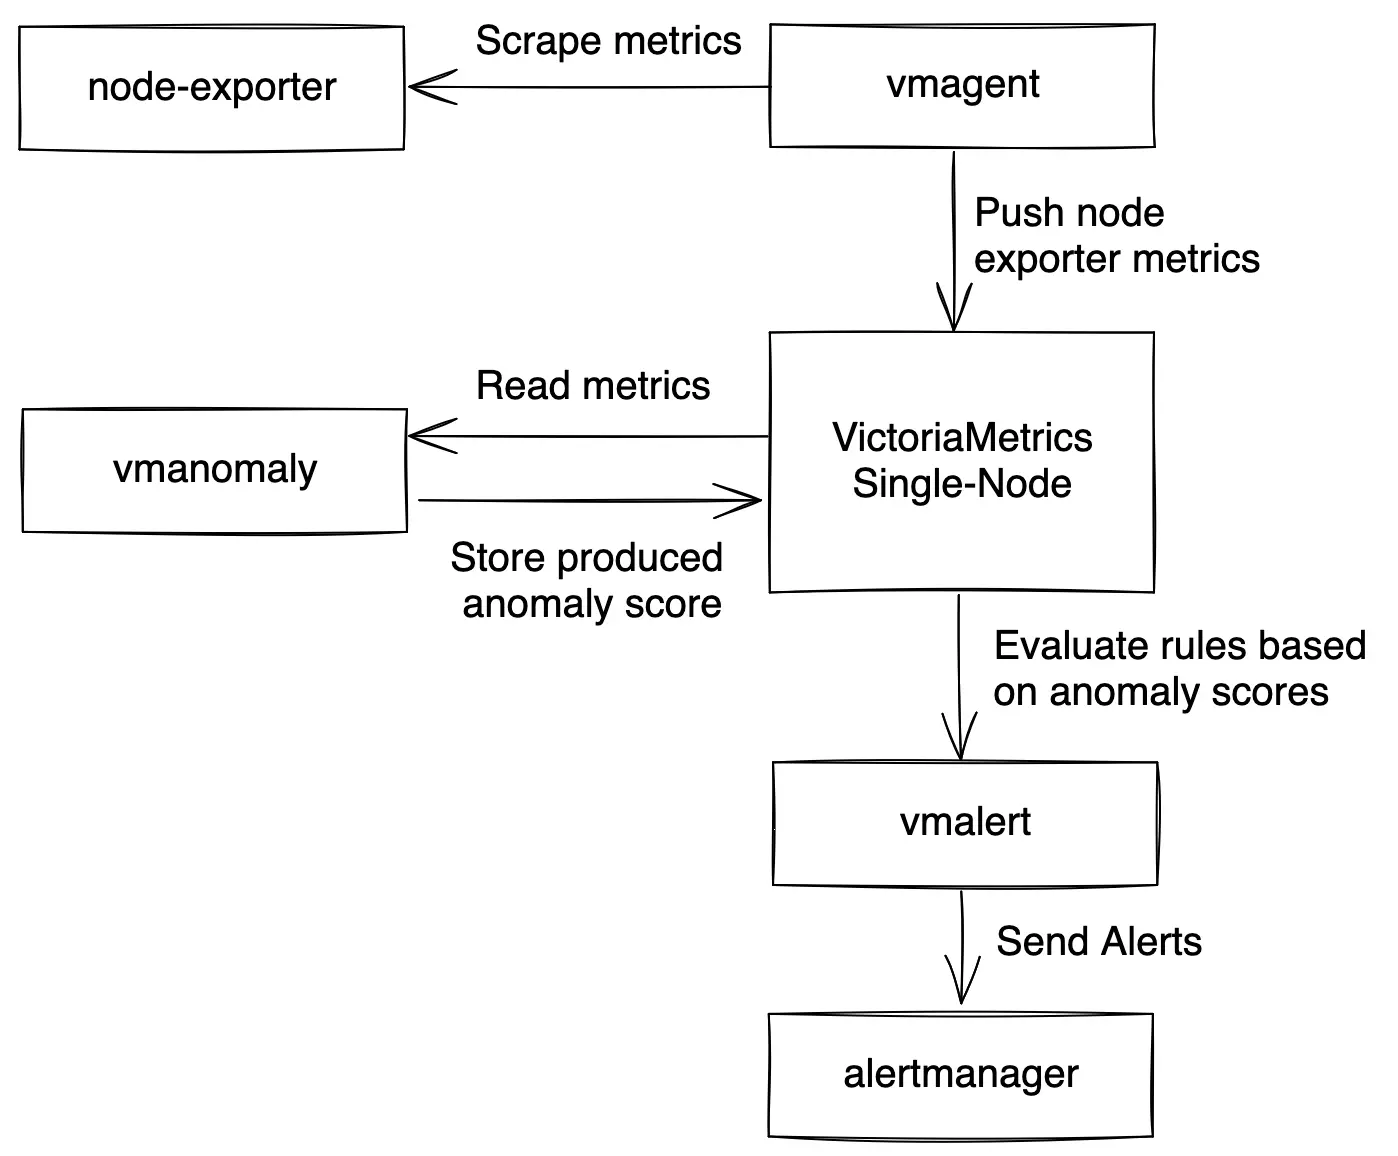
vmanomaly does the following:
- periodically queries user-specified metrics
- computes an anomaly score for them
- pushes back the computed anomaly score to VictoriaMetrics.
What is anomaly score? #
Anomaly score is a calculated non-negative (in interval [0, +inf)) numeric value. It takes into account how well data fit a predicted distribution, periodical patterns, trends, seasonality, etc.
The value is designed to:
- fall between 0 and 1 if model consider that datapoint is following usual pattern
- exceed 1 if the datapoint is abnormal
Then, users can enable alerting rules based on the anomaly score with vmalert .
2. What is vmalert? #
vmalert
is an alerting tool for VictoriaMetrics. It executes a list of the given alerting or recording rules against configured -datasource.url.
Alerting rules
allow you to define conditions that, when met, will notify the user. The alerting condition is defined in a form of a query expression via
MetricsQL query language
. For example, in our case, the expression anomaly_score > 1.0 will notify a user when the calculated anomaly score exceeds a threshold of 1.0.
3. How does vmanomaly works with vmalert? #
Compared to classical alerting rules, anomaly detection is more “hands-off” and data-aware. Instead of thinking of critical conditions to define, user can rely on catching anomalies that were not expected to happen. In other words, by setting up alerting rules, a user must know what to look for, ahead of time, while anomaly detection looks for any deviations from past behavior.
Practical use case is to put anomaly score generated by vmanomaly into alerting rules with some threshold.
In this tutorial we are going to:
- Configure docker-compose file with all needed services ( VictoriaMetrics Single-Node , vmalert , vmagent , Grafana , Node Exporter and vmanomaly ).
- Explore configuration files for vmanomaly and vmalert .
- Run our own VictoriaMetrics database with data scraped from Node Exporter .
- Explore data for analysis in Grafana .
- Explore
vmanomalyresults. - Explore
vmalertalerts
4. Data to analyze #
Let’s talk about data used for anomaly detection in this tutorial. We are going to collect our own CPU usage data with Node Exporter into the VictoriaMetrics database.
On a Node Exporter’s metrics page, part of the output looks like this:
      # HELP node_cpu_seconds_total Seconds the CPUs spent in each mode.
# TYPE node_cpu_seconds_total counter
node_cpu_seconds_total{cpu="0",mode="idle"} 94965.14
node_cpu_seconds_total{cpu="0",mode="iowait"} 51.25
node_cpu_seconds_total{cpu="0",mode="irq"} 0
node_cpu_seconds_total{cpu="0",mode="nice"} 0
node_cpu_seconds_total{cpu="0",mode="softirq"} 1682.18
node_cpu_seconds_total{cpu="0",mode="steal"} 0
node_cpu_seconds_total{cpu="0",mode="system"} 995.37
node_cpu_seconds_total{cpu="0",mode="user"} 12378.05
node_cpu_seconds_total{cpu="1",mode="idle"} 94386.53
node_cpu_seconds_total{cpu="1",mode="iowait"} 51.22
...
In this context, the metric node_cpu_seconds_total provides a comprehensive breakdown of the time each CPU core has spent in various operational modes. These modes include: user, system, iowait, idle, irq&softirq, guest, and steal. Each of these eight modes is mutually exclusive, offering distinct insights into CPU activity. For instance, a predominant iowait suggests disk or network bottlenecks, while elevated levels in user or system indicate significant CPU utilization.
The node_cpu_seconds_total metric is classified as a
counter
type. To analyze the duration each CPU core spends in these modes, it is necessary to compute the rate of change per second using the
rate function
: rate(node_cpu_seconds_total). For a more refined and smoother aggregation of data by mode, we apply the sum function. The resulting query is formulated as follows: sum(rate(node_cpu_seconds_total[5m])) by (mode, instance, job).
Below is an illustrative example of how this query might be visualized in Grafana:
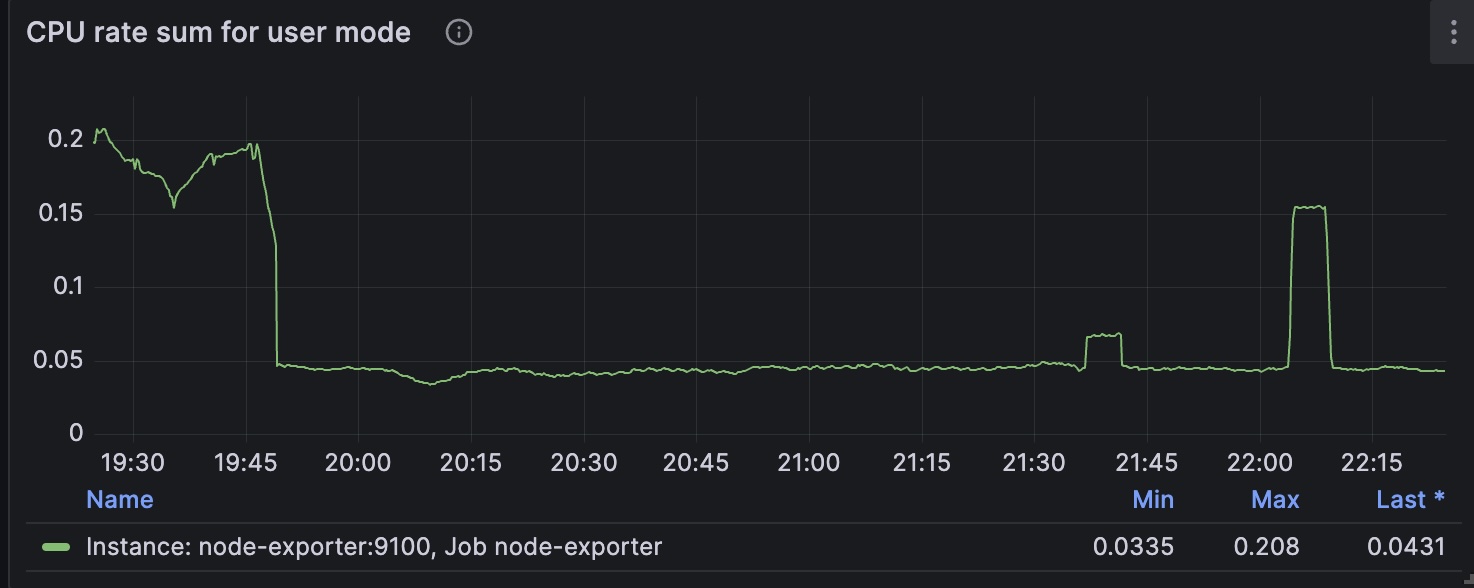
This query will yield a total of eight time series, each corresponding to a CPU mode. The number of series is unaffected by the number of CPU cores, due to the by aggregation applied. These series serve as the input for vmanomaly, where the service independently fits a separate instance of the configured model type to each of time series.
5. vmanomaly configuration and parameter description #
Parameter description:
The configuration file for vmanomaly comprises 4 essential sections:
scheduler- This section determines the frequency of model inferences and training, including the time range for model training. Starting from v1.11.0 , multiple individual schedulers are supported for each model type in a single config.models- Here, you define specific parameters and configurations for the models being used for anomaly detection. Starting from v1.10.0 , multiple model configurations are supported in a single config.reader- This section outlines the methodology for data reading, including the data source location.writer- Specifies the destination and method for writing the generated output.monitoring(optional) - Describes how to monitor and expose health check metrics ofvmanomaly.
Detailed parameters in each section:
schedulers( PeriodicScheduler is used here)infer_every- Specifies the frequency at which the trained models perform inferences on new data, essentially determining how often new anomaly score data points are generated. Format examples: 30s, 4m, 2h, 1d (time units: ’s’ for seconds, ’m’ for minutes, ‘h’ for hours, ’d’ for days). This parameter essentially asks, at regular intervals (e.g., every 1 minute), whether the latest data points appear abnormal based on historical data.fit_every- Sets the frequency for retraining the models. A higher frequency ensures more updated models but requires more CPU resources. If omitted, models are retrained in eachinfer_everycycle. Format is similar toinfer_every.fit_window- Defines the data interval for training the models. Longer intervals allow for capturing extensive historical behavior and better seasonal pattern detection but may slow down the model’s response to permanent metric changes and increase resource consumption. A minimum of two full seasonal cycles is recommended. Example format: 3h for three hours of data.
modelsclass- Specifies the model to be used. Options include custom models ( guide here ) or a selection from built-in models , such as the Facebook Prophet (model.prophet.ProphetModel).args- Model-specific parameters, formatted as a YAML dictionary in thekey: valuestructure. Parameters available in FB Prophet can be used as an example.
readerdatasource_url- The URL for the data source, typically an HTTP endpoint serving/api/v1/query_range.queries- MetricsQL (an extension of PromQL) expressions for anomaly detection. Multiple queries can be formatted as<QUERY_ALIAS>: "QUERY", where QUERY_ALIAS is used as a label in the generated metrics and anomaly scores.
writerdatasource_url- Specifies the endpoint for output data, typically an HTTP endpoint serving/api/v1/import.
Below is an illustrative example of a vmanomaly_config.yml configuration file.
      schedulers:
  periodic:
    infer_every: "1m"
    fit_every: "1h"
    fit_window: "2d" # 2d-14d based on the presence of weekly seasonality in your data

models:
  prophet:
    class: "prophet"
    args:
      interval_width: 0.98
      weekly_seasonality: False  # comment it if your data has weekly seasonality
      yearly_seasonality: False

reader:
  datasource_url: "http://victoriametrics:8428/"
  sampling_period: "60s"
  queries:
    node_cpu_rate:
      expr: "sum(rate(node_cpu_seconds_total[5m])) by (mode, instance, job)"

writer:
  datasource_url: "http://victoriametrics:8428/"


monitoring:
  pull: # Enable /metrics endpoint.
    addr: "0.0.0.0"
    port: 8490
6. vmanomaly output #
As the result of running vmanomaly, it produces the following metrics:
anomaly_score- the main one. Ideally, if it is between 0.0 and 1.0 it is considered to be a non-anomalous value. If it is greater than 1.0, it is considered an anomaly (but you can reconfigure that in alerting config, of course),yhat- predicted expected value,yhat_lower- predicted lower boundary,yhat_upper- predicted upper boundary,y- initial query result value.
Here is an example of how output metric will be written into VictoriaMetrics:
anomaly_score{for="node_cpu_rate", instance="node-exporter:9100", job="node-exporter", mode="idle"} 0.85
7. vmalert configuration #
Here we provide an example of the config for vmalert vmalert_config.yml.
      groups:
- name: AnomalyExample
  rules:
  - alert: HighAnomalyScore
    expr: 'anomaly_score > 1.0'
    labels:
      severity: warning
    annotations:
      summary: Anomaly Score exceeded 1.0. `sum(rate(node_cpu_seconds_total))` is showing abnormal behavior.
In the query expression expr, it’s crucial to establish a criterion based on the generated anomaly scores. Typically, an
anomaly score
ranging from 0.0 to 1.0 indicates that the analyzed value falls within normal behavior. Scores exceeding 1.0 signal increasing confidence from our model that the observed value is anomalous.
Selecting an appropriate threshold for the anomaly score depends on your specific requirements and the context of the data. One effective method for determining this threshold is through visual analysis. By plotting the anomaly_score metric in conjunction with the predicted ’expected’ range, delineated by yhat_lower and yhat_upper, you can make a more informed decision. Later in this tutorial, we will demonstrate this process with a practical example.
8. Docker Compose configuration #
You can find the docker-compose.yml and all configs in this folder
Now we are going to configure the docker-compose.yml file to run all needed services.
Here are all services we are going to run:
- vmanomaly - VictoriaMetrics Anomaly Detection service.
- victoriametrics - VictoriaMetrics Time Series Database
- vmagent - is an agent which helps you collect metrics from various sources, relabel and filter the collected metrics and store them in VictoriaMetrics or any other storage systems via Prometheus remote_write protocol.
- grafana - visualization tool.
- node-exporter - Prometheus Node Exporter exposes a wide variety of hardware- and kernel-related metrics.
- vmalert - VictoriaMetrics Alerting service.
- alertmanager - Notification services that handles alerts from vmalert.
Grafana setup #
Create a data source manifest #
In the provisioning/datasources/ directory, create a file called datasource.yml with the following content:
The default username/password pair is admin:admin
      apiVersion: 1

datasources:
    - name: VictoriaMetrics
      type: prometheus
      access: proxy
      url: http://victoriametrics:8428
      isDefault: true
      jsonData:
        prometheusType: Prometheus
        prometheusVersion: 2.24.0
Define a dashboard provider #
In the provisioning/dashboards/ directory, create a file called dashboard.yml with the following content:
      apiVersion: 1

providers:
- name: Prometheus
  orgId: 1
  folder: ''
  type: file
  options:
    path: /var/lib/grafana/dashboards
Scrape config #
Let’s create prometheus.yml file for vmagent configuration.
      global:
  scrape_interval: 10s

scrape_configs:
  - job_name: 'vmagent'
    static_configs:
      - targets: ['vmagent:8429']
  - job_name: 'vmalert'
    static_configs:
      - targets: ['vmalert:8880']
  - job_name: 'victoriametrics'
    static_configs:
      - targets: ['victoriametrics:8428']
  - job_name: 'node-exporter'
    static_configs:
      - targets: ['node-exporter:9100']
  - job_name: 'vmanomaly'
    static_configs:
      - targets: [ 'vmanomaly:8490' ]
vmanomaly licensing #
We will utilize the license key stored locally in the file vmanomaly_license.
For additional licensing options, please refer to the VictoriaMetrics Anomaly Detection documentation on licensing .
Alertmanager setup #
Let’s create alertmanager.yml file for alertmanager configuration.
      route:
  receiver: blackhole

receivers:
  - name: blackhole
Docker-compose #
Let’s wrap it all up together into the docker-compose.yml file.
      services:
  vmagent:
    container_name: vmagent
    image: victoriametrics/vmagent:v1.148.0
    depends_on:
      - "victoriametrics"
    ports:
      - 8429:8429
    volumes:
      - vmagentdata-guide-vmanomaly-vmalert:/vmagentdata
      - ./prometheus.yml:/etc/prometheus/prometheus.yml
    command:
      - "--promscrape.config=/etc/prometheus/prometheus.yml"
      - "--remoteWrite.url=http://victoriametrics:8428/api/v1/write"
    networks:
      - vm_net
    restart: always

  victoriametrics:
    container_name: victoriametrics
    image: victoriametrics/victoria-metrics:v1.148.0
    ports:
      - 8428:8428
    volumes:
      - vmdata-guide-vmanomaly-vmalert:/storage
    command:
      - "--storageDataPath=/storage"
      - "--httpListenAddr=:8428"
      - "--vmalert.proxyURL=http://vmalert:8880"
      - "-search.disableCache=1" # for guide only, do not use in production
    networks:
      - vm_net
    restart: always

  grafana:
    container_name: grafana
    image: grafana/grafana:12.2.0
    depends_on:
      - "victoriametrics"
    ports:
      - 3000:3000
    volumes:
      - grafanadata-guide-vmanomaly-vmalert:/var/lib/grafana
      - ./provisioning/datasources:/etc/grafana/provisioning/datasources
      - ./provisioning/dashboards:/etc/grafana/provisioning/dashboards
      - ./vmanomaly_guide_dashboard.json:/var/lib/grafana/dashboards/vmanomaly_guide_dashboard.json
    networks:
      - vm_net
    restart: always


  vmalert:
    container_name: vmalert
    image: victoriametrics/vmalert:v1.148.0
    depends_on:
      - "victoriametrics"
    ports:
      - 8880:8880
    volumes:
      - ./vmalert_config.yml:/etc/alerts/alerts.yml
    command:
      - "--datasource.url=http://victoriametrics:8428/"
      - "--remoteRead.url=http://victoriametrics:8428/"
      - "--remoteWrite.url=http://victoriametrics:8428/"
      - "--notifier.url=http://alertmanager:9093/"
      - "--rule=/etc/alerts/*.yml"
      # display source of alerts in grafana
      - "--external.url=http://127.0.0.1:3000" #grafana outside container
      # when copypaste the line be aware of '$$' for escaping in '$expr'
      - '--external.alert.source=explore?orgId=1&left=["now-1h","now","VictoriaMetrics",{"expr": },{"mode":"Metrics"},{"ui":[true,true,true,"none"]}]'
    networks:
      - vm_net
    restart: always
  vmanomaly:
    container_name: vmanomaly
    image: victoriametrics/vmanomaly:v1.29.7
    depends_on:
      - "victoriametrics"
    ports:
      - "8490:8490"
    networks:
      - vm_net
    restart: always
    volumes:
      - ./vmanomaly_config.yml:/config.yaml
      - ./vmanomaly_license:/license
    platform: "linux/amd64"
    command:
      - "/config.yaml"
      - "--licenseFile=/license"
  alertmanager:
    container_name: alertmanager
    image: prom/alertmanager:v0.28.1
    volumes:
      - ./alertmanager.yml:/config/alertmanager.yml
    command:
      - "--config.file=/config/alertmanager.yml"
    ports:
      - 9093:9093
    networks:
      - vm_net
    restart: always

  node-exporter:
    image: quay.io/prometheus/node-exporter:v1.9.1
    container_name: node-exporter
    ports:
      - 9100:9100
    pid: host
    restart: unless-stopped
    networks:
      - vm_net

volumes:
  vmagentdata-guide-vmanomaly-vmalert: {}
  vmdata-guide-vmanomaly-vmalert: {}
  grafanadata-guide-vmanomaly-vmalert: {}
networks:
  vm_net:
Before running our docker-compose make sure that your directory contains all required files:
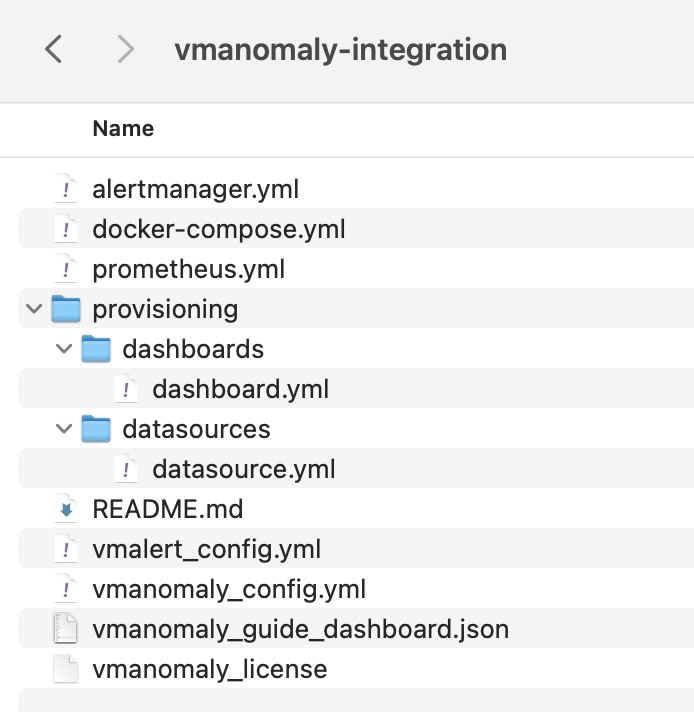
This docker-compose file will pull docker images, set up each service and run them all together with the command:
docker-compose up -d
To check if vmanomaly is up and running you can check docker logs:
docker logs vmanomaly -f
9. Model results #
To look at model results we need to go to grafana on the localhost:3000. Data
vmanomaly need some time to generate more data to visualize.
Let’s investigate model output visualization in Grafana.
On the Grafana Dashboard Vmanomaly Guide for each mode of CPU you can investigate:
- initial query result -
sum(rate(node_cpu_seconds_total[5m])) by (mode, instance, job) anomaly_scoreyhat- Predicted valueyhat_lower- Predicted lower boundaryyhat_upper- Predicted upper boundary
Each of these metrics will contain same labels our query sum(rate(node_cpu_seconds_total[5m])) by (mode, instance, job) returns.
Anomaly scores for each metric with its according labels. #
Query: anomaly_score
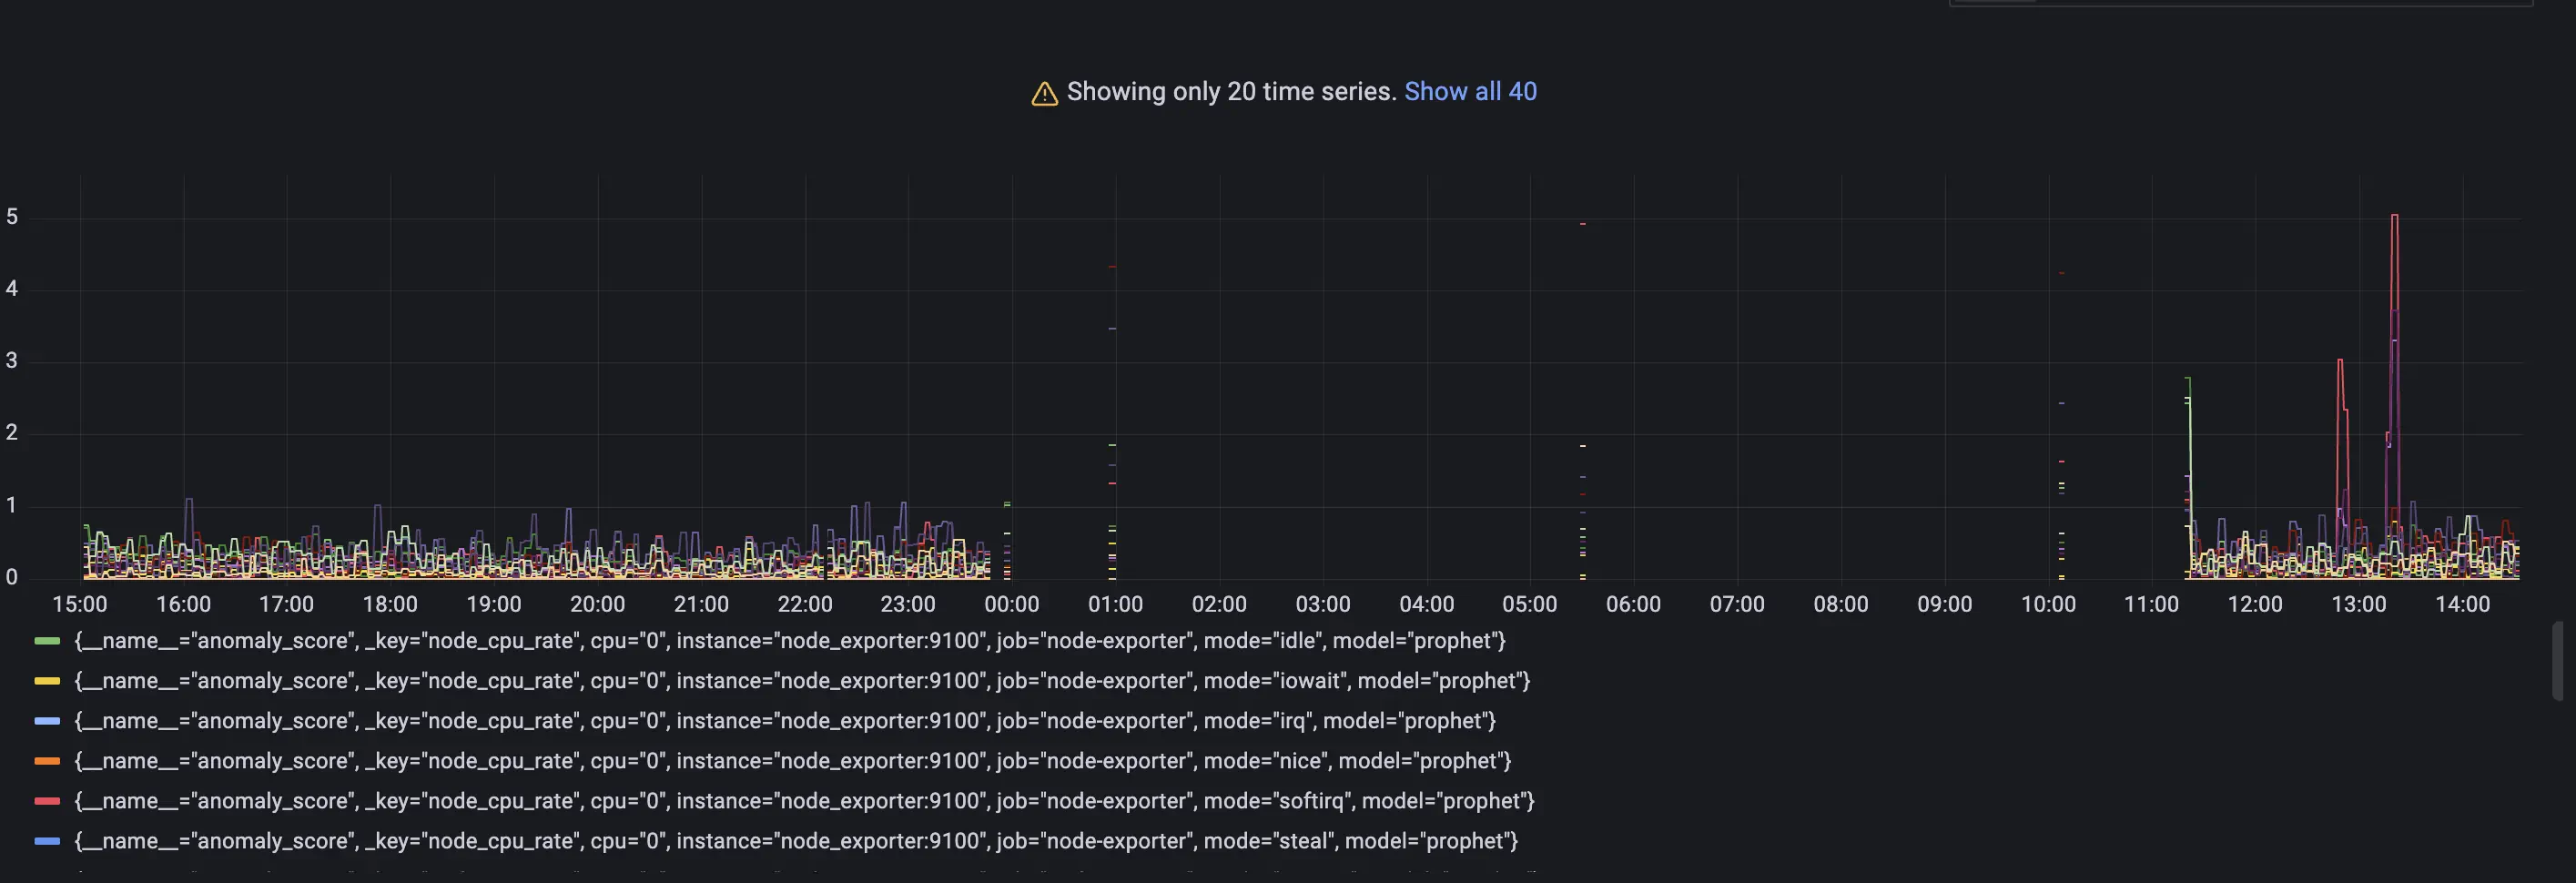
Check out if the anomaly score is high for datapoints you think are anomalies. If not, you can try other parameters in the config file or try other model type.
As you may notice a lot of data shows anomaly score greater than 1. It is expected as we just started to scrape and store data and there are not enough datapoints to train on. Just wait for some more time for gathering more data to see how well this particular model can find anomalies. In our configs we put 2 weeks of data needed to fit the model properly.
Lower and upper boundaries and predicted values. #
Queries: yhat_lower, yhat_upper and yhat
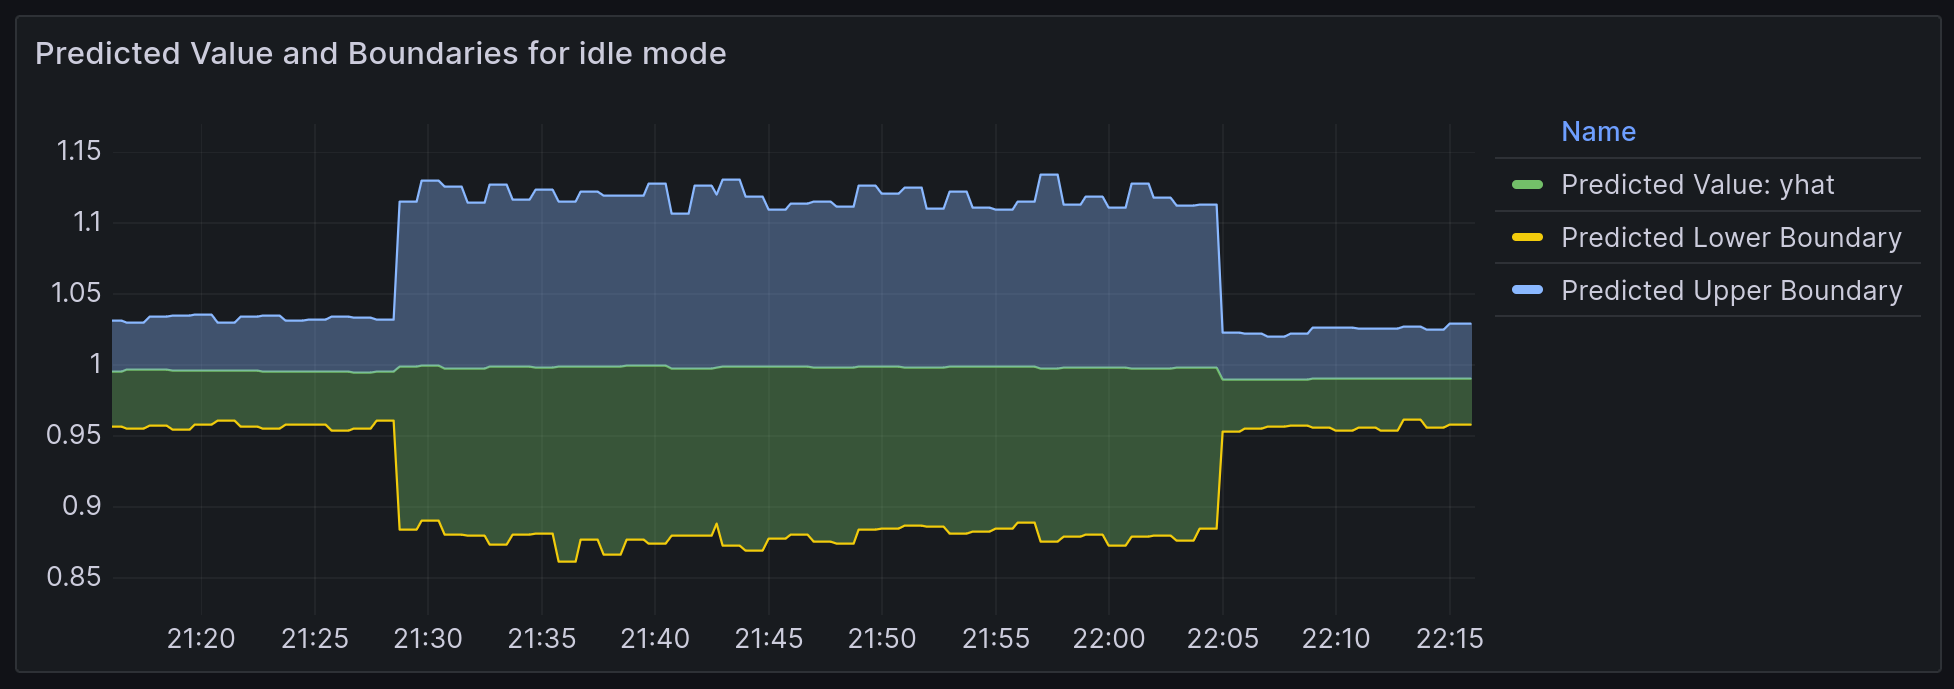
Boundaries of ’normal’ metric values according to model inference.
Alerting #
On the page http://localhost:8880/vmalert/groups you can find our configured Alerting rule:
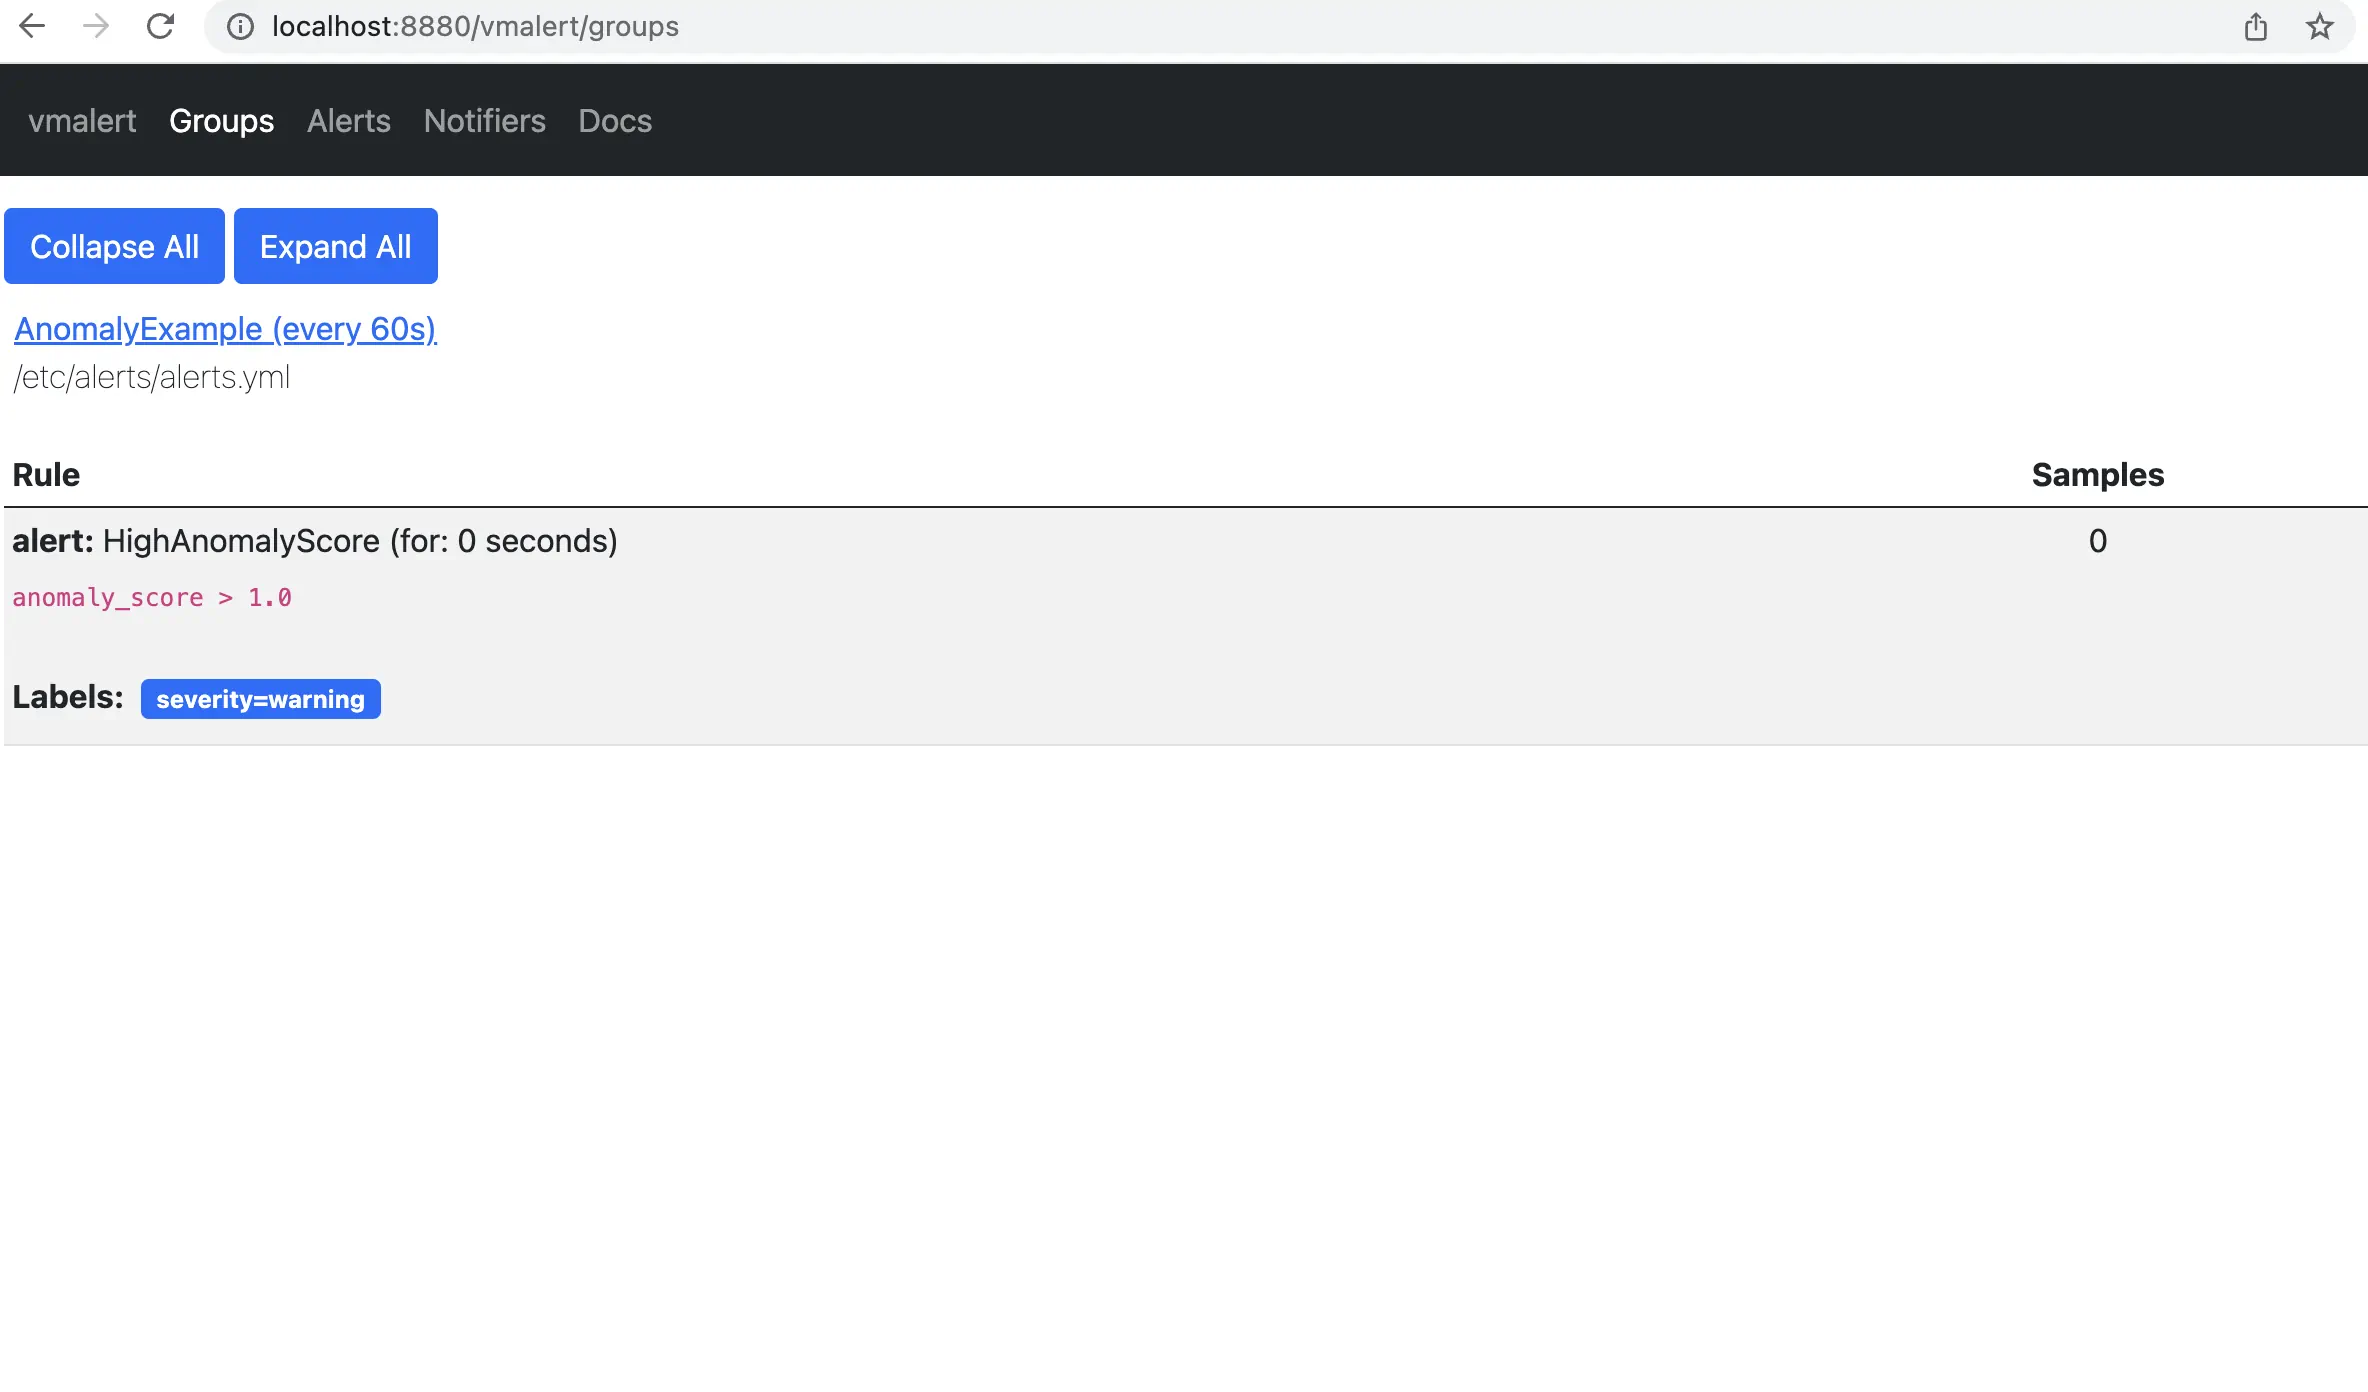
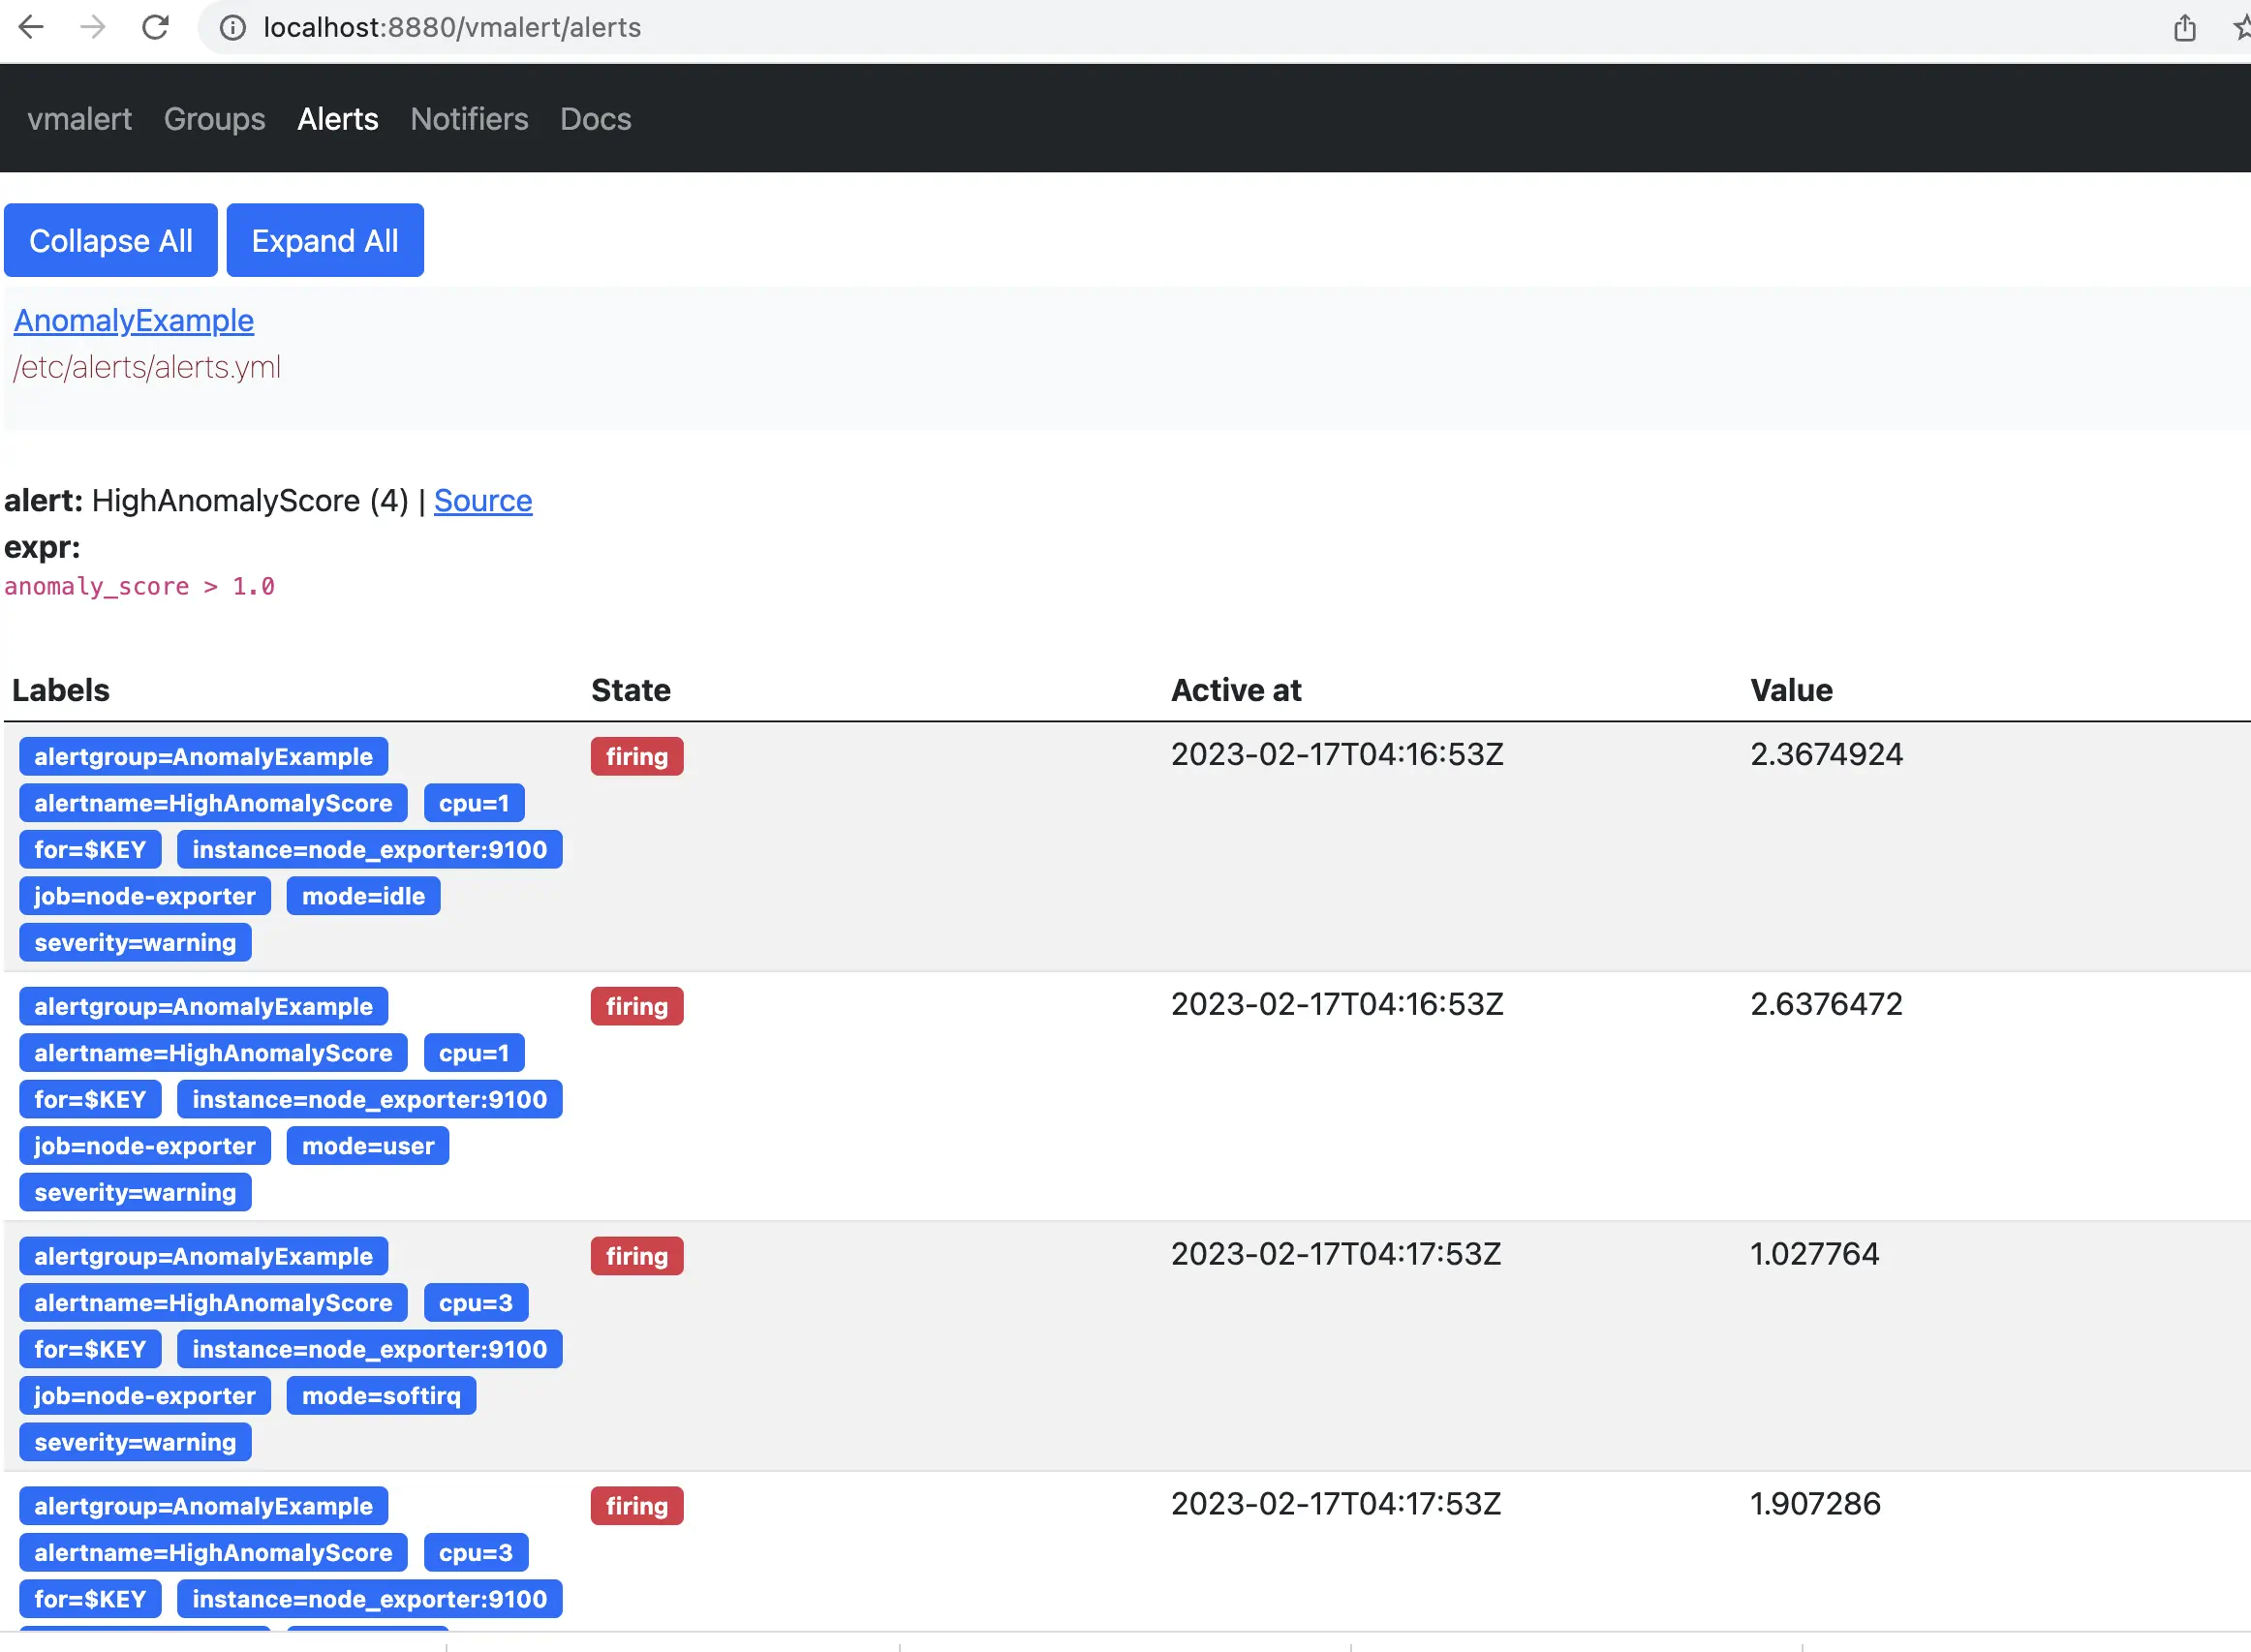
According to the rule configured for vmalert we will see Alert when anomaly score exceed 1. You will see an alert on Alert tab. http://localhost:8880/vmalert/alerts:
10. Conclusion #
We’ve explored the integration and practical application of VictoriaMetrics Anomaly Detection (vmanomaly) in conjunction with vmalert. This tutorial has taken you through the necessary prerequisites, setup, and configurations required for anomaly detection in time series data.
Key takeaways include:
Understanding vmanomaly and vmalert: We’ve discussed the functionalities of
vmanomalyandvmalert, highlighting how they work individually and in tandem to detect anomalies in time series data.Practical Configuration and Setup: By walking through the setup of a docker-compose environment, we’ve demonstrated how to configure and run VictoriaMetrics along with its associated services, including
vmanomalyandvmalert.Data Analysis and Monitoring: The guide provided insights on how to collect, analyze, and visualize data using Grafana, interpreting the anomaly scores and other metrics generated by
vmanomaly.Alert Configuration: We’ve shown how to set up and customize alerting rules in
vmalertbased on produced anomaly scores, enabling proactive monitoring and timely response to potential issues.
As you continue to use VictoriaMetrics Anomaly Detection and vmalert, remember that the effectiveness of anomaly detection largely depends on the appropriateness of the model chosen, the accuracy of configurations and the data patterns observed. This guide serves as a starting point, and we encourage you to experiment with different configurations and models to best suit your specific data needs and use cases. In case you need a helping hand - contact us
.