This guide walks you through deploying a VictoriaMetrics cluster version on Kubernetes in high-availability mode.
By the end of this guide, you will know:
- How to install and configure VictoriaMetrics cluster version using Helm.
- How high-availability mode works in VictoriaMetrics.
- How to scrape metrics from Kubernetes components using service discovery.
Overview #
In this guide, high availability is achieved by configuring
replication
on vminsert to a value of 2. This means every incoming data point is written twice to separate vmstorage pods, so data remains available as long as at least one replica of a given time series is reachable.
This setup requires twice as much storage as a normal, non-replicating cluster because vminsert fans out each write into two vmstorage pods.
Duplication causes vmselect to read back two copies of each sample, potentially skewing results. For example, in aggregations such as sum or count, this would double the result. To handle this, we must enable
de-duplication
in the vmselect pods to collapse the replicas into a single sample per scrape interval.
Preconditions #
We used a GKE cluster (v1.35) from GCP in this guide, but it can also be applied to any Kubernetes cluster. For example, Amazon EKS or an on-premises cluster.
1. VictoriaMetrics Helm repository #
Run the following command to add the VictoriaMetrics Helm repository:
      helm repo add vm https://victoriametrics.github.io/helm-charts/
helm repo update
Then, verify that VictoriaMetrics charts are available with:
helm search repo vm/
You should get a list of charts similar to this:
      NAME                                    CHART VERSION   APP VERSION     DESCRIPTION
vm/victoria-metrics-cluster             0.35.0          v1.136.0        VictoriaMetrics Cluster version - high-performa...
vm/victoria-metrics-agent               0.32.0          v1.136.0        VictoriaMetrics Agent - collects metrics from v...
vm/victoria-metrics-common              0.0.46                          VictoriaMetrics Common - contains shared templa...
...(list continues)...
2. Install VictoriaMetrics Cluster from the Helm chart #
A VictoriaMetrics cluster consists of three services:
vminsert: receives incoming metrics and distributes them across vmstorage nodes via consistent hashing on metric names and labels.vmstorage: stores raw data and serves queries filtered by time range and labels.vmselect: executes queries by fetching data across all configured vmstorage nodes.
Create a high-availability configuration file for the VictoriaMetrics services:
      cat <<EOF > victoria-metrics-cluster-values.yml
vmselect:
  extraArgs:
    dedup.minScrapeInterval: 1ms
    replicationFactor: 2
  podAnnotations:
    prometheus.io/scrape: "true"
    prometheus.io/port: "8481"
  replicaCount: 3

vminsert:
  extraArgs:
    replicationFactor: 2
  podAnnotations:
    prometheus.io/scrape: "true"
    prometheus.io/port: "8480"
  replicaCount: 3

vmstorage:
  podAnnotations:
    prometheus.io/scrape: "true"
    prometheus.io/port: "8482"
  replicaCount: 3
EOF
Let’s break down how high availability is achieved:
replicaCount: 3creates three replicas of vmselect, vminsert, and vmstorage each.replicationFactor: 2enables replication forvminsertandvmselect.vminsertusesreplicationFactorto fan out writes. In this case, it creates two copies of the sample and distributes them among distinctvmstoragepods.vmselectalso gets areplicationFactorso it knows how many replicas to expect and when to treat a response as partial (more on this later).
dedup.minScrapeInterval: 1ms configures de-duplication forvmselect, so it does not double-count samples when retrieving data fromvmstoragepods.podAnnotations: prometheus.io/scrape: "true"enables metric scraping so you can monitor your VictoriaMetrics cluster.podAnnotations: prometheus.io/port: "some_port"defines the scraping port.
Install the VictoriaMetrics cluster in high-availability mode. The following command deploys a VictoriaMetrics cluster in the default namespace:
helm install vmcluster vm/victoria-metrics-cluster -f victoria-metrics-cluster-values.yml
The expected output is:
      NAME: vmcluster
LAST DEPLOYED: Mon Mar  2 12:50:25 2026
NAMESPACE: default
STATUS: deployed
REVISION: 1
DESCRIPTION: Install complete
TEST SUITE: None
NOTES:
Write API:

The VictoriaMetrics write api can be accessed via port 8480 with the following DNS name from within your cluster:
vmcluster-victoria-metrics-cluster-vminsert.default.svc.cluster.local.

Get the Victoria Metrics insert service URL by running these commands in the same shell:
  export POD_NAME=$(kubectl get pods --namespace default -l "app=vminsert" -o jsonpath="{.items[0].metadata.name}")
  kubectl --namespace default port-forward $POD_NAME 8480

You need to update your Prometheus configuration file and add the following lines to it:

prometheus.yml

    remote_write:
      - url: "http://<insert-service>/insert/0/prometheus/"

for example -  inside the Kubernetes cluster:

    remote_write:
      - url: http://vmcluster-victoria-metrics-cluster-vminsert.default.svc.cluster.local:8480/insert/0/prometheus/
Read API:

The VictoriaMetrics read api can be accessed via port 8481 with the following DNS name from within your cluster:
vmcluster-victoria-metrics-cluster-vmselect.default.svc.cluster.local.

Get the VictoriaMetrics select service URL by running these commands in the same shell:
  export POD_NAME=$(kubectl get pods --namespace default -l "app=vmselect" -o jsonpath="{.items[0].metadata.name}")
  kubectl --namespace default port-forward $POD_NAME 8481

You need to specify the service URL in your Grafana:
 NOTE: you need to use the Prometheus Data Source

Input this URL field into Grafana

    http://<select-service>/select/0/prometheus/


for example - inside the Kubernetes cluster:

    http://vmcluster-victoria-metrics-cluster-vmselect.default.svc.cluster.local.:8481/select/0/prometheus/
Verify that the VictoriaMetrics cluster pods are up and running by executing the following command:
kubectl get pods -l app.kubernetes.io/instance=vmcluster
You should see:
      NAME                                                           READY   STATUS    RESTARTS   AGE
vmcluster-victoria-metrics-cluster-vminsert-788c76b69b-lphnn   1/1     Running   0          106s
vmcluster-victoria-metrics-cluster-vminsert-788c76b69b-lxg2w   1/1     Running   0          106s
vmcluster-victoria-metrics-cluster-vminsert-788c76b69b-qmtkp   1/1     Running   0          106s
vmcluster-victoria-metrics-cluster-vmselect-65796bc88d-29cwm   1/1     Running   0          106s
vmcluster-victoria-metrics-cluster-vmselect-65796bc88d-lz58p   1/1     Running   0          106s
vmcluster-victoria-metrics-cluster-vmselect-65796bc88d-t42pr   1/1     Running   0          106s
vmcluster-victoria-metrics-cluster-vmstorage-0                 1/1     Running   0          106s
vmcluster-victoria-metrics-cluster-vmstorage-1                 1/1     Running   0          91s
vmcluster-victoria-metrics-cluster-vmstorage-2                 1/1     Running   0          76s
3. Install vmagent from the Helm chart #
To scrape metrics from Kubernetes with a VictoriaMetrics Cluster, we need to install vmagent and configure it with additional settings.
Install vmagent with the following command:
helm install vmagent vm/victoria-metrics-agent -f https://docs.victoriametrics.com/guides/examples/guide-vmcluster-vmagent-values.yaml
You can obtain a copy of guide-vmcluster-vmagent-values.yaml to review with:
wget https://docs.victoriametrics.com/guides/examples/guide-vmcluster-vmagent-values.yaml
Here are the key settings in the chart file that we used to install vmagent with Helm earlier:
remoteWritedefines the vminsert endpoint that receives telemetry from vmagent. This value should match exactly the URL for theremote_writein the output of the VictoriaMetrics cluster installation in Step 2 .remoteWrite: - url: http://vmcluster-victoria-metrics-cluster-vminsert.default.svc.cluster.local:8480/insert/0/prometheus/metric_relabel_configsdefines label-rewriting rules for the scraped metrics.metric_relabel_configs: - action: replace source_labels: [pod] regex: '(.+)' target_label: pod_name replacement: '${1}' - action: replace source_labels: [container] regex: '(.+)' target_label: container_name replacement: '${1}' - action: replace target_label: name replacement: k8s_stub - action: replace source_labels: [id] regex: '^/system\.slice/(.+)\.service$' target_label: systemd_service_name replacement: '${1}'
Verify that vmagent’s pod is up and running by executing the following command:
kubectl get pod -l app.kubernetes.io/instance=vmagent
Expected output:
      NAME                                              READY   STATUS    RESTARTS   AGE
vmagent-victoria-metrics-agent-6848c6b58d-87rf6   1/1     Running   0          32s
4. Verifying HA of VictoriaMetrics Cluster #
Run the following command to check that VictoriaMetrics services are up and running:
kubectl get svc -l app.kubernetes.io/instance=vmcluster
The expected output is:
      NAME                                           TYPE        CLUSTER-IP      EXTERNAL-IP   PORT(S)                      AGE
vmcluster-victoria-metrics-cluster-vminsert    ClusterIP   10.43.157.170   <none>        8480/TCP                     4m41s
vmcluster-victoria-metrics-cluster-vmselect    ClusterIP   10.43.222.181   <none>        8481/TCP                     4m41s
vmcluster-victoria-metrics-cluster-vmstorage   ClusterIP   None            <none>        8482/TCP,8401/TCP,8400/TCP   4m41s
To verify that metrics are present in VictoriaMetrics, you can send a curl request to the vmselect service. Run the following command to make vmselect’s port accessible from the local machine:
kubectl port-forward svc/vmcluster-victoria-metrics-cluster-vmselect 8481:8481
Execute the following command to get metrics via curl:
curl -sg 'http://127.0.0.1:8481/select/0/prometheus/api/v1/query?query=count(up{kubernetes_pod_name=~".*vmselect.*"})' | jq
Let’s break down the command:
- The request to
http://127.0.0.1:8481/select/0/prometheus/api/v1/query?queryuses the VictoriaMetrics querying API to fetch metric data - The argument
query=count(up{kubernetes_pod_name=~".*vmselect.*"})specifies the query. Specifically, we want to count the number ofvmselectpods. - We pipe the output to
jqto format the output in a more readable way.
You should see:
      {
  "status": "success",
  "isPartial": false,
  "data": {
    "resultType": "vector",
    "result": [
      {
        "metric": {},
        "value": [
          1773419630,
          "3"
        ]
      }
    ]
  },
  "stats": {
    "seriesFetched": "3",
    "executionTimeMsec": 3
  }
}
The value should be 3, which is the number of replicas we configured earlier.
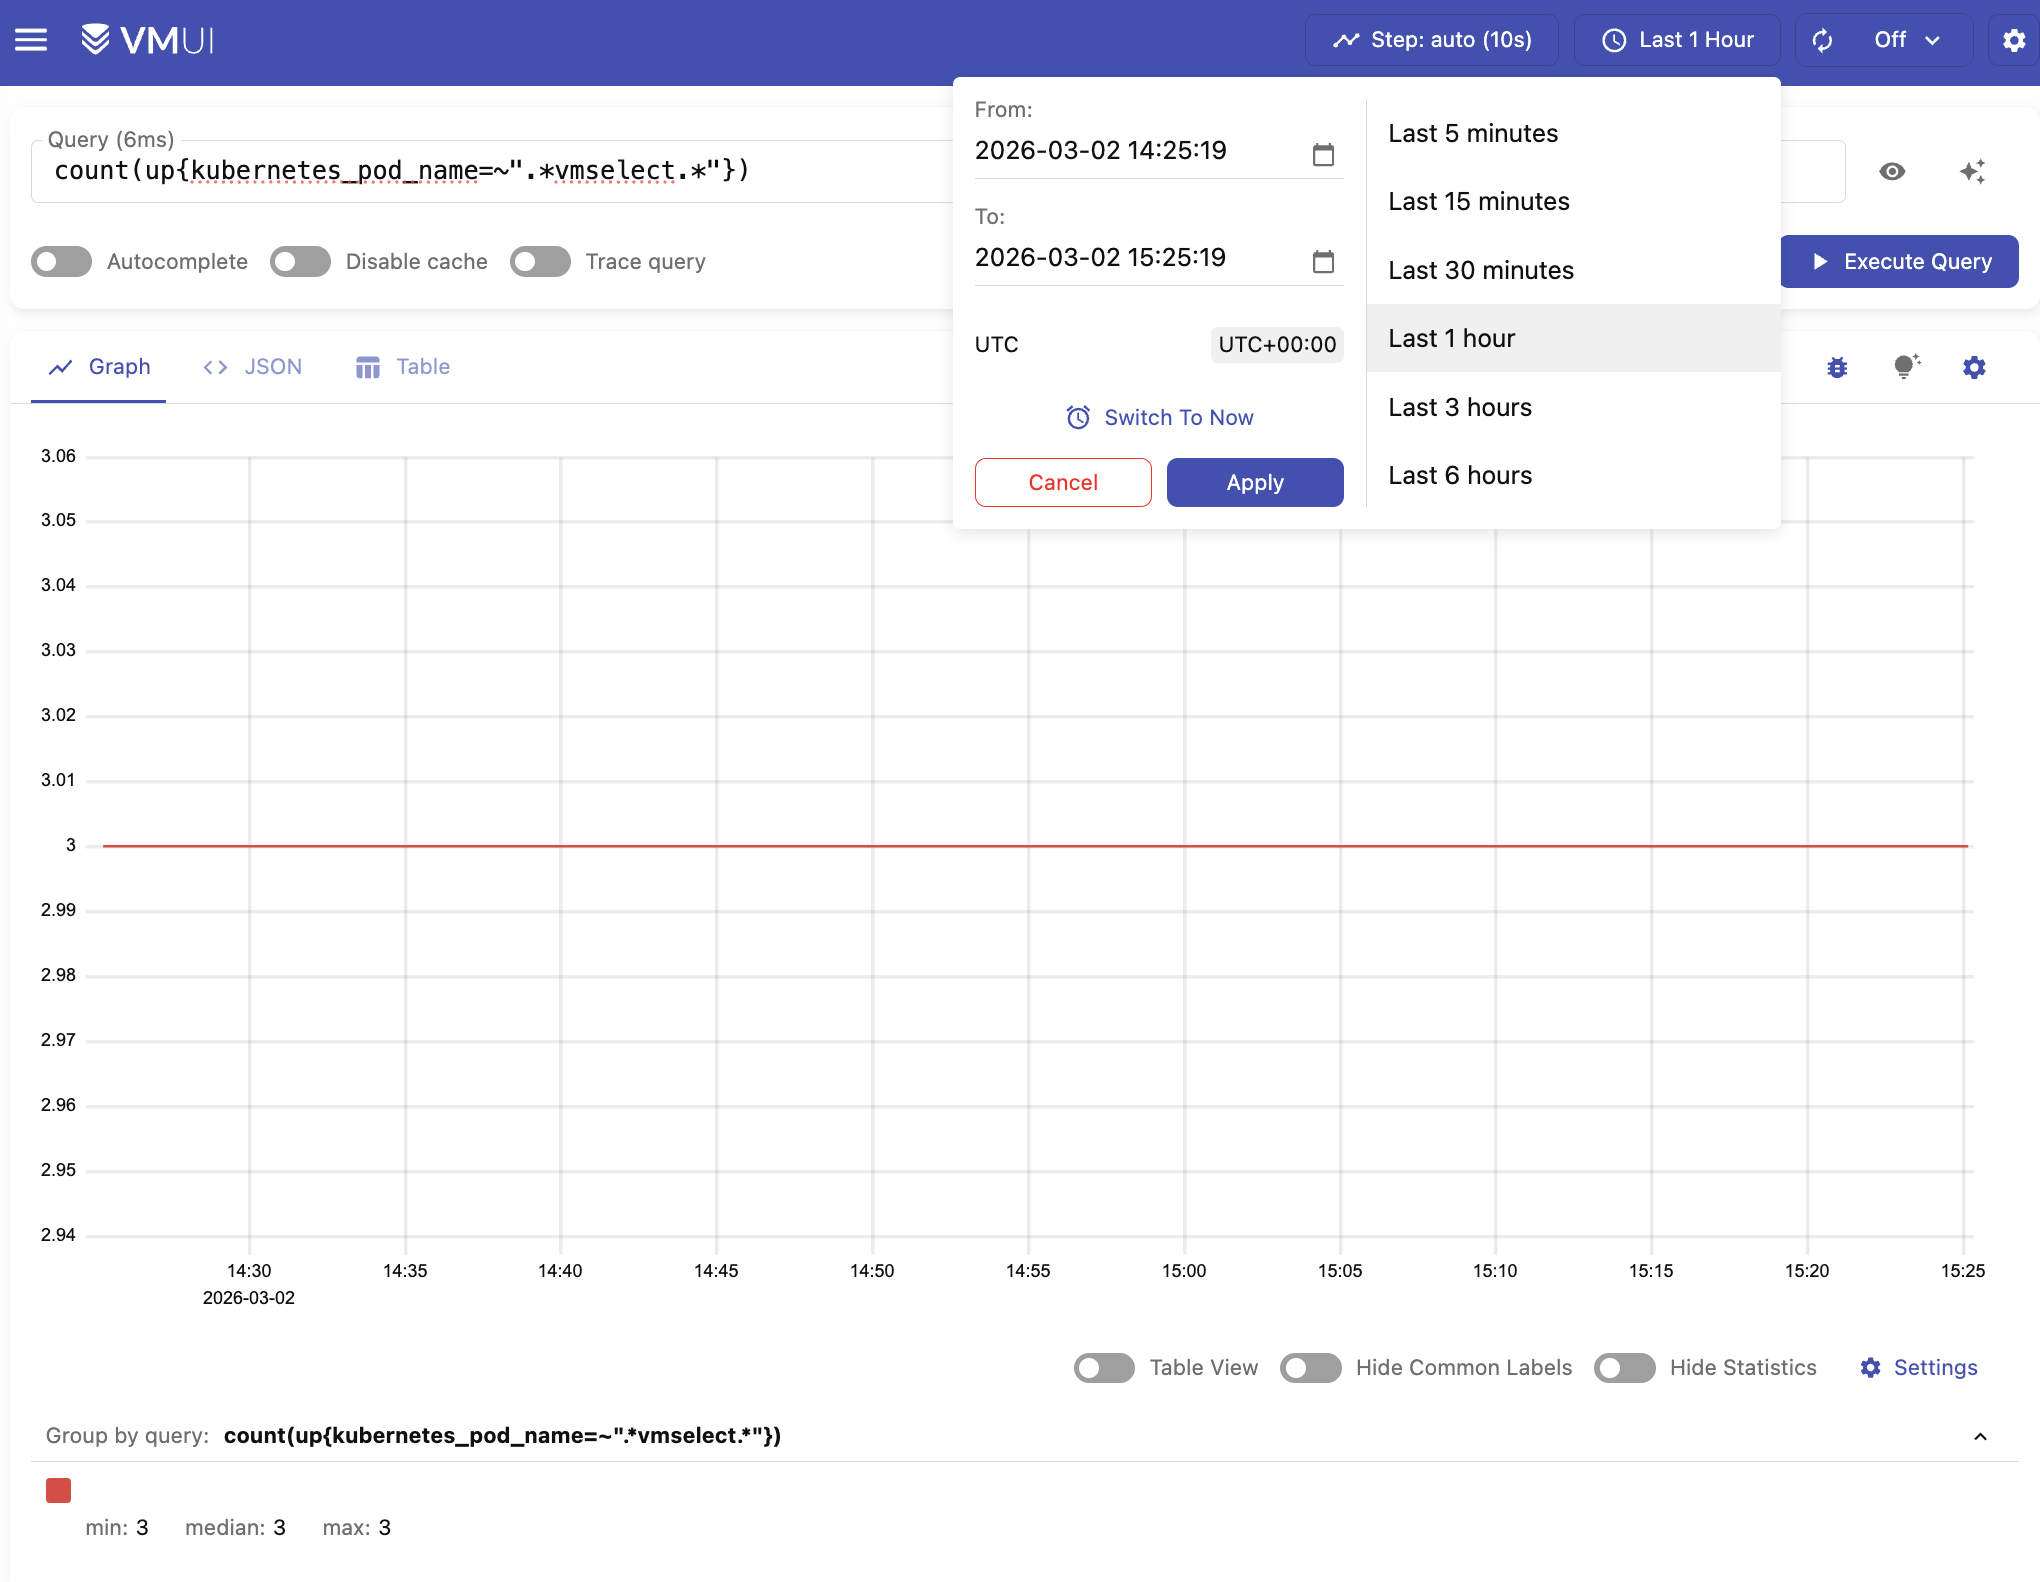
You can also execute the query in VMUI by opening your browser in http://localhost:8481/select/0/vmui/ (where 0 is the
default tenant ID
).
Type count(up{kubernetes_pod_name=~".*vmselect.*"}) and press Execute query
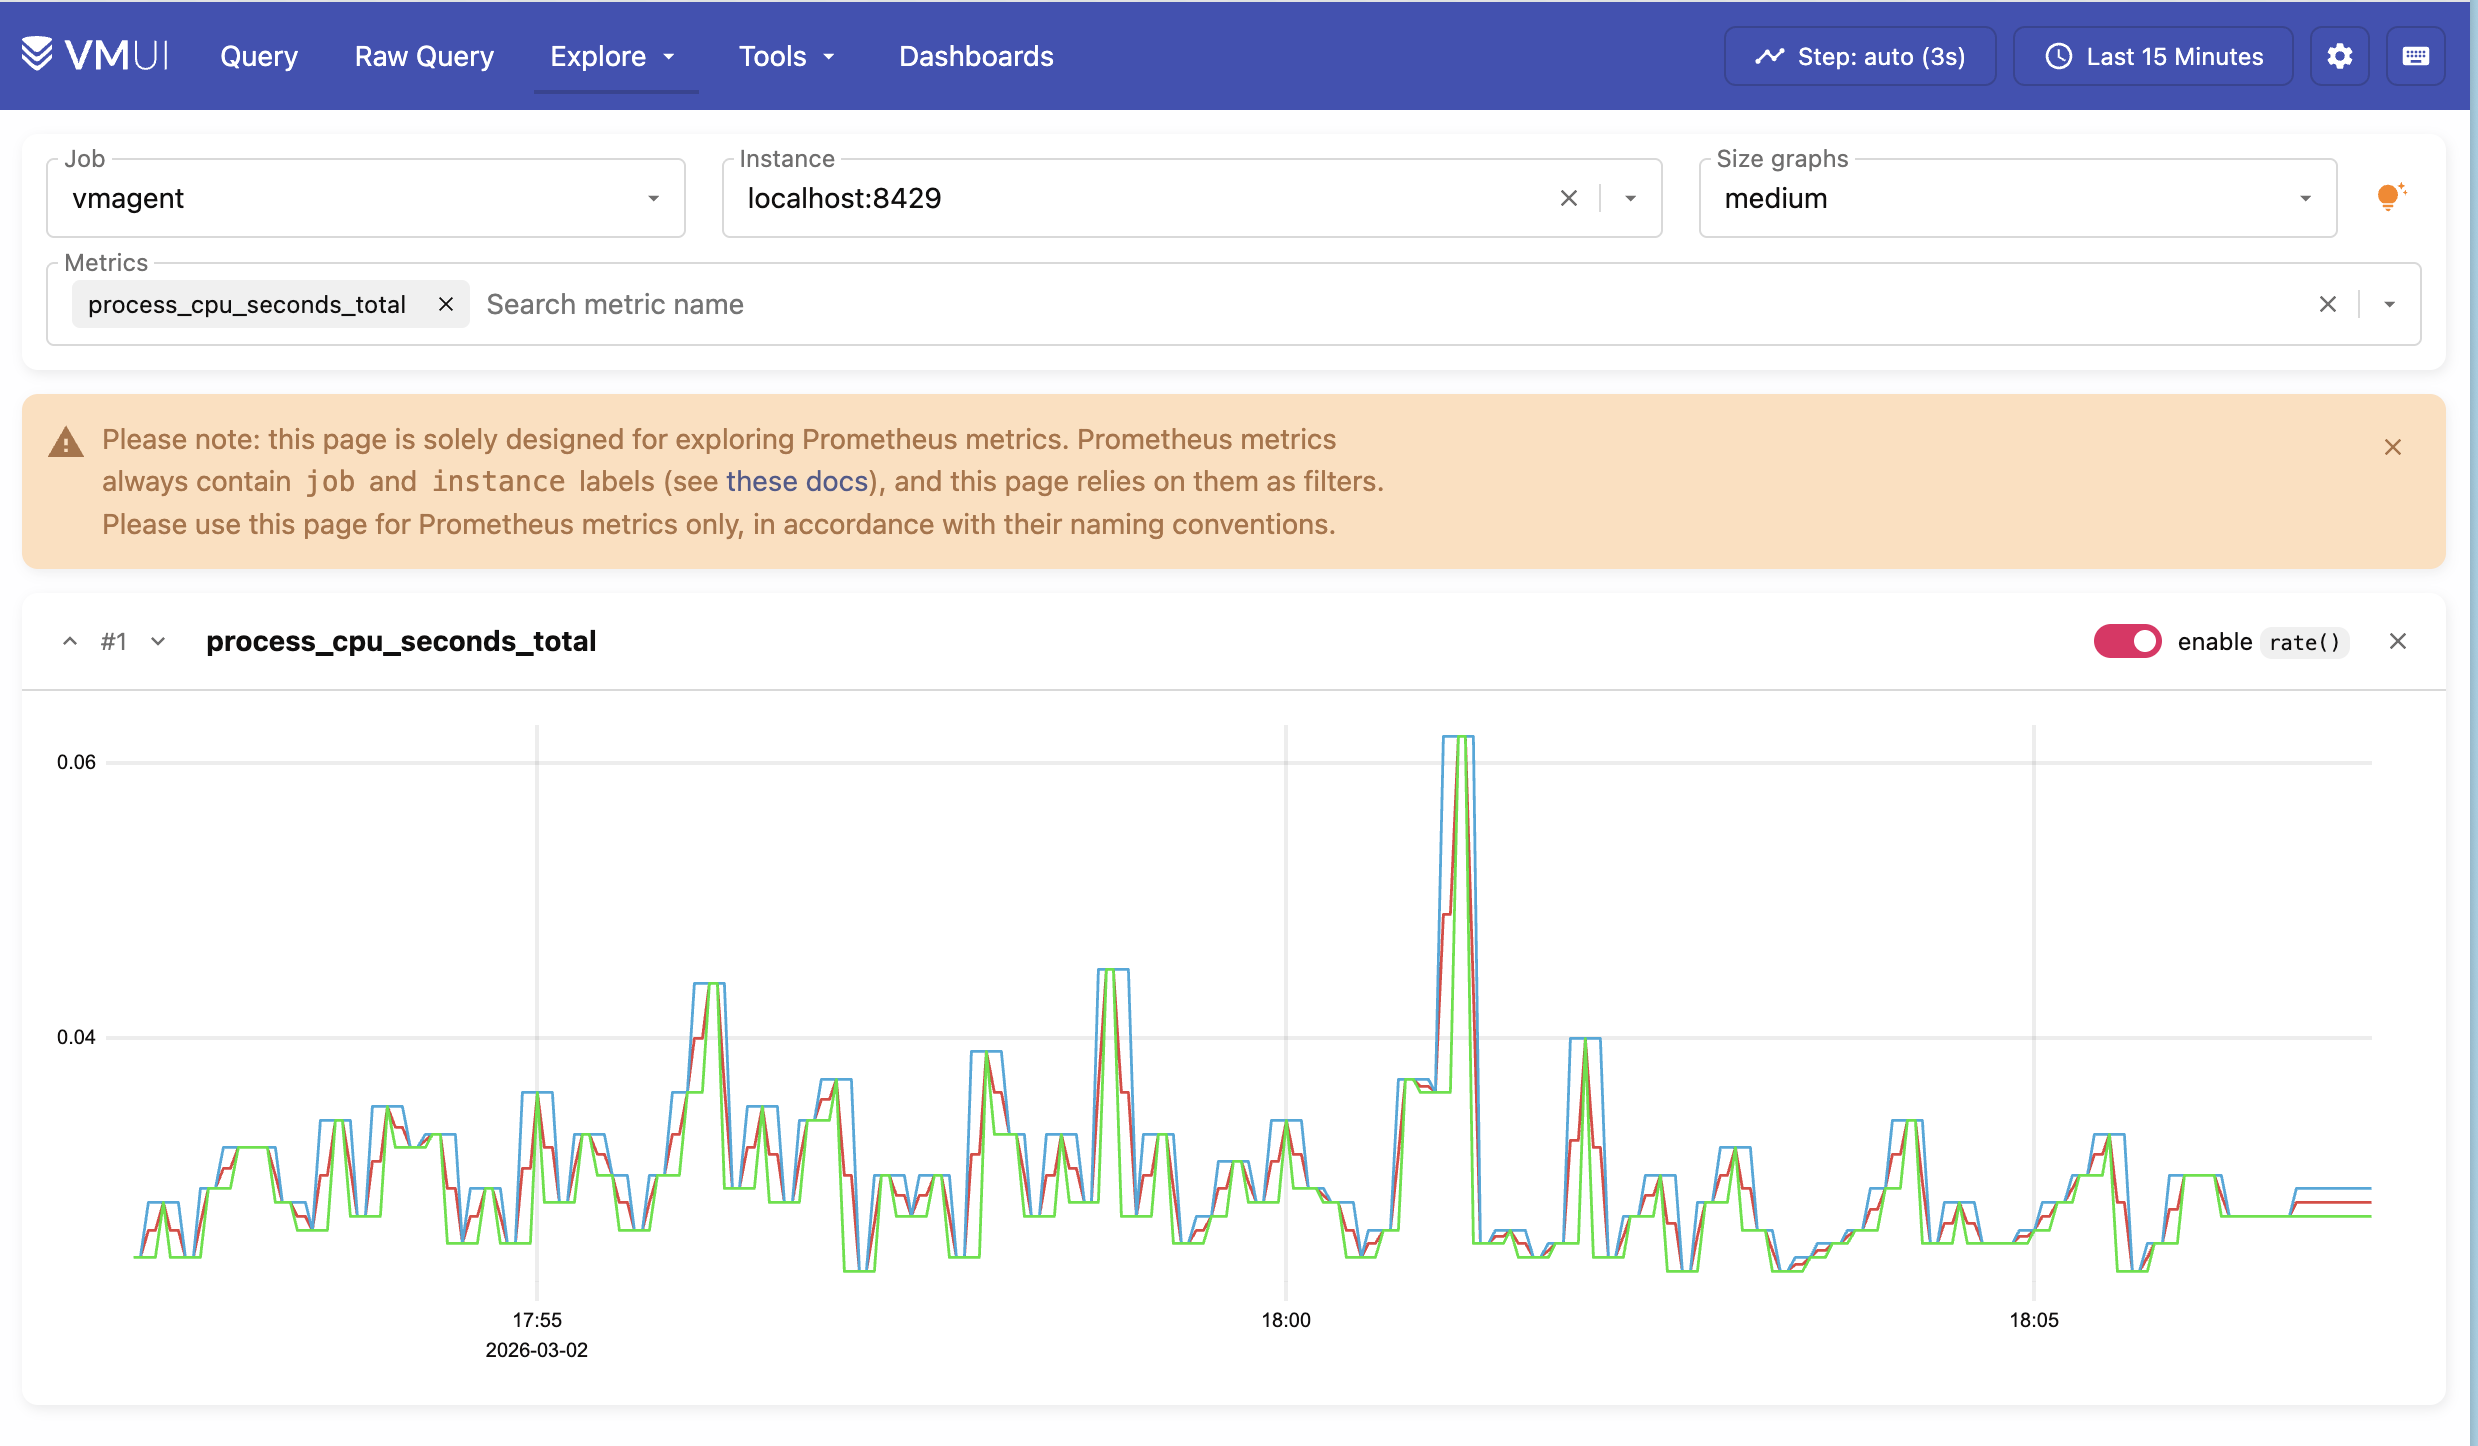
You can also try Explore > Prometheus metrics to discover metrics collected from the Kubernetes cluster.
5. High Availability #
We can test that High Availability is working by simulating a failure. We can do this by shutting down one of the vmstorage pods.
Reduce the number of vmstorage pods from 3 to 2 with the following command:
kubectl scale sts vmcluster-victoria-metrics-cluster-vmstorage --replicas=2
Verify that now we have two running vmstorage pods in the cluster by executing the following command:
kubectl get pods -l app=vmstorage
The expected output is:
      NAME                                             READY   STATUS    RESTARTS   AGE
vmcluster-victoria-metrics-cluster-vmstorage-0   1/1     Running   0          3h20m
vmcluster-victoria-metrics-cluster-vmstorage-1   1/1     Running   0          3h20m
You can confirm that there are two vmstorage pods with this query:
curl -sg 'http://127.0.0.1:8481/select/0/prometheus/api/v1/query?query=count(up{kubernetes_pod_name=~".*vmstorage.*"})' | jq
This should output 2 nodes:
      {
  "status": "success",
  "isPartial": false,
  "data": {
    "resultType": "vector",
    "result": [
      {
        "metric": {},
        "value": [
          1773437033,
          "2"
        ]
      }
    ]
  },
  "stats": {
    "seriesFetched": "2",
    "executionTimeMsec": 5
  }
}
Since each data point is stored across two storage pods, losing a single pod does not affect query results, and data remains available as long as at least one replica per time series remains reachable.
You can also check if the query result is complete by examining the isPartial value in the response:
- When
isPartial: false, the response is complete for the requested time range and series. This means that enough storage replicas have responded (according to the configuredreplicationFactor). - When
isPartial: true, it meansvmselectcould not fetch all the data it expected fromvmstorage, so the returned series and values may be incomplete or incorrect.
Running other queries such as count(up{kubernetes_pod_name=~".*vmselect.*"}) should still return 3.
curl -sg 'http://127.0.0.1:8481/select/0/prometheus/api/v1/query?query=count(up{kubernetes_pod_name=~".*vmselect.*"})' | jq
This should print:
      {
  "status": "success",
  "isPartial": false,
  "data": {
    "resultType": "vector",
    "result": [
      {
        "metric": {},
        "value": [
          1773437137,
          "3"
        ]
      }
    ]
  },
  "stats": {
    "seriesFetched": "3",
    "executionTimeMsec": 5
  }
}
This means that queries and metric ingestion are not affected by the “failure” of a single storage pod.
Finally, you can scale the vmstorage pods back to 3 to resume normal operation:
kubectl scale sts vmcluster-victoria-metrics-cluster-vmstorage --replicas=3
6. Final thoughts #
- We set up a highly available VictoriaMetrics cluster on Kubernetes
- We collected metrics from running services and stored them in the VictoriaMetrics database.
- We configured
dedup.minScrapeIntervalandreplicationFactor: 2for the VictoriaMetrics cluster for high availability purposes. - We tested and made sure that metrics are available even if one of the
vmstoragenodes is turned off.
Next steps: