Store every configuration file you use during this guide in version control. You may need them for reference or to change the configuration of your installation.
This guide walks you through deploying a VictoriaMetrics cluster version on Kubernetes.
By the end of this guide, you will know:
- How to install and configure VictoriaMetrics cluster version using Helm.
- How to scrape metrics from Kubernetes components using service discovery.
- How to store metrics in VictoriaMetrics time-series database.
- How to visualize metrics in Grafana
We will use:
We use a GKE cluster from GCP , but this guide can also be applied to any Kubernetes cluster. For example, Amazon EKS or an on-premises cluster.
1. VictoriaMetrics Helm repository #
To start, add the VictoriaMetrics Helm repository with the following commands:
      helm repo add vm https://victoriametrics.github.io/helm-charts/
helm repo update
To verify that everything is set up correctly, you may run this command:
helm search repo vm/
You should see a list similar to this:
      NAME                                    CHART VERSION   APP VERSION     DESCRIPTION
vm/victoria-metrics-cluster             0.34.0          v1.135.0        VictoriaMetrics Cluster version - high-performa...
vm/victoria-metrics-agent               0.31.0          v1.135.0        VictoriaMetrics Agent - collects metrics from v...
...(the list continues)...
2. Install VictoriaMetrics Cluster from the Helm chart #
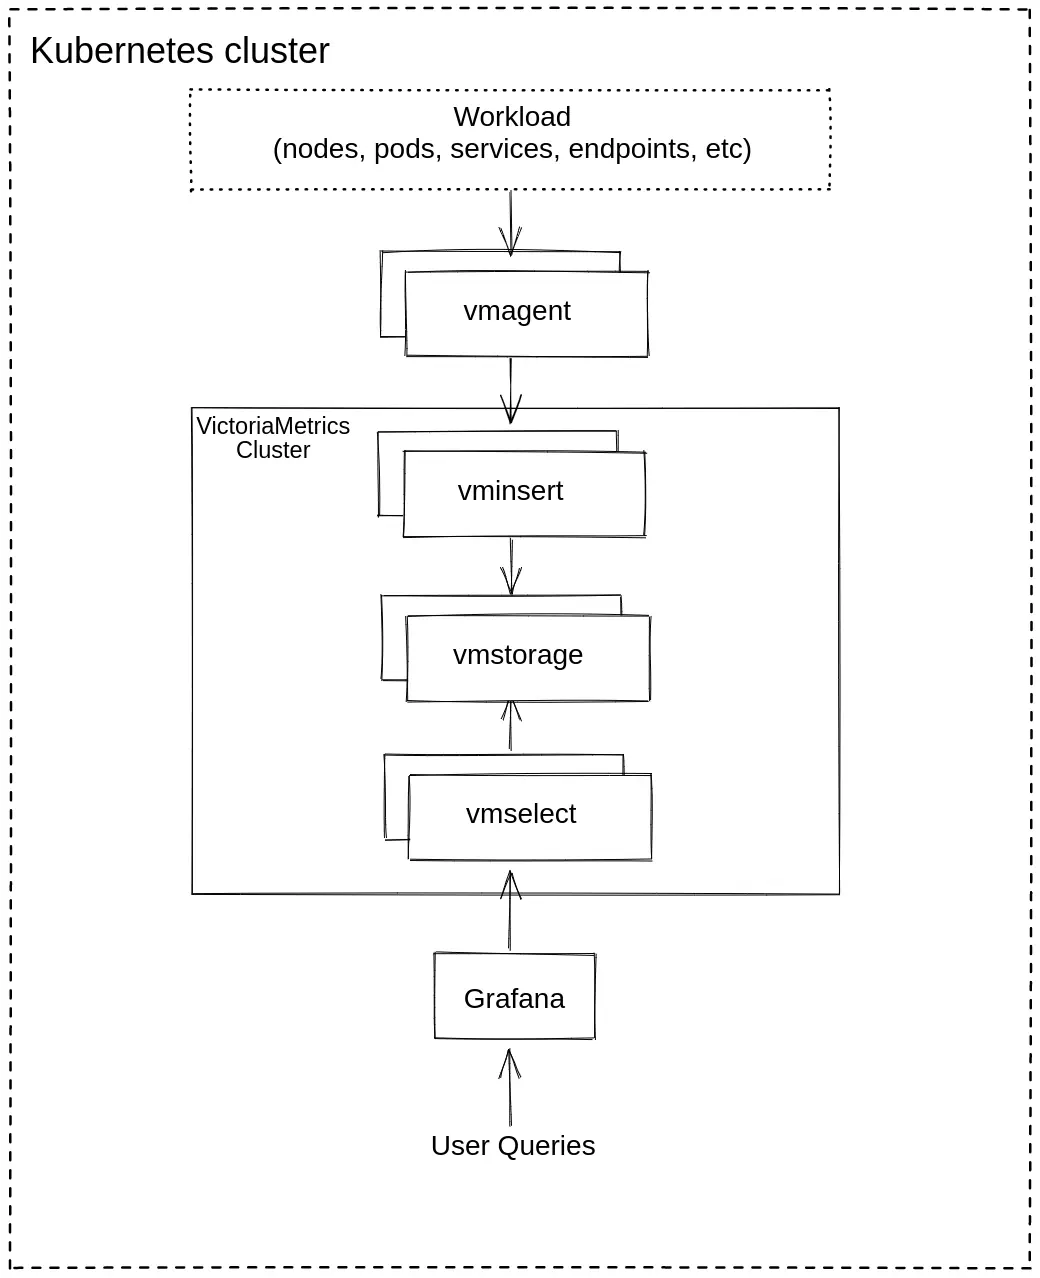
A VictoriaMetrics cluster consists of three services:
vminsert: receives incoming metrics and distributes them acrossvmstoragenodes via consistent hashing on metric names and labels.vmstorage: stores raw data and serves queries filtered by time range and labels.vmselect: executes queries by fetching data across all configuredvmstoragenodes.
To get started, create a config file for the VictoriaMetrics Helm chart:
      cat <<EOF >victoria-metrics-cluster-values.yml
vmselect:
  podAnnotations:
      prometheus.io/scrape: "true"
      prometheus.io/port: "8481"

vminsert:
  podAnnotations:
      prometheus.io/scrape: "true"
      prometheus.io/port: "8480"

vmstorage:
  podAnnotations:
      prometheus.io/scrape: "true"
      prometheus.io/port: "8482"
EOF
The config file defines two settings for the VictoriaMetrics services:
podAnnotations: prometheus.io/scrape: "true"enables automatic service discovery and metric scraping from the VictoriaMetrics pods.podAnnotations:prometheus.io/port: "<port-number>"defines which port numbers to target for scraping metrics from the VictoriaMetrics pods.
Next, install VictoriaMetrics cluster version with the following command:
helm install vmcluster vm/victoria-metrics-cluster -f victoria-metrics-cluster-values.yml
The expected output should look like this:
      NAME: vmcluster
LAST DEPLOYED: Wed Feb  4 12:00:55 2026
NAMESPACE: default
STATUS: deployed
REVISION: 1
DESCRIPTION: Install complete
TEST SUITE: None
NOTES:
Write API:

The Victoria Metrics write api can be accessed via port 8480 with the following DNS name from within your cluster:
vmcluster-victoria-metrics-cluster-vminsert.default.svc.cluster.local.

Get the Victoria Metrics insert service URL by running these commands in the same shell:
  export POD_NAME=$(kubectl get pods --namespace default -l "app=" -o jsonpath="{.items[0].metadata.name}")
  kubectl --namespace default port-forward $POD_NAME 8480

You need to update your Prometheus configuration file and add the following lines to it:

prometheus.yml

    remote_write:
      - url: "http://<insert-service>/insert/0/prometheus/"

for example -  inside the Kubernetes cluster:

    remote_write:
      - url: http://vmcluster-victoria-metrics-cluster-vminsert.default.svc.cluster.local.:8480/insert/0/prometheus/
Read API:

The VictoriaMetrics read api can be accessed via port 8481 with the following DNS name from within your cluster:
vmcluster-victoria-metrics-cluster-vmselect.default.svc.cluster.local.

Get the VictoriaMetrics select service URL by running these commands in the same shell:
  export POD_NAME=$(kubectl get pods --namespace default -l "app=" -o jsonpath="{.items[0].metadata.name}")
  kubectl --namespace default port-forward $POD_NAME 8481

You need to specify select service URL into your Grafana:
 NOTE: you need to use the Prometheus Data Source

Input this URL field into Grafana

    http://<select-service>/select/0/prometheus/


for example - inside the Kubernetes cluster:

    http://vmcluster-victoria-metrics-cluster-vmselect.default.svc.cluster.local.:8481/select/0/prometheus/
Note the following endpoint URLs:
The
remote_writeURL will be required on Step 3 to configure where thevmagentservice sends telemetry data.remote_write: - url: http://vmcluster-victoria-metrics-cluster-vminsert.default.svc.cluster.local.:8480/insert/0/prometheus/The
VictoriaMetrics read apiwill be required on Step 4 to configure the Grafana datasource.The VictoriaMetrics read api can be accessed via port 8481 with the following DNS name from within your cluster: vmcluster-victoria-metrics-cluster-vmselect.default.svc.cluster.local.
Verify that VictoriaMetrics cluster pods are up and running by executing the following command:
kubectl get pods
You should see a list of pods similar to this:
      NAME                                                           READY   STATUS    RESTARTS   AGE
vmcluster-victoria-metrics-cluster-vminsert-689cbc8f55-95szg   1/1     Running   0          16m
vmcluster-victoria-metrics-cluster-vminsert-689cbc8f55-f852l   1/1     Running   0          16m
vmcluster-victoria-metrics-cluster-vmselect-977d74cdf-bbgp5    1/1     Running   0          16m
vmcluster-victoria-metrics-cluster-vmselect-977d74cdf-vzp6z    1/1     Running   0          16m
vmcluster-victoria-metrics-cluster-vmstorage-0                 1/1     Running   0          16m
vmcluster-victoria-metrics-cluster-vmstorage-1                 1/1     Running   0          16m
3. Install vmagent from the Helm chart #
In order to collect metrics from the Kubernetes cluster, we need to install
vmagent
. This service scrapes, relabels, and sends metrics to the vminsert service running in the cluster.
Run the following command to install the vmagent service in your cluster:
helm install vmagent vm/victoria-metrics-agent -f https://docs.victoriametrics.com/guides/examples/guide-vmcluster-vmagent-values.yaml
Here are the key settings in the chart values file guide-vmcluster-vmagent-values.yaml:
remoteWritedefines thevminsertendpoint that receives telemetry from vmagent . This value should match exactly the URL for theremote_writein the output of Step 2 .remoteWrite: - url: http://vmcluster-victoria-metrics-cluster-vminsert.default.svc.cluster.local:8480/insert/0/prometheus/metric_relabel_configsdefines label-rewriting rules that help us show Kubernetes metrics in the Grafana dashboard later on.metric_relabel_configs: - action: replace source_labels: [pod] regex: '(.+)' target_label: pod_name replacement: '${1}' - action: replace source_labels: [container] regex: '(.+)' target_label: container_name replacement: '${1}' - action: replace target_label: name replacement: k8s_stub - action: replace source_labels: [id] regex: '^/system\.slice/(.+)\.service$' target_label: systemd_service_name replacement: '${1}'
Verify that vmagent’s pod is up and running by executing the following command:
kubectl get pods | grep vmagent
Check that the pod is in Running state:
vmagent-victoria-metrics-agent-69974b95b4-mhjph 1/1 Running 0 11m
4. Install and connect Grafana to VictoriaMetrics with Helm #
Add the Grafana Community Helm repository:
      helm repo add grafana-community https://grafana-community.github.io/helm-charts
helm repo update
See more information on Grafana in ArtifactHUB
Create a values config file to define the data sources and dashboards for VictoriaMetrics in the Grafana service:
      cat <<EOF > grafana-cluster-values.yml
  datasources:
    datasources.yaml:
      apiVersion: 1
      datasources:
        - name: victoriametrics
          type: prometheus
          orgId: 1
          url: http://vmcluster-victoria-metrics-cluster-vmselect.default.svc.cluster.local:8481/select/0/prometheus/
          access: proxy
          isDefault: true
          updateIntervalSeconds: 10
          editable: true

  dashboardProviders:
   dashboardproviders.yaml:
     apiVersion: 1
     providers:
     - name: 'default'
       orgId: 1
       folder: ''
       type: file
       disableDeletion: true
       editable: true
       options:
         path: /var/lib/grafana/dashboards/default

  dashboards:
    default:
      victoriametrics:
        gnetId: 11176
        datasource: victoriametrics
      vmagent:
        gnetId: 12683
        datasource: victoriametrics
      kubernetes:
        gnetId: 14205
        datasource: victoriametrics
EOF
The config file defines the following settings for Grafana:
- Provides a VictoriaMetrics data source. This value must match the
VictoriaMetrics read apiendpoint and port obtained in Step 2 during the VictoriaMetrics cluster installation. - Adds three starter dashboards:
- VictoriaMetrics - cluster for the VictoriaMetrics cluster .
- VictoriaMetrics - vmagent for the VictoriaMetrics agent .
- Kubernetes cluster Monitoring (via Prometheus) to show Kubernetes cluster metrics.
Run the following command to install the Grafana chart with the name my-grafana:
helm install my-grafana grafana-community/grafana -f grafana-cluster-values.yml
You should get the following output:
      NAME: my-grafana
LAST DEPLOYED: Wed Feb  4 15:00:28 2026
NAMESPACE: default
STATUS: deployed
REVISION: 1
DESCRIPTION: Install complete
NOTES:
1. Get your 'admin' user password by running:

   kubectl get secret --namespace default my-grafana -o jsonpath="{.data.admin-password}" | base64 --decode ; echo


2. The Grafana server can be accessed via port 80 on the following DNS name from within your cluster:

   my-grafana.default.svc.cluster.local

   Get the Grafana URL to visit by running these commands in the same shell:
     export POD_NAME=$(kubectl get pods --namespace default -l "app.kubernetes.io/name=grafana,app.kubernetes.io/instance=my-grafana" -o jsonpath="{.items[0].metadata.name}")
     kubectl --namespace default port-forward $POD_NAME 3000

3. Login with the password from step 1 and the username: admin
#################################################################################
######   WARNING: Persistence is disabled!!! You will lose your data when   #####
######            the Grafana pod is terminated.                            #####
#################################################################################
Use the first command in the output to obtain the password for the admin user:
kubectl get secret --namespace default my-grafana -o jsonpath="{.data.admin-password}" | base64 --decode ; echo
The second part of the output shows how to port-forward the Grafana service in order to access it locally on 127.0.0.1:3000:
      export pod_name=$(kubectl get pods --namespace default -l "app.kubernetes.io/name=grafana,app.kubernetes.io/instance=my-grafana" -o jsonpath="{.items[0].metadata.name}")

kubectl --namespace default port-forward $pod_name 3000
5. Check the result you obtained in your browser #
To check that VictoriaMetrics
collects metrics from the Kubernetes cluster, open in your browser http://127.0.0.1:3000/dashboards. Use admin for login and password obtained in the previous step.
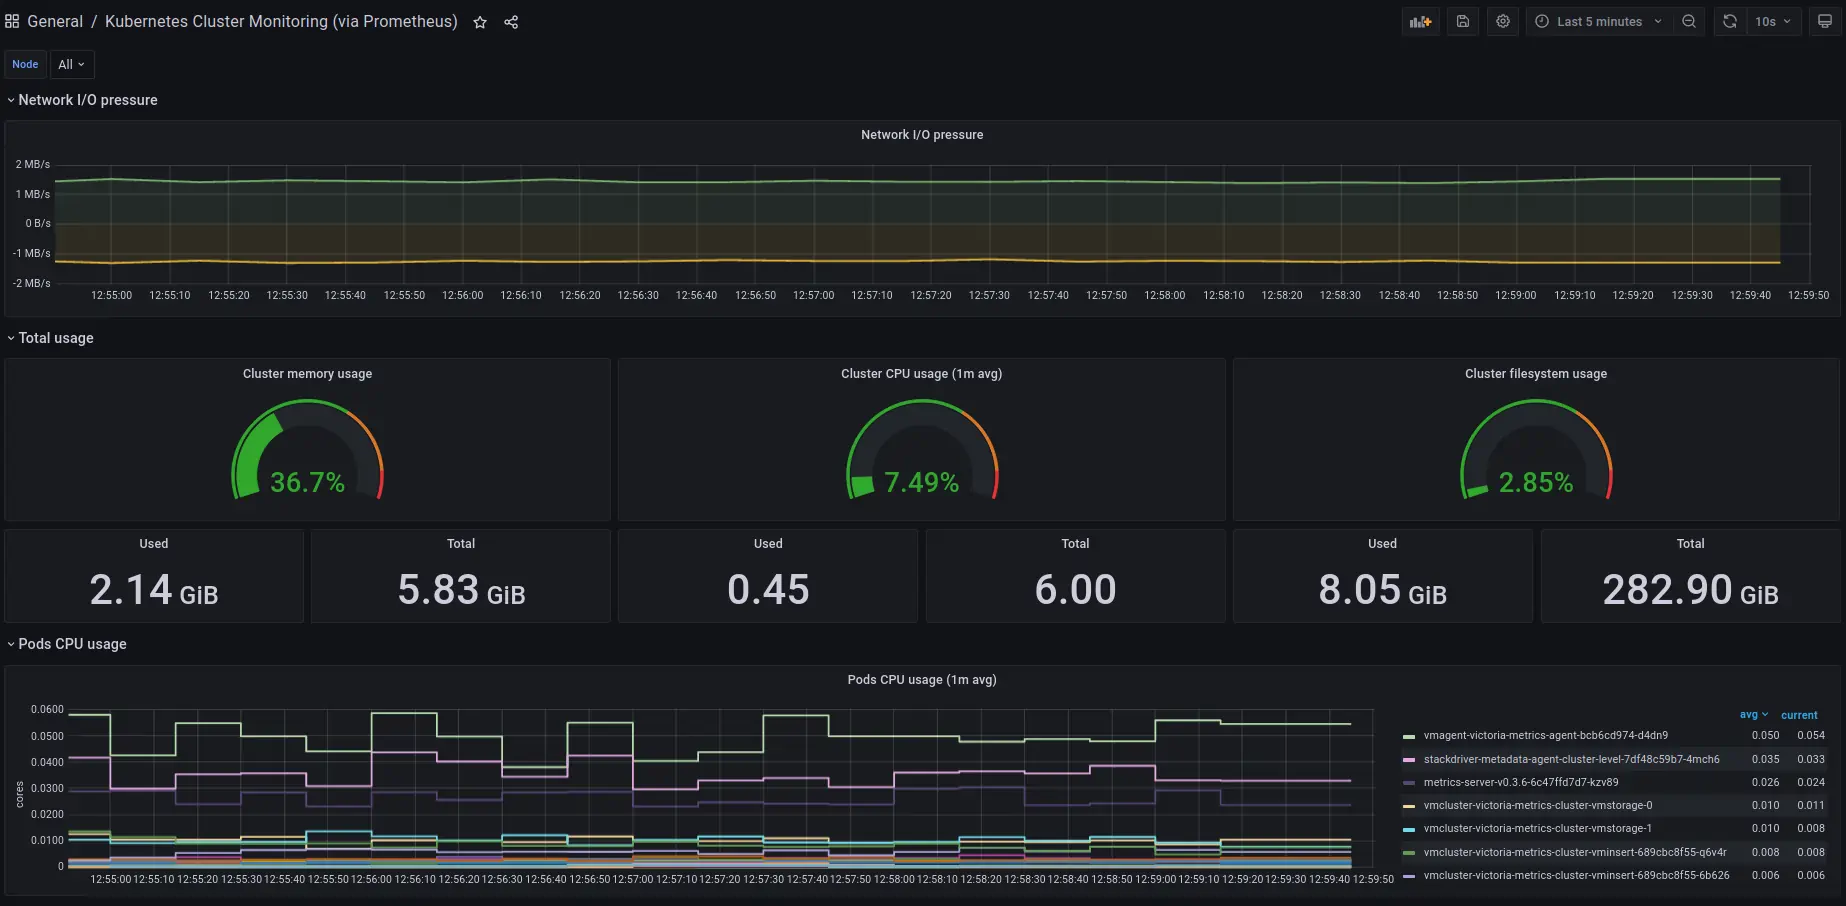
You should see three dashboards installed. Select “Kubernetes Cluster Monitoring”.
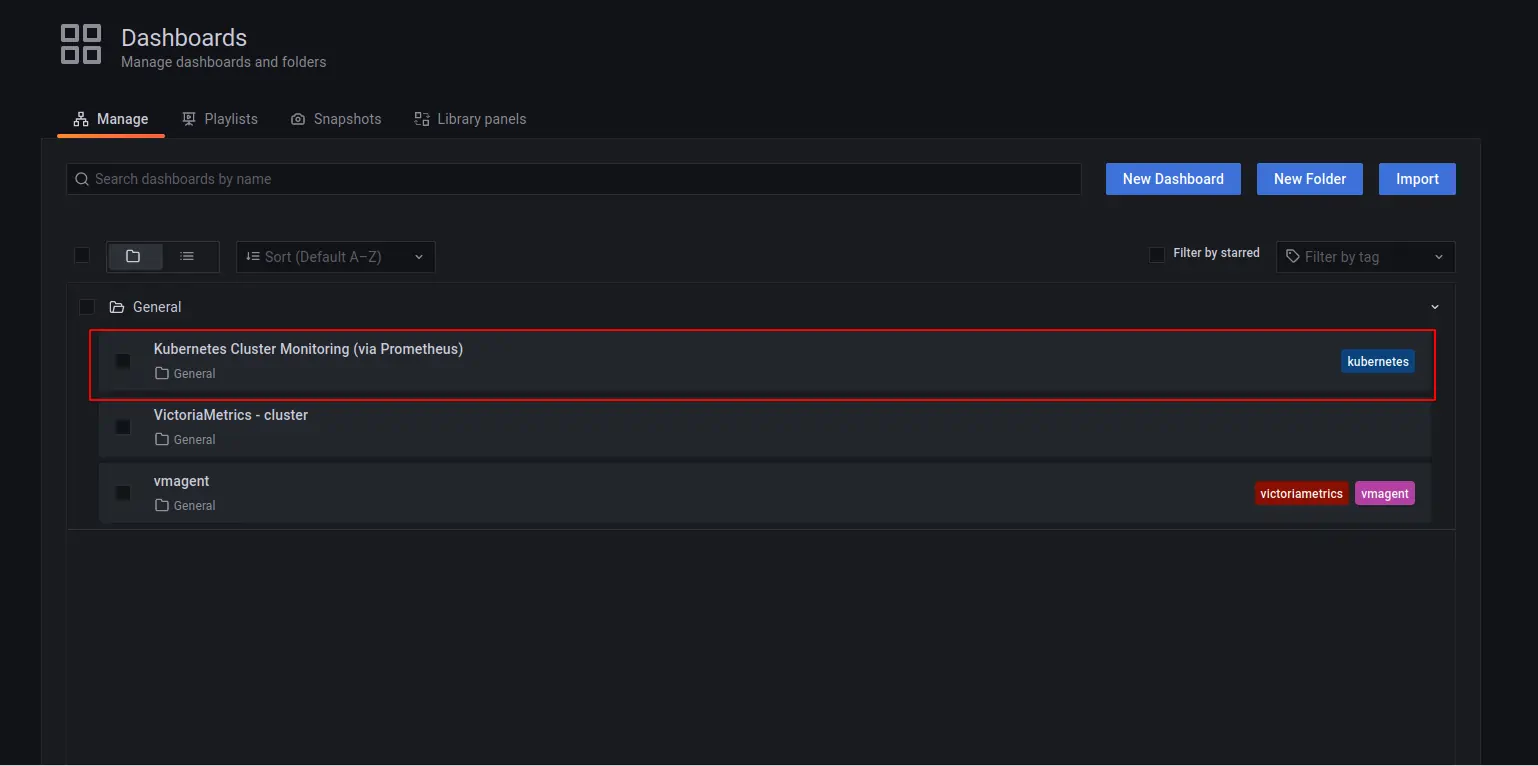
This is the main dashboard, which shows activity across your Kubernetes cluster:
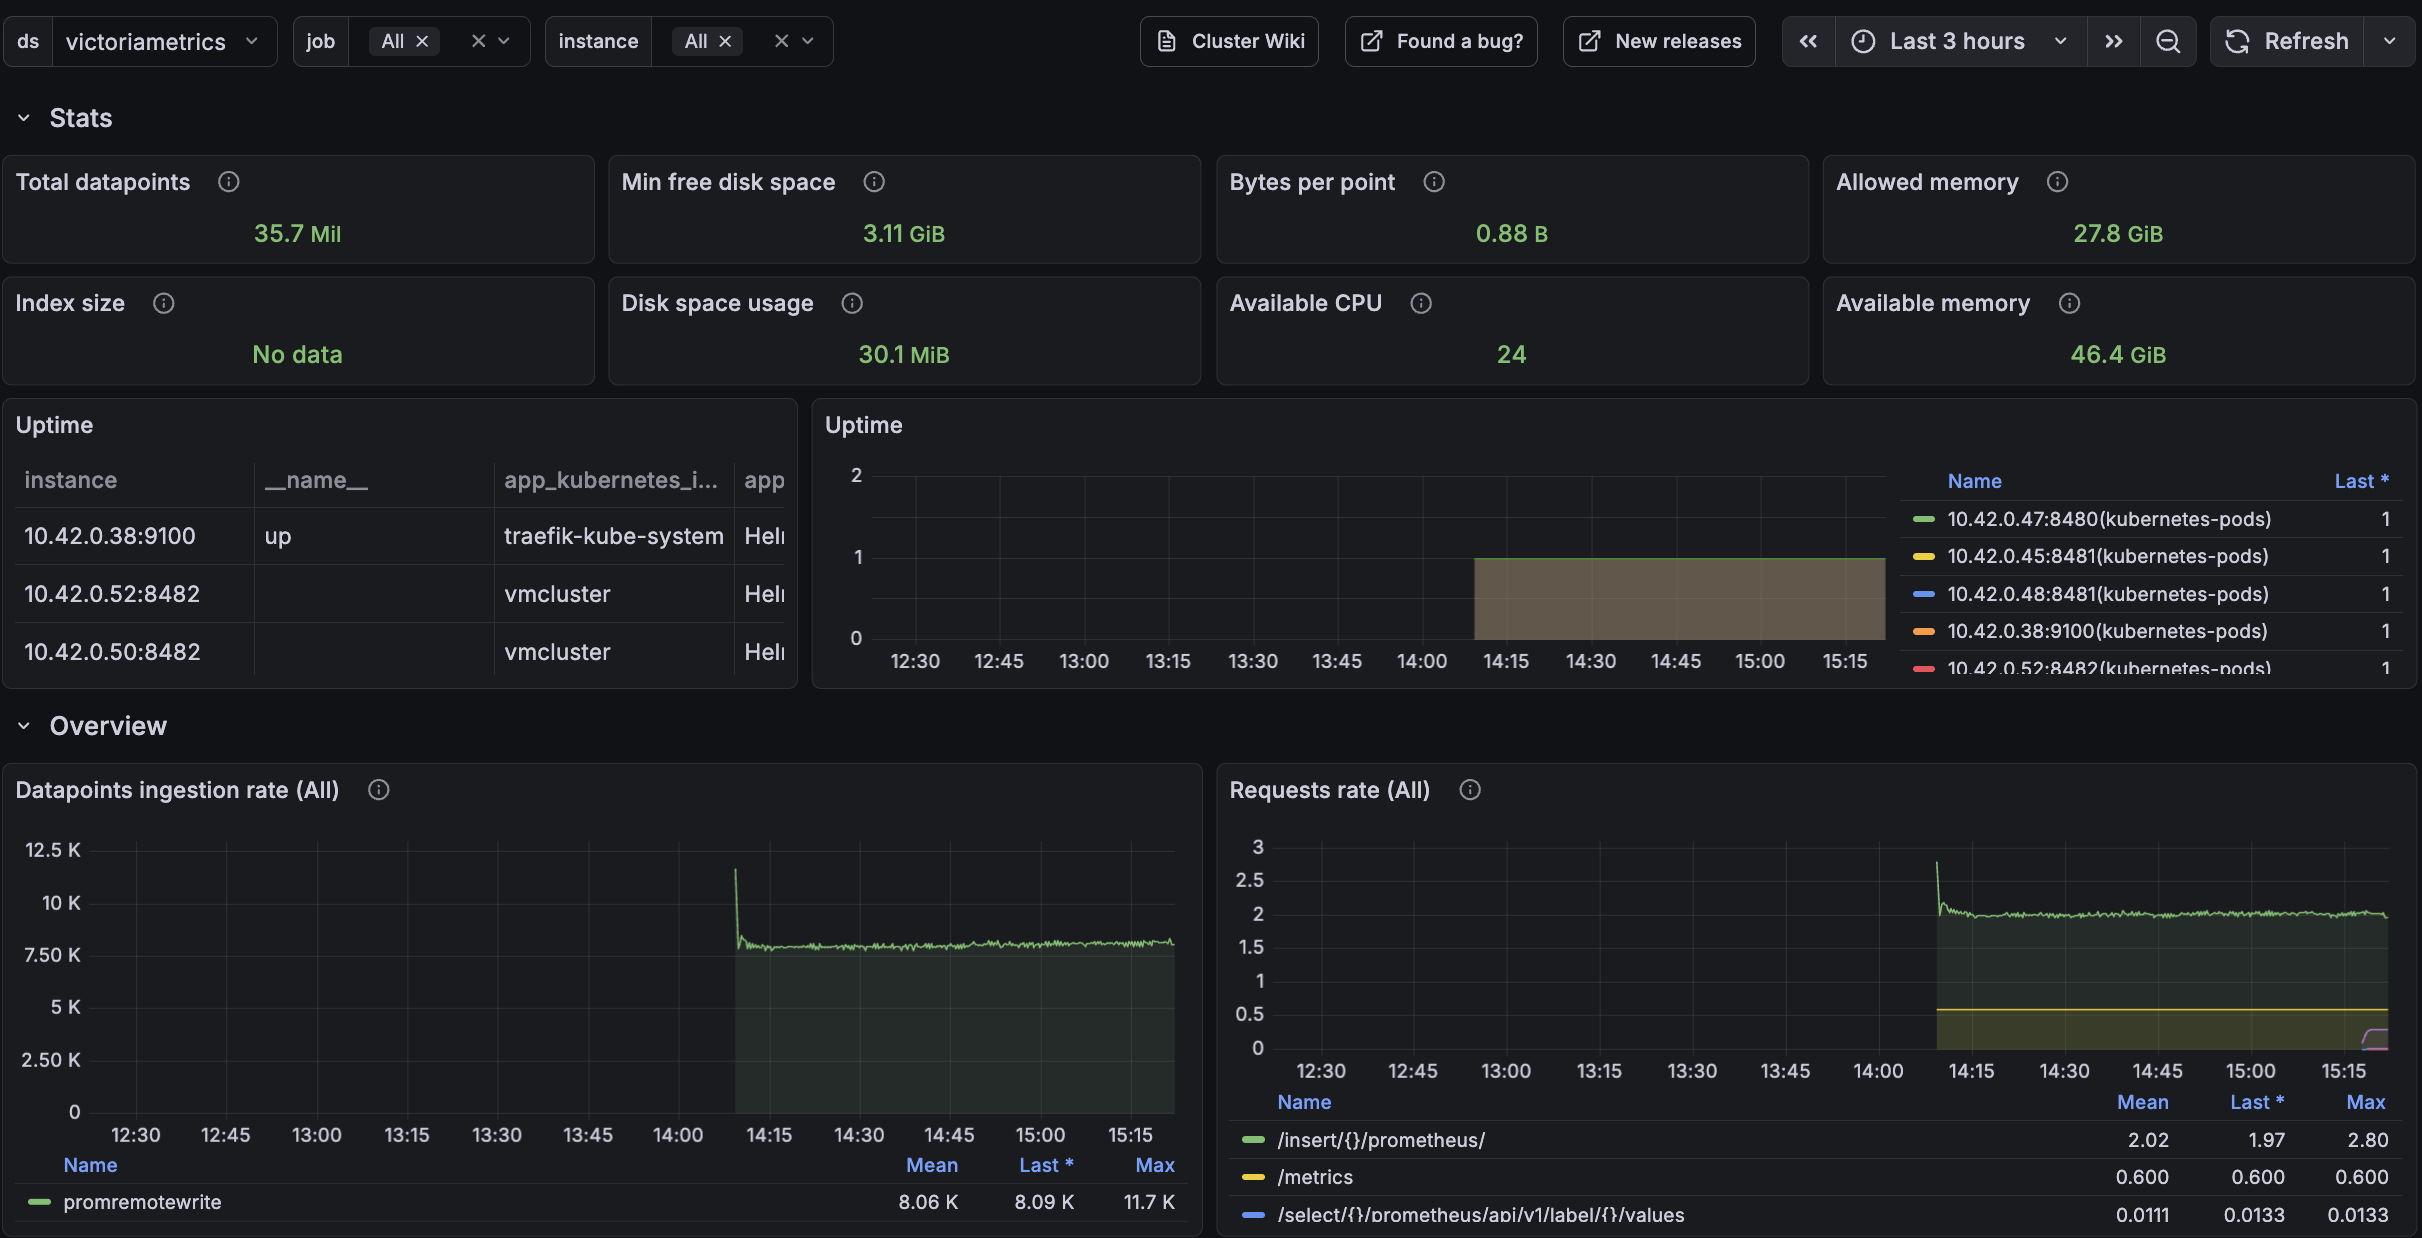
The VictoriaMetrics cluster dashboard is also available to monitor telemetry ingestion and resource utilization:
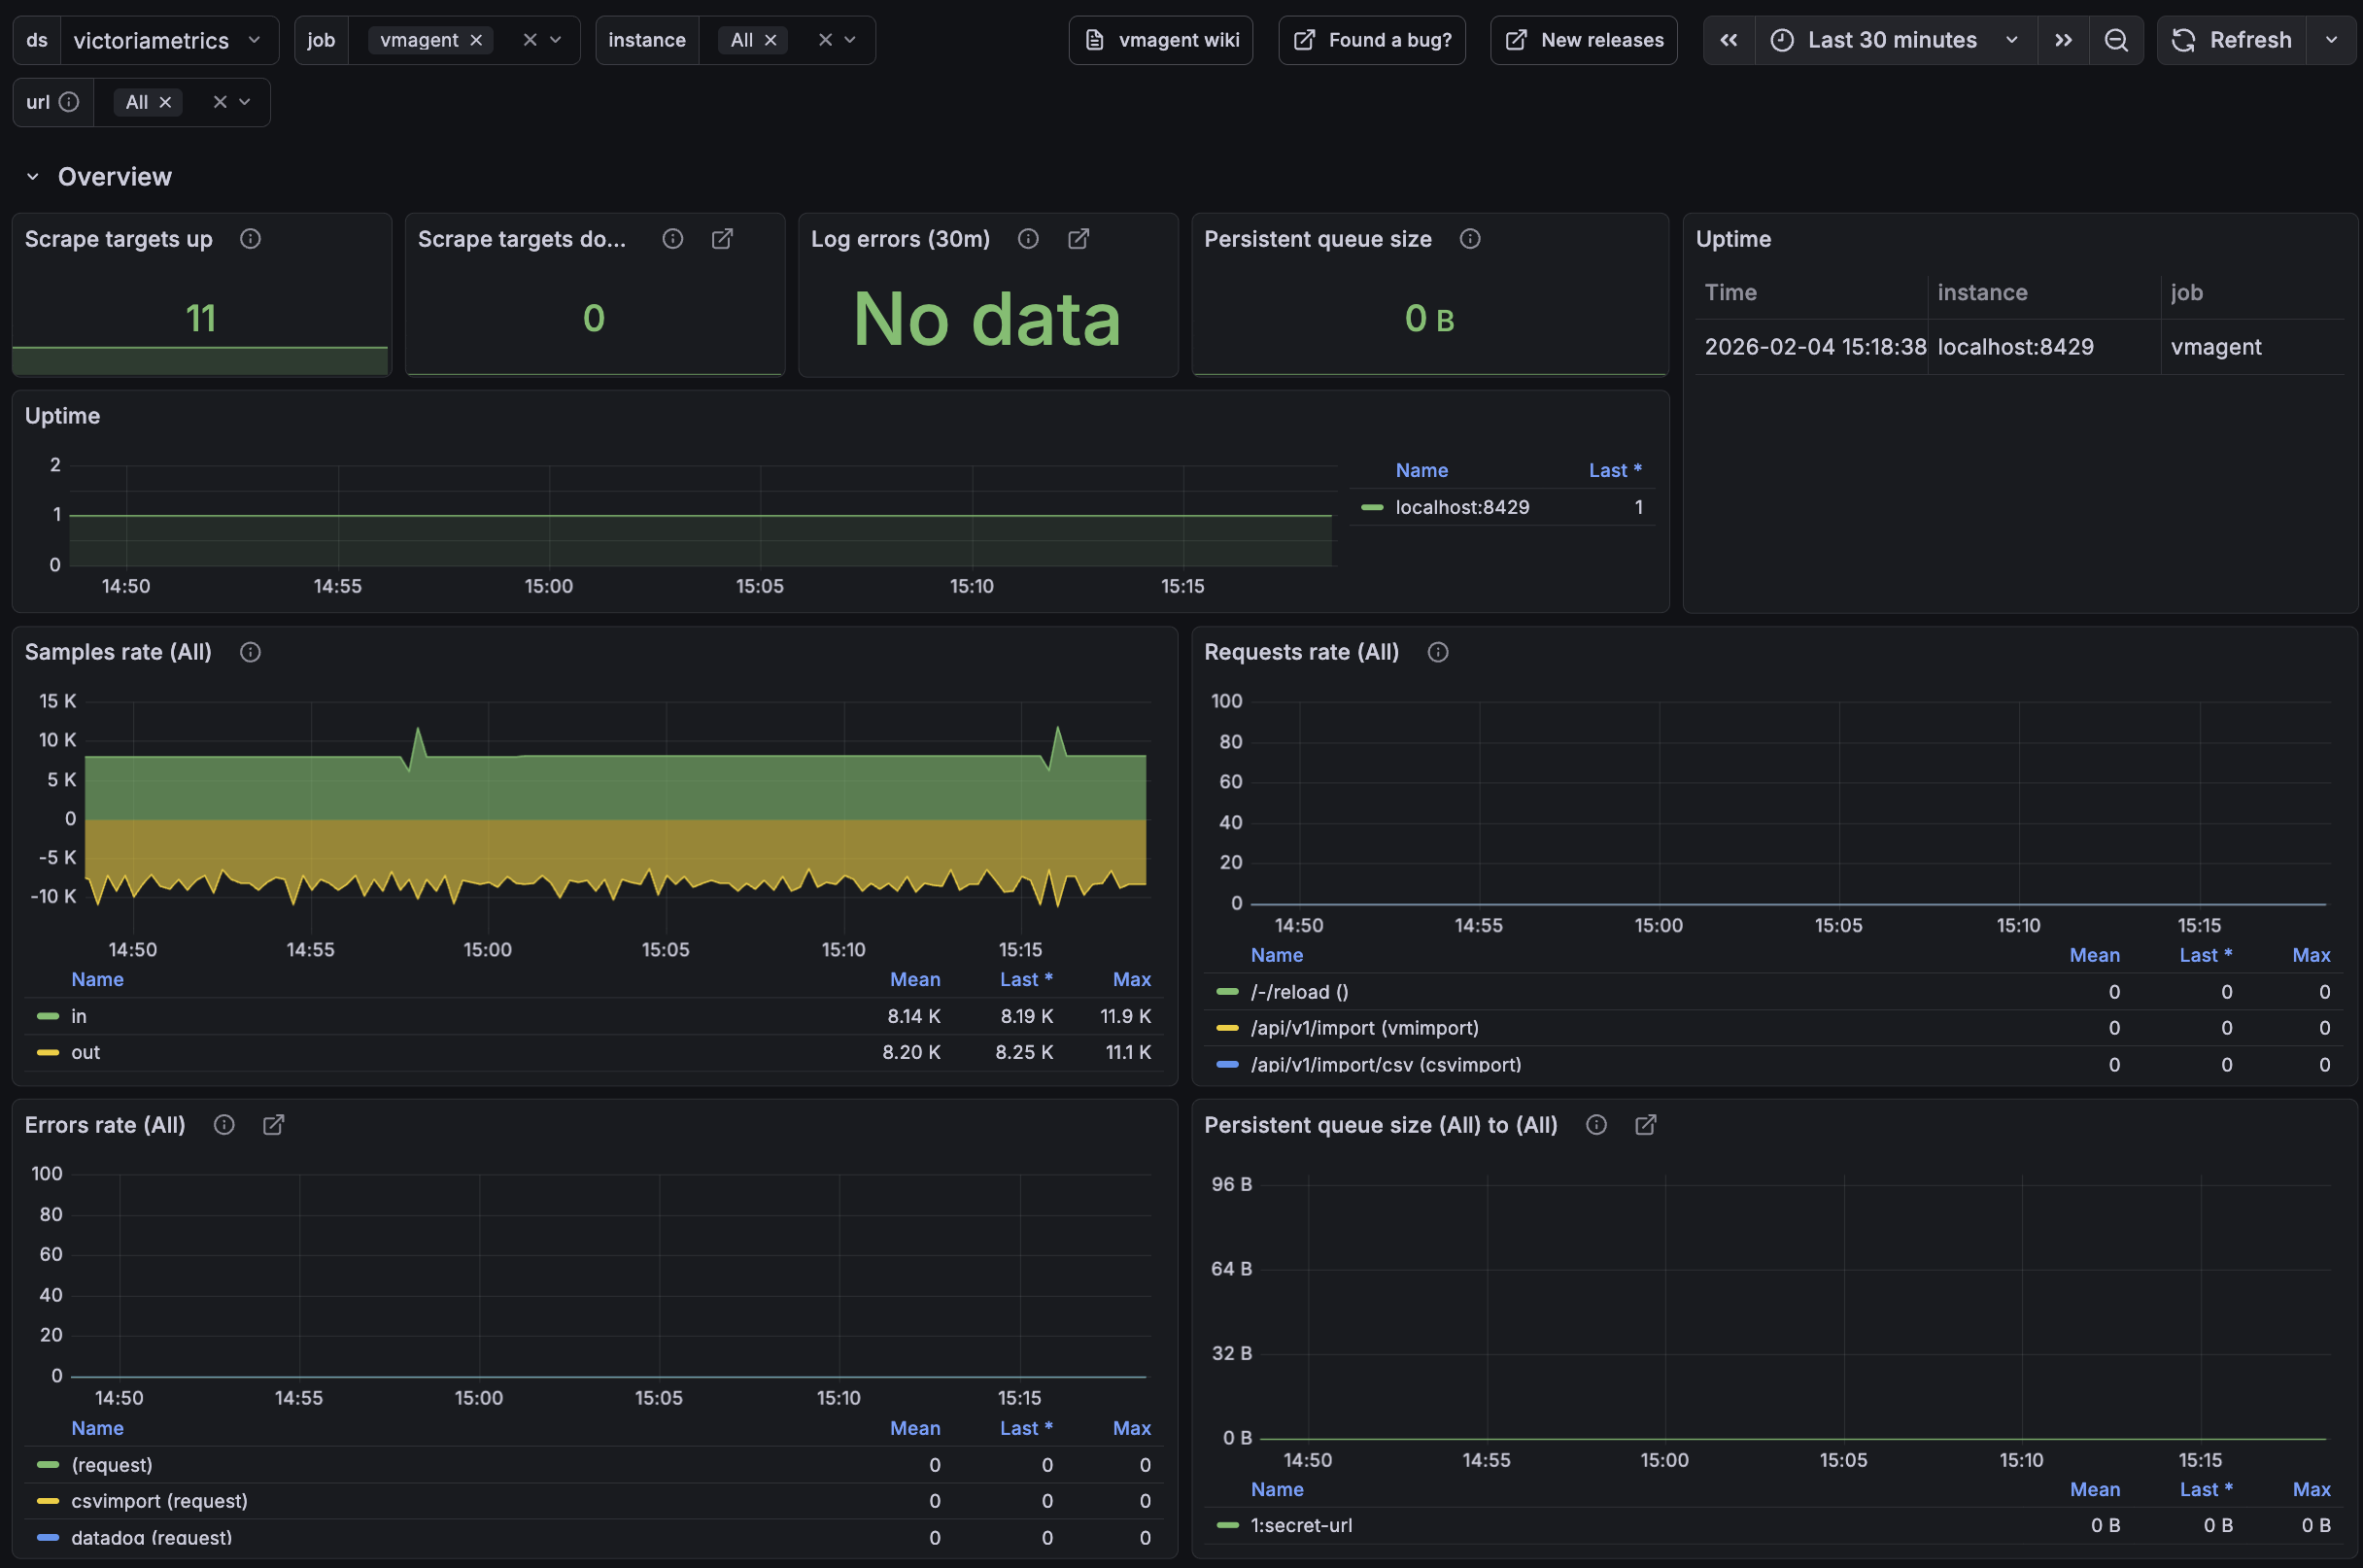
And vmagent has a separate dashboard to monitor scraping and queue activity:
6. Final thoughts #
- We set up a TimeSeries Database for your Kubernetes cluster.
- We collected metrics from all running pods, nodes, and services and stored them in a VictoriaMetrics database.
- We visualized resources used in the Kubernetes cluster by using Grafana dashboards.
Consider reading these resources to complete your setup: