Store every configuration file you use during this guide in version control. You may need them for reference or to change the configuration of your installation.
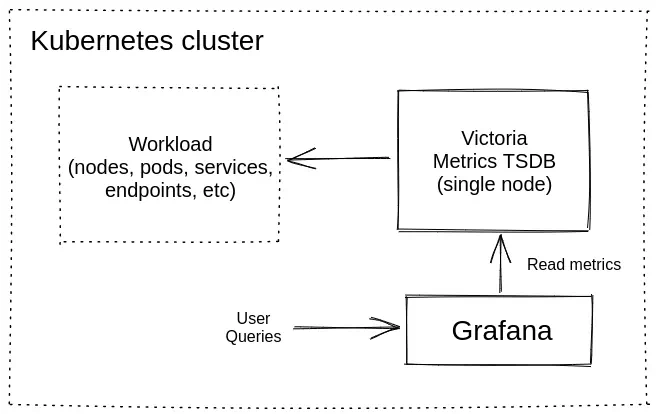
This guide walks you through deploying a single-node version of VictoriaMetrics on Kubernetes using Helm.
At the end of this guide, you will know:
- How to install VictoriaMetrics single node in Kubernetes.
- How to scrape metrics from Kubernetes components using service discovery.
- How to store metrics in VictoriaMetrics time series database.
- How to visualize stored data with Grafana.
Precondition
We will use:
We use a GKE cluster from GCP , but this guide also applies to any Kubernetes cluster. For example, Amazon EKS or an on-premises cluster.
1. VictoriaMetrics Helm repository #
Run the following command to add the VictoriaMetrics Helm repository:
      helm repo add vm https://victoriametrics.github.io/helm-charts/
helm repo update
To verify that everything is set up correctly, you may run this command:
helm search repo vm/
You should get a list of charts similar to this:
      NAME                                    CHART VERSION   APP VERSION     DESCRIPTION
vm/victoria-metrics-single              0.29.0          v1.134.0        VictoriaMetrics Single version - high-performan...
vm/victoria-metrics-agent               0.30.0          v1.134.0        VictoriaMetrics Agent - collects metrics from v...
vm/victoria-metrics-alert               0.30.0          v1.134.0        VictoriaMetrics Alert - executes a list of give...
vm/victoria-metrics-anomaly             1.12.9          v1.28.2         VictoriaMetrics Anomaly Detection - a service t...
...(list continues)...
2. Install VictoriaMetrics single from Helm Chart #
Download the Helm value files with the example configuration for VictoriaMetrics single-node:
wget https://docs.victoriametrics.com/guides/examples/guide-vmsingle-values.yaml
Keep this file in version control. You may need it to update the configuration of your VictoriaMetrics service
Run this command in your terminal to install VictoriaMetrics single node to the default namespace in your cluster:
helm install vmsingle vm/victoria-metrics-single -f guide-vmsingle-values.yaml
Below are the key sections in the chart values file
guide-vmsingle-values.yaml
:
With
scrape: enabled: true, we enable metric autodiscovery for the Kubernetes cluster.server: scrape: enabled: true ...The
metric_relabel_configssection normalizes Kubernetes metrics labels so they are shown correctly in the Grafana dashboard later on.... metric_relabel_configs: - action: replace source_labels: [pod] regex: '(.+)' target_label: pod_name replacement: '${1}' - action: replace source_labels: [container] regex: '(.+)' target_label: container_name replacement: '${1}' - action: replace target_label: name replacement: k8s_stub - action: replace source_labels: [id] regex: '^/system\.slice/(.+)\.service$' target_label: systemd_service_name replacement: '${1}' ...
The helm install vmsingle vm/victoria-metrics-single command should result in the following output:
      NAME: vmsingle
LAST DEPLOYED: Wed Jan 28 13:04:36 2026
NAMESPACE: default
STATUS: deployed
REVISION: 1
DESCRIPTION: Install complete
TEST SUITE: None
NOTES:
The VictoriaMetrics write api can be accessed via port 8428 on the following DNS name from within your cluster:
    vmsingle-victoria-metrics-single-server.default.svc.cluster.local.

Metrics Ingestion:
  Get the Victoria Metrics service URL by running these commands in the same shell:
    export POD_NAME=$(kubectl get pods --namespace default -l "app=" -o jsonpath="{.items[0].metadata.name}")
    kubectl --namespace default port-forward $POD_NAME 8428

  Write the URL inside the Kubernetes cluster:
    http://vmsingle-victoria-metrics-single-server.default.svc.cluster.local.:8428/<protocol-specific-write-endpoint>

  All supported write endpoints can be found at https://docs.victoriametrics.com/victoriametrics/single-server-victoriametrics/#how-to-import-time-series-data

  E.g, for Prometheus:
    http://vmsingle-victoria-metrics-single-server.default.svc.cluster.local.:8428/api/v1/write

Metrics Scrape:
  Pull-based scrapes are enabled
  Scrape config can be displayed by running this command::
    kubectl get cm vmsingle-victoria-metrics-single-server-scrapeconfig -n default

  The target’s information is accessible via api:
    Inside cluster:
      http://vmsingle-victoria-metrics-single-server.default.svc.cluster.local.:8428/targets
    Outside cluster:
      You need to port-forward the service (see instructions above) and call
      http://<service-host-port>/targets

Read Data:
  The following URL can be used as the datasource URL in Grafana::
    http://vmsingle-victoria-metrics-single-server.default.svc.cluster.local.:8428
Take note of the Grafana datasource URL near the end of the output, as we’ll use it in the next step. In the example above, this is the datasource URL:
      The following URL can be used as the datasource URL in Grafana::
http://vmsingle-victoria-metrics-single-server.default.svc.cluster.local.:8428
Verify that the VictoriaMetrics pod is up and running by executing the following command:
kubectl get pods
Wait until the STATUS is Running. The expected output is:
      NAME                                        READY   STATUS    RESTARTS   AGE
vmsingle-victoria-metrics-single-server-0   1/1     Running   0          68s
3. Install and connect Grafana to VictoriaMetrics with Helm #
Add the Grafana Helm repository.
      helm repo add grafana-community https://grafana-community.github.io/helm-charts
helm repo update
See more information on Grafana in ArtifactHUB
Create a config file for the Grafana service. Ensure that the url value matches the Grafana datasource URL from the previous step:
      cat <<EOF > grafana-single-values.yml
  datasources:
    datasources.yaml:
      apiVersion: 1
      datasources:
        - name: victoriametrics
          type: prometheus
          orgId: 1
          # use the URL obtained from the VictoriaMetrics helm install output
          url: http://vmsingle-victoria-metrics-single-server.default.svc.cluster.local.:8428
          access: proxy
          isDefault: true
          updateIntervalSeconds: 10
          editable: true

  dashboardProviders:
   dashboardproviders.yaml:
     apiVersion: 1
     providers:
     - name: 'default'
       orgId: 1
       folder: ''
       type: file
       disableDeletion: true
       editable: true
       options:
         path: /var/lib/grafana/dashboards/default

  dashboards:
    default:
      victoriametrics:
        gnetId: 10229
        datasource: victoriametrics
      kubernetes:
        gnetId: 14205
        datasource: victoriametrics
EOF
Run the following command to install Grafana with the release name my-grafana:
helm install my-grafana grafana-community/grafana -f grafana-single-values.yml
By running this command, we:
- Install Grafana from the Helm repository.
- Configure Grafana to use the VictoriaMetrics datasource URL.
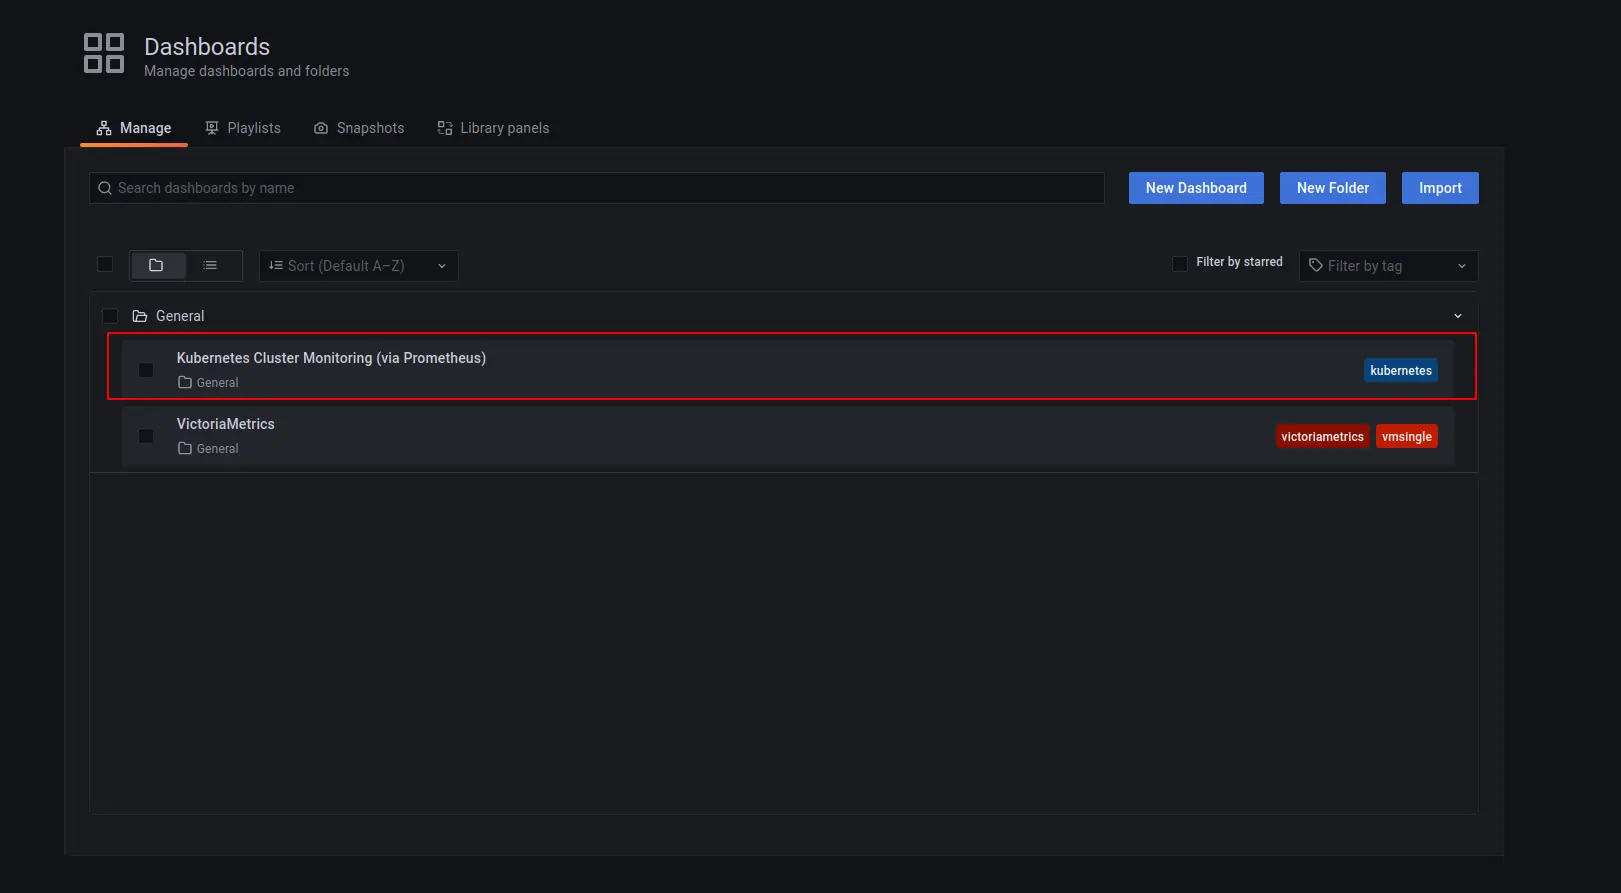
- Add two starter dashboards:
- Kubernetes Cluster Monitoring (via Prometheus) to show the Kubernetes Cluster metrics.
- VictoriaMetrics - single-node for VictoriaMetrics telemetry ingestion monitoring.
Check the output log in your terminal. You should see the following output:
      NAME: my-grafana
LAST DEPLOYED: Wed Jan 28 13:12:51 2026
NAMESPACE: default
STATUS: deployed
REVISION: 1
DESCRIPTION: Install complete
NOTES:
1. Get your 'admin' user password by running:

   kubectl get secret --namespace default my-grafana -o jsonpath="{.data.admin-password}" | base64 --decode ; echo


2. The Grafana server can be accessed via port 80 on the following DNS name from within your cluster:

   my-grafana.default.svc.cluster.local

   Get the Grafana URL to visit by running these commands in the same shell:
     export POD_NAME=$(kubectl get pods --namespace default -l "app.kubernetes.io/name=grafana,app.kubernetes.io/instance=my-grafana" -o jsonpath="{.items[0].metadata.name}")
     kubectl --namespace default port-forward $POD_NAME 3000

3. Login with the password from step 1 and the username: admin
#################################################################################
######   WARNING: Persistence is disabled!!! You will lose your data when   #####
######            the Grafana pod is terminated.                            #####
#################################################################################
To see the password for Grafana admin user use the command shown in the previous output:
kubectl get secret --namespace default my-grafana -o jsonpath="{.data.admin-password}" | base64 --decode ; echo
Wait until the Grafana pod Status is Running:
      NAME                                        READY   STATUS    RESTARTS   AGE
my-grafana-bc7796cf5-ffmln                  1/1     Running   0          8m40s
Expose the Grafana service on 127.0.0.1:3000 with:
      export POD_NAME=$(kubectl get pods --namespace default -l "app.kubernetes.io/name=grafana,app.kubernetes.io/instance=my-grafana" -o jsonpath="{.items[0].metadata.name}")

kubectl --namespace default port-forward $POD_NAME 3000
Now Grafana should be accessible at http://127.0.0.1:3000.
4. View the dashboards in your browser #
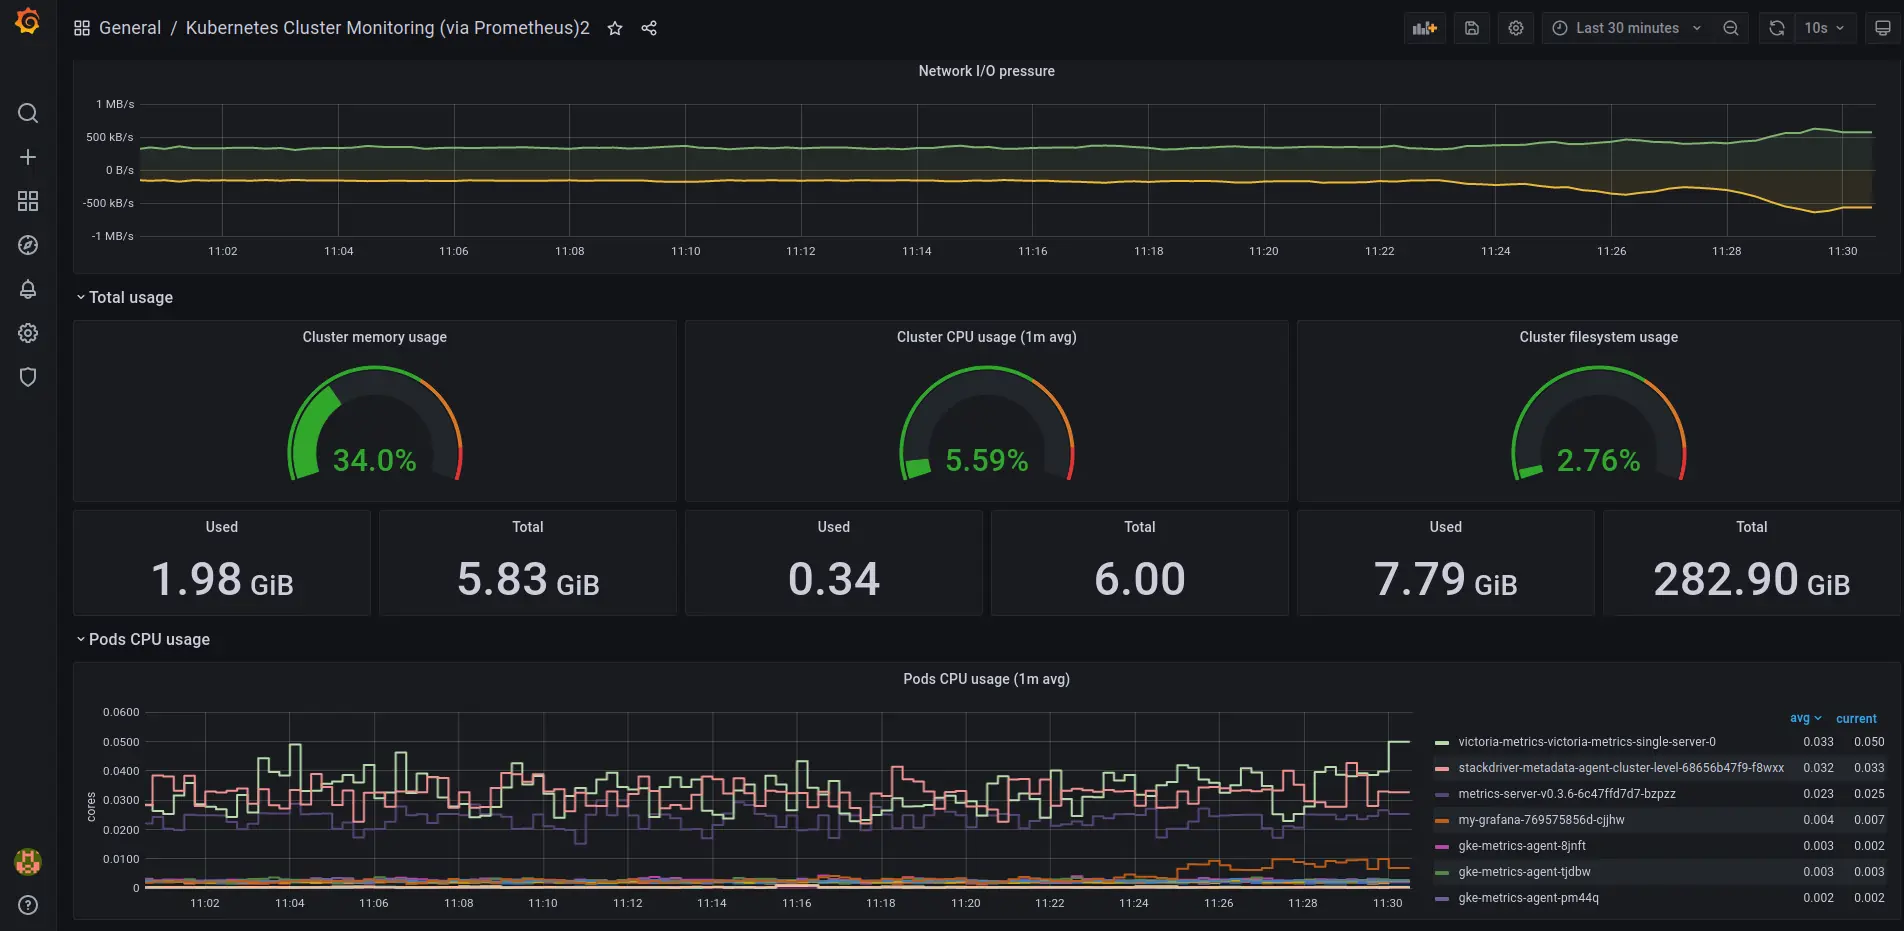
To check that VictoriaMetrics has collected metrics from the Kubernetes cluster, open the browser to http://127.0.0.1:3000/dashboards and choose the Kubernetes Cluster Monitoring (via Prometheus) dashboard.
Use admin as the username and the password you obtained earlier using kubectl get secret ....
You should see the metrics for your Kubernetes dashboard:
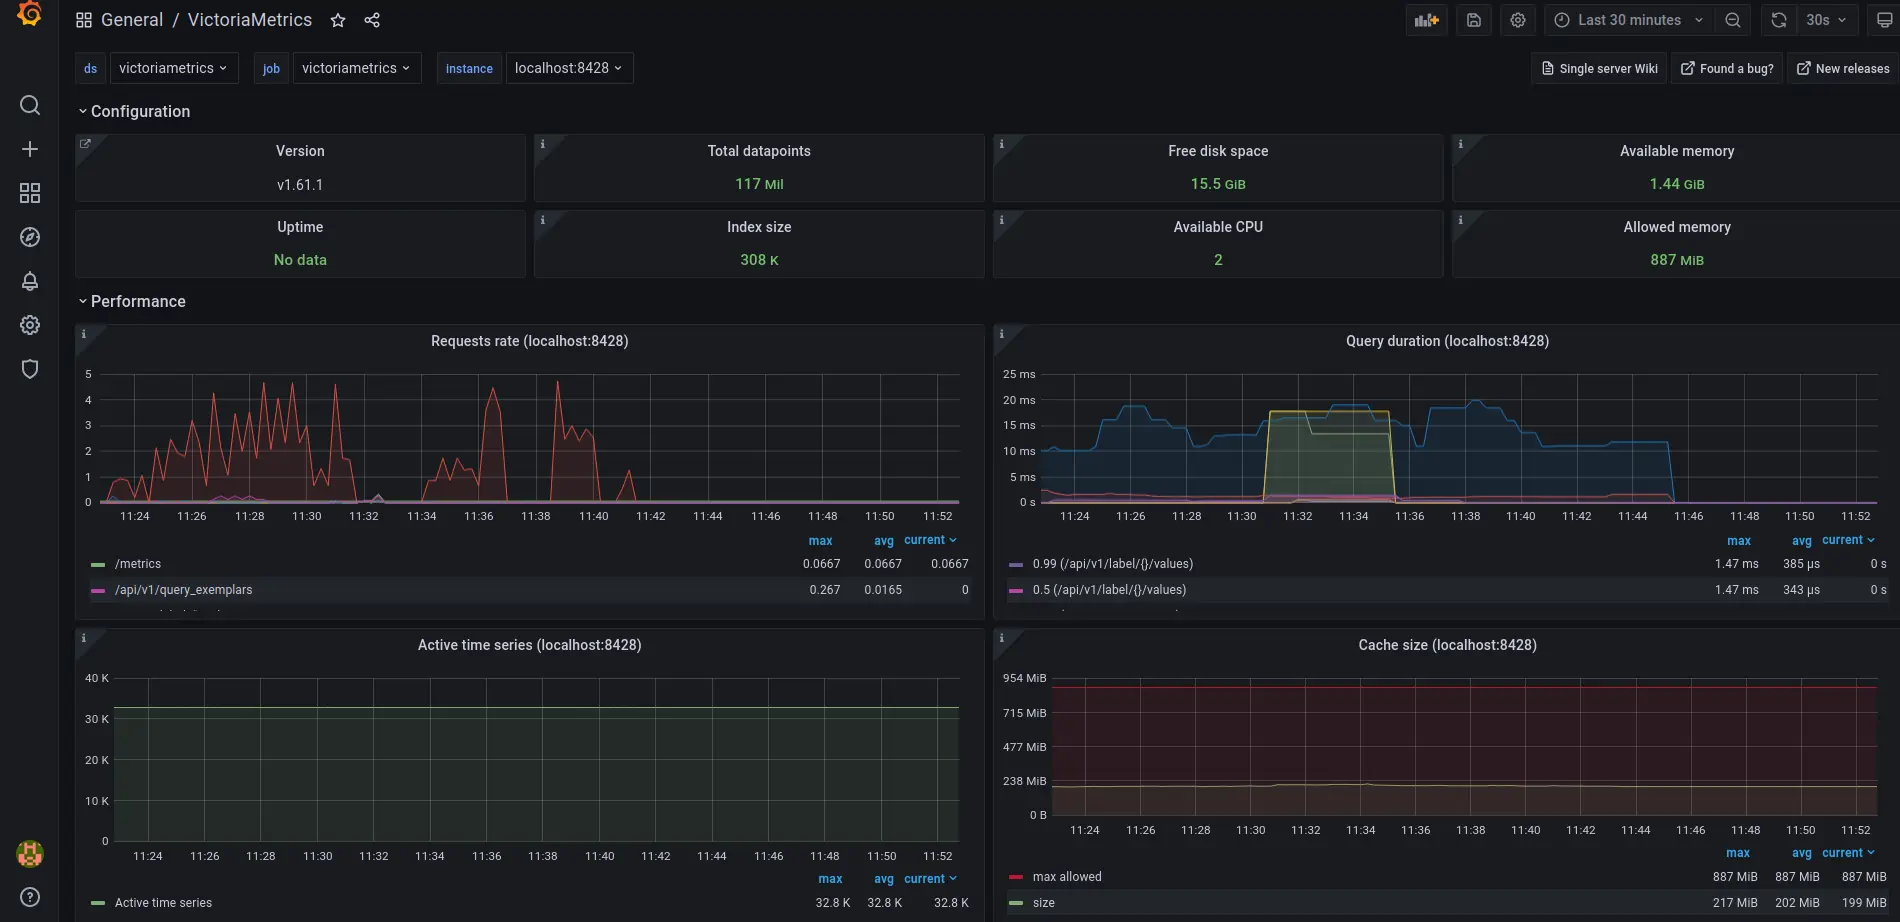
The VictoriaMetrics dashboard shows metrics on telemetry ingestion and resource utilization:
5. Final thoughts #
- You now have a time series database for your Kubernetes cluster.
- VictoriaMetrics continuously collects and stores metrics from all running pods and nodes.
- Grafana dashboards give you a visual view of cluster resources.
Consider reading these resources to complete your setup: