Headlamp is a user-friendly Kubernetes UI with a built-in Prometheus plugin that can show metrics from VictoriaMetrics.
This guide shows how to point Headlamp’s Prometheus integration at VictoriaMetrics single node or VictoriaMetrics cluster to display CPU, memory, network, and filesystem graphs for your Kubernetes resources directly in the UI.
1. Install VictoriaMetrics #
VictoriaMetrics must be running in your Kubernetes cluster.
This guide is compatible with both single-node and cluster versions of VictoriaMetrics.
Once VictoriaMetrics is running, note the NAME, PORT, and the namespace where the service is running.
For the single-node version:
      kubectl get svc -l app.kubernetes.io/instance=vmsingle

NAME                                      TYPE        CLUSTER-IP   EXTERNAL-IP   PORT(S)    AGE
vmsingle-victoria-metrics-single-server   ClusterIP   None         <none>        8428/TCP   15m
For the cluster version:
      kubectl get svc -l app=vmselect

NAME                                          TYPE        CLUSTER-IP     EXTERNAL-IP   PORT(S)    AGE
vmcluster-victoria-metrics-cluster-vmselect   ClusterIP   10.43.41.195   <none>        8481/TCP   2m2s
2. Configure Headlamp #
You can run Headlamp as a desktop application or as an in-cluster service .
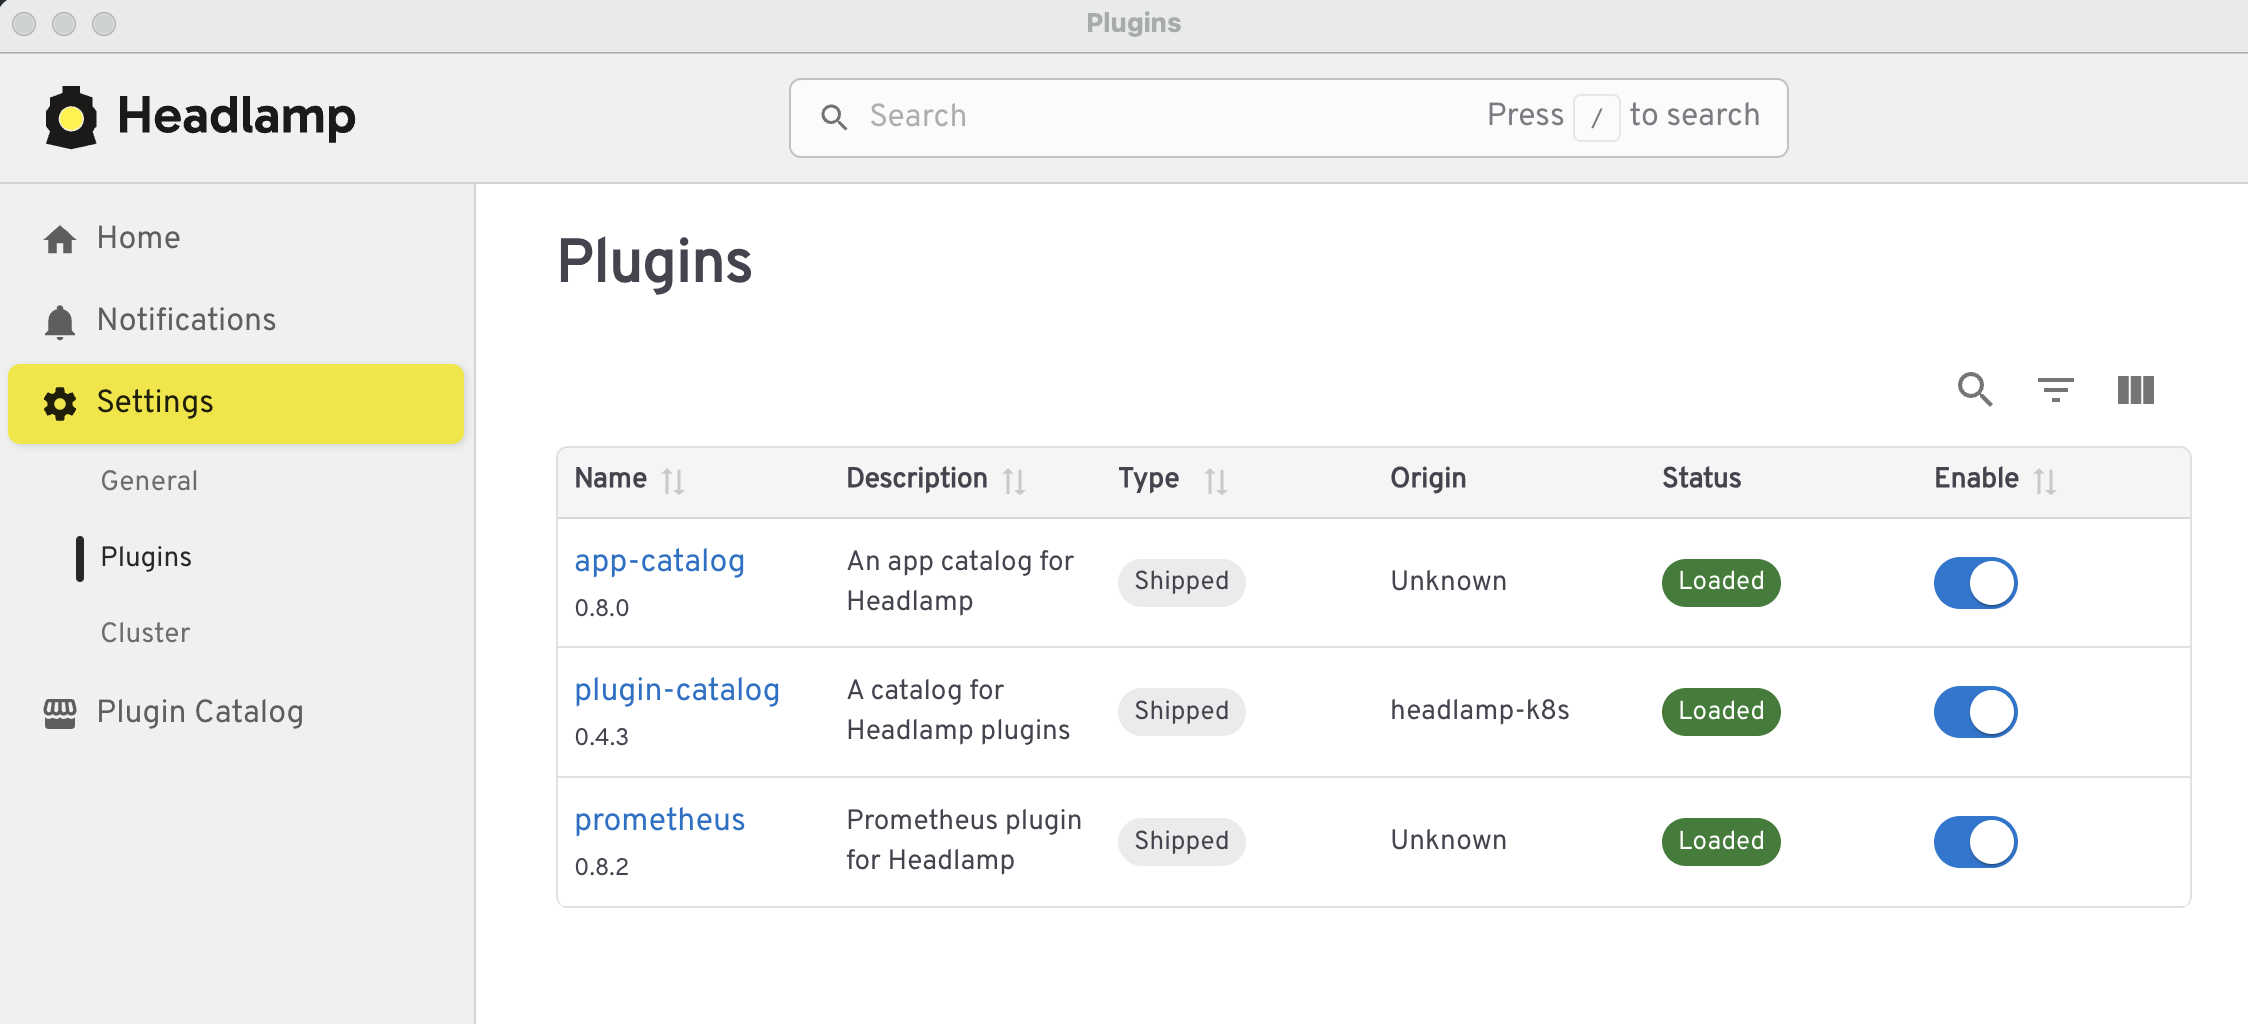
To configure the Prometheus plugin, go to Settings > Plugins and select Prometheus.
Ensure Enable metrics is activated and Auto-detect is disabled.
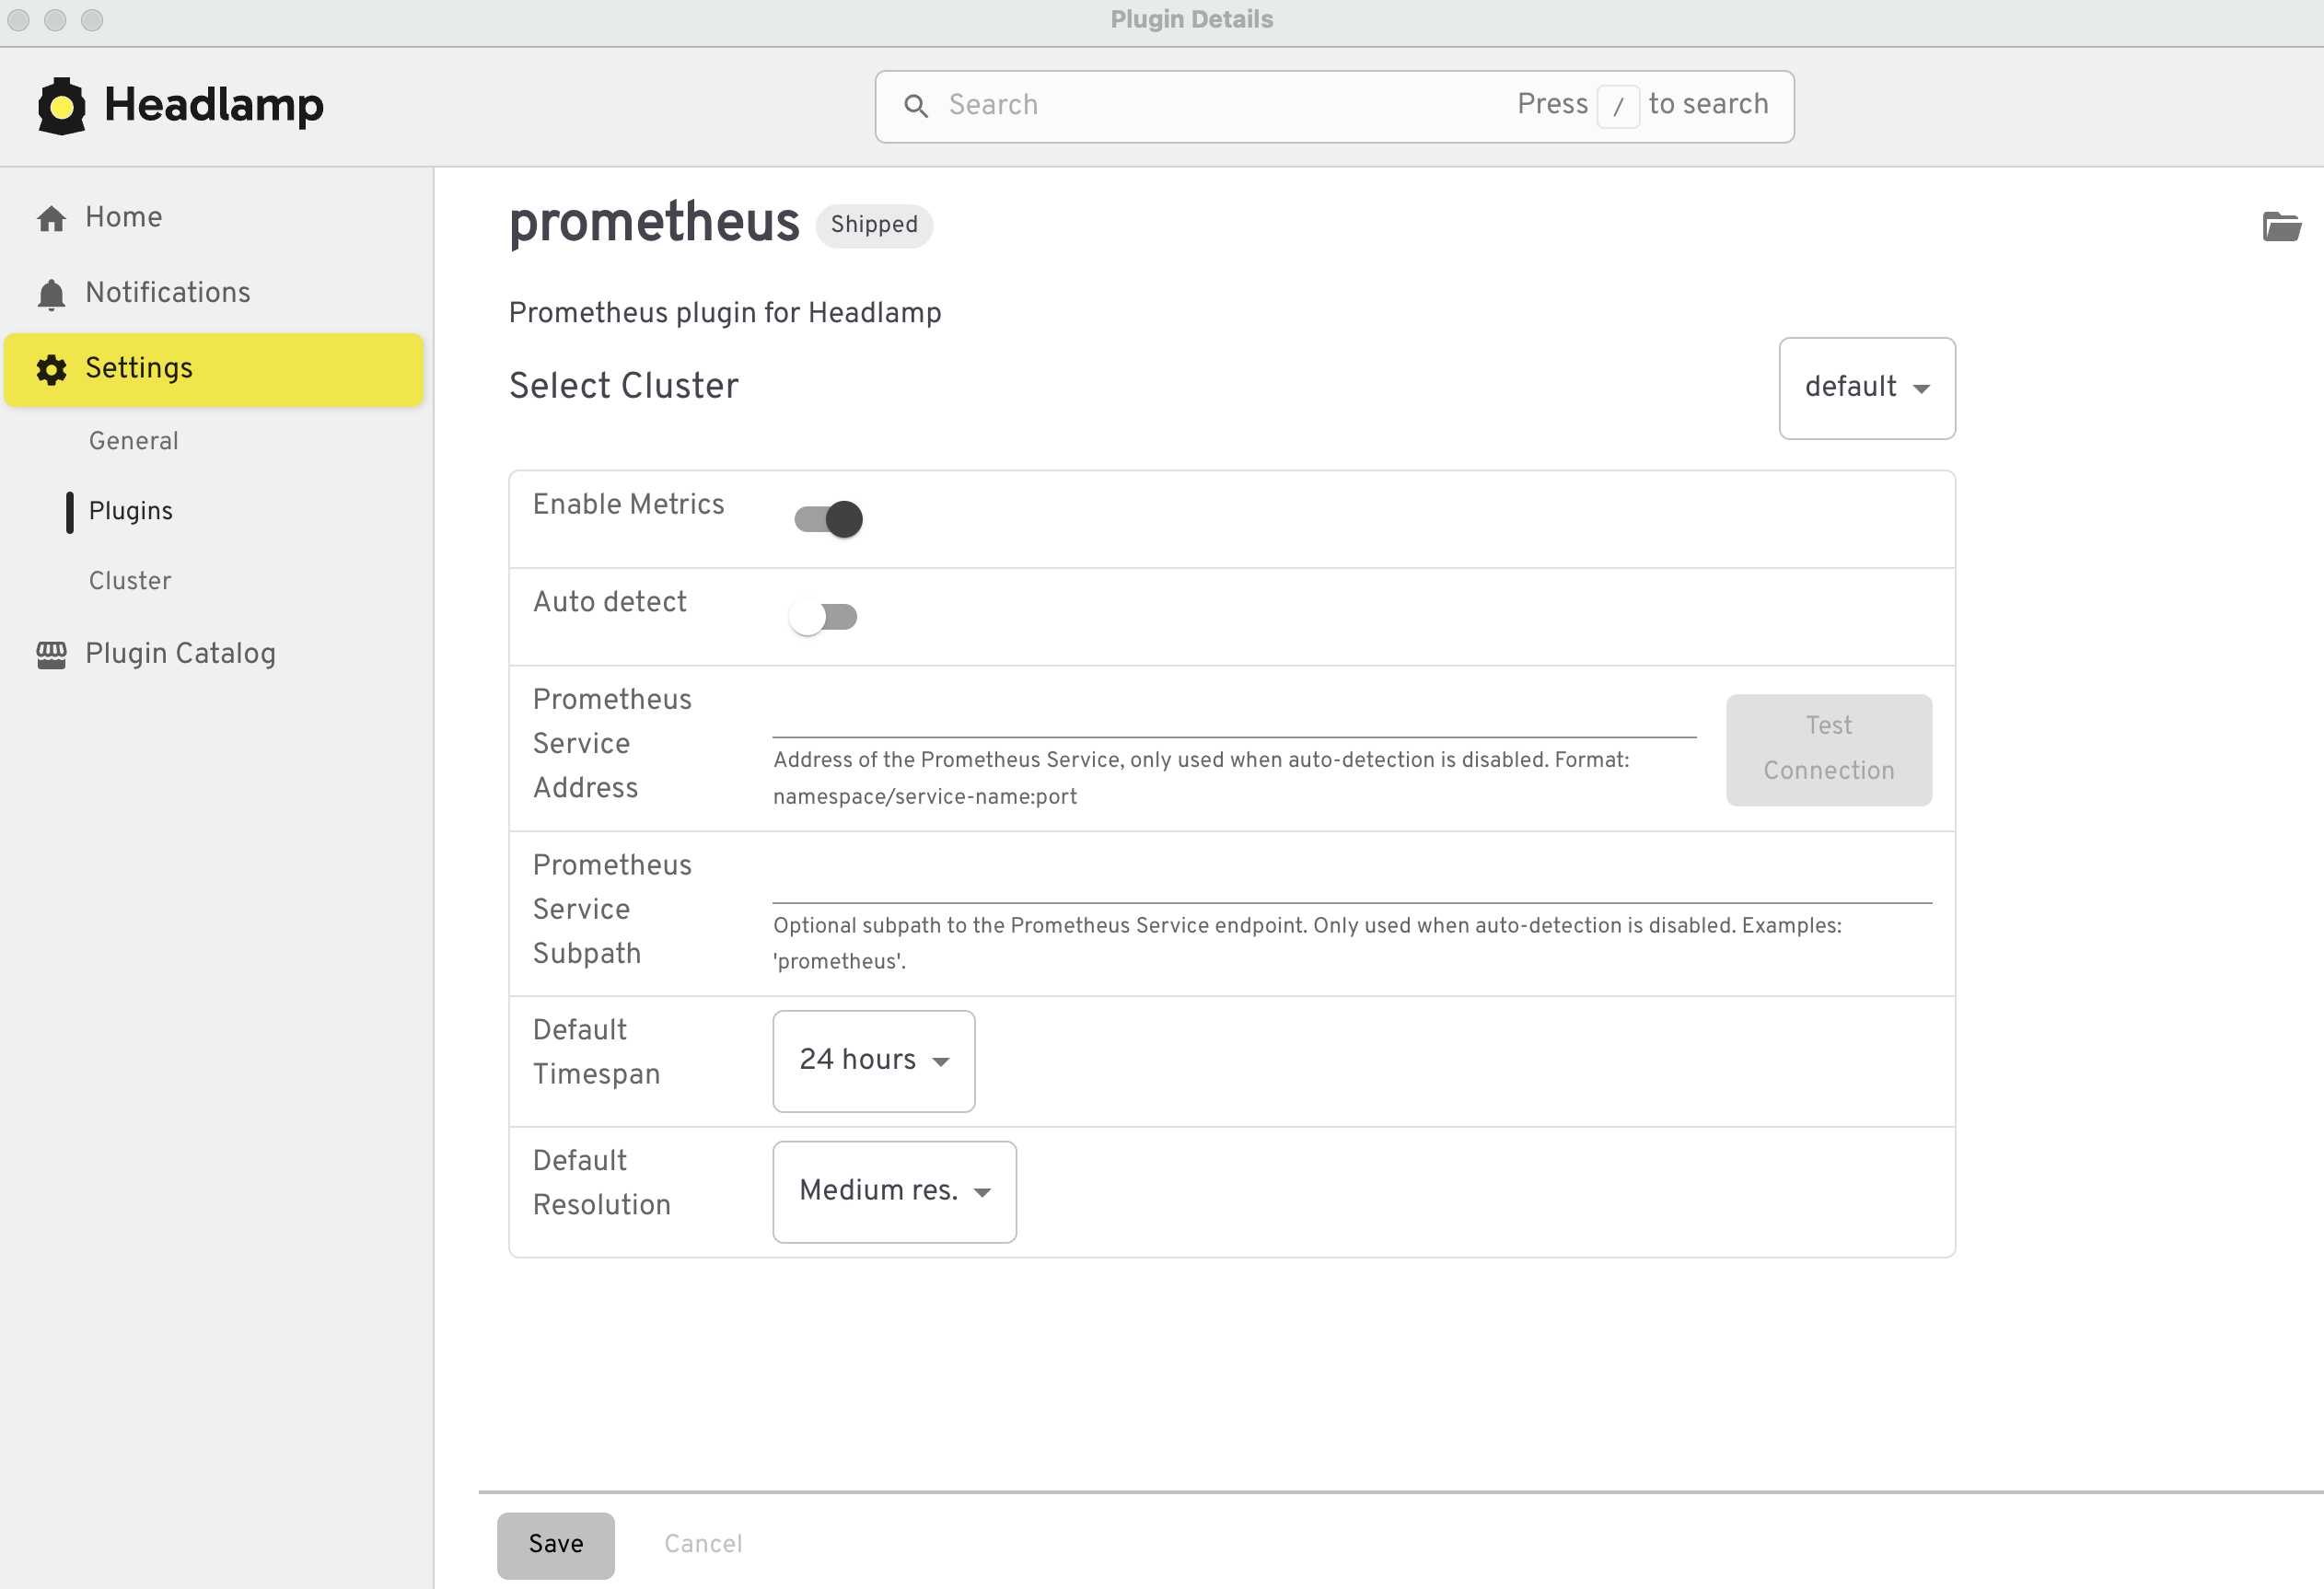
Fill in the Prometheus Service Address in the following format:
namespace/service-name:port
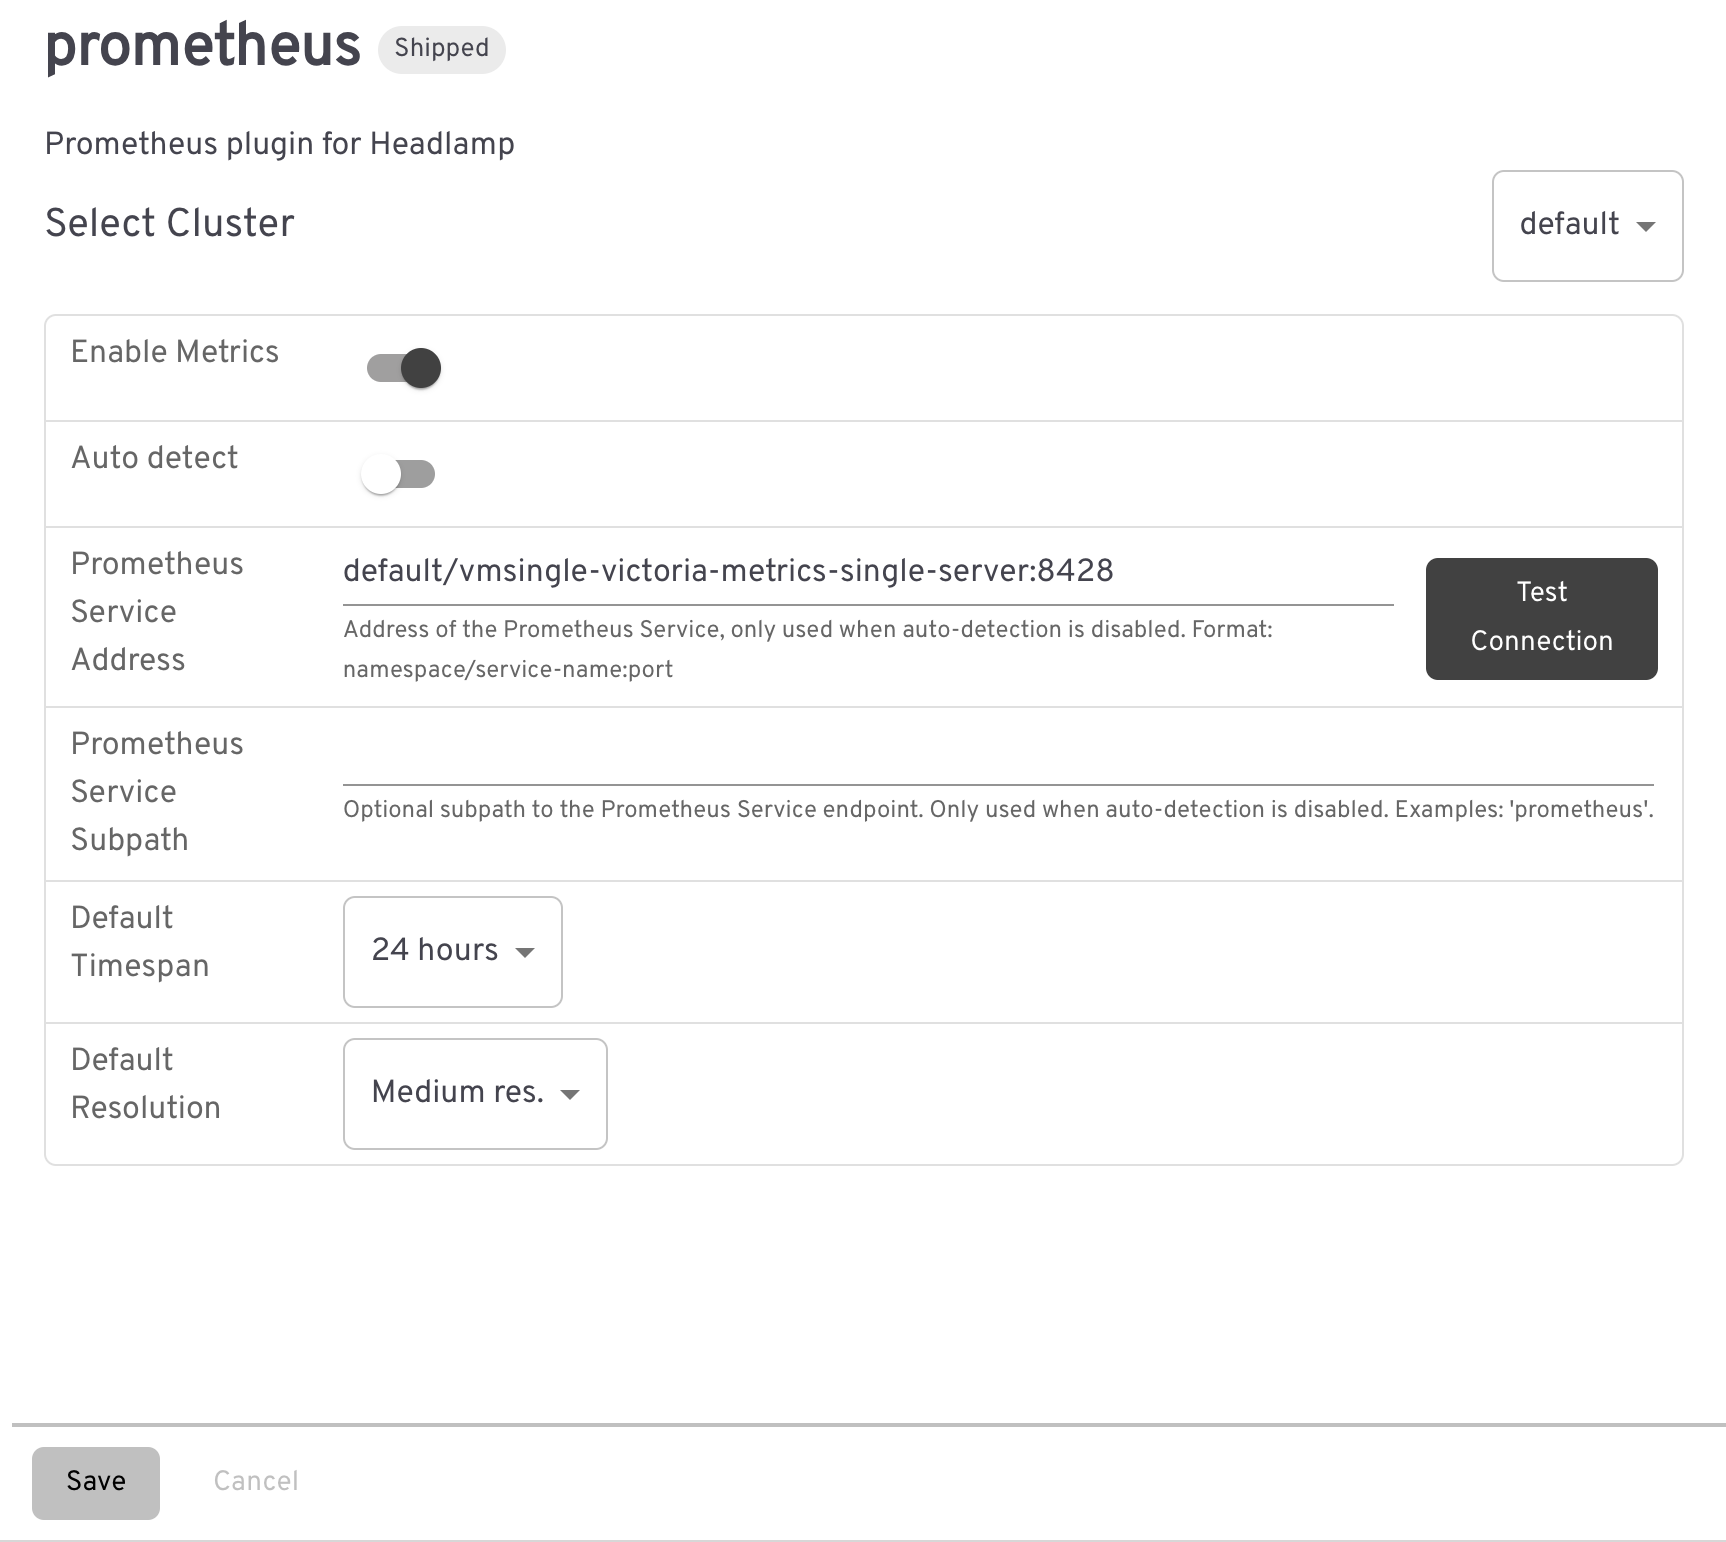
For example, in the single-node version running in the default namespace, the address looks like:
default/vmsingle-victoria-metrics-single-server:8428
For the cluster version, the address looks like:
default/vmcluster-victoria-metrics-cluster-vmselect:8481
In addition, only for the cluster version, you must fill in the following path in Prometheus service subpath, where 0 is the default
Tenant ID
:
/select/0/prometheus
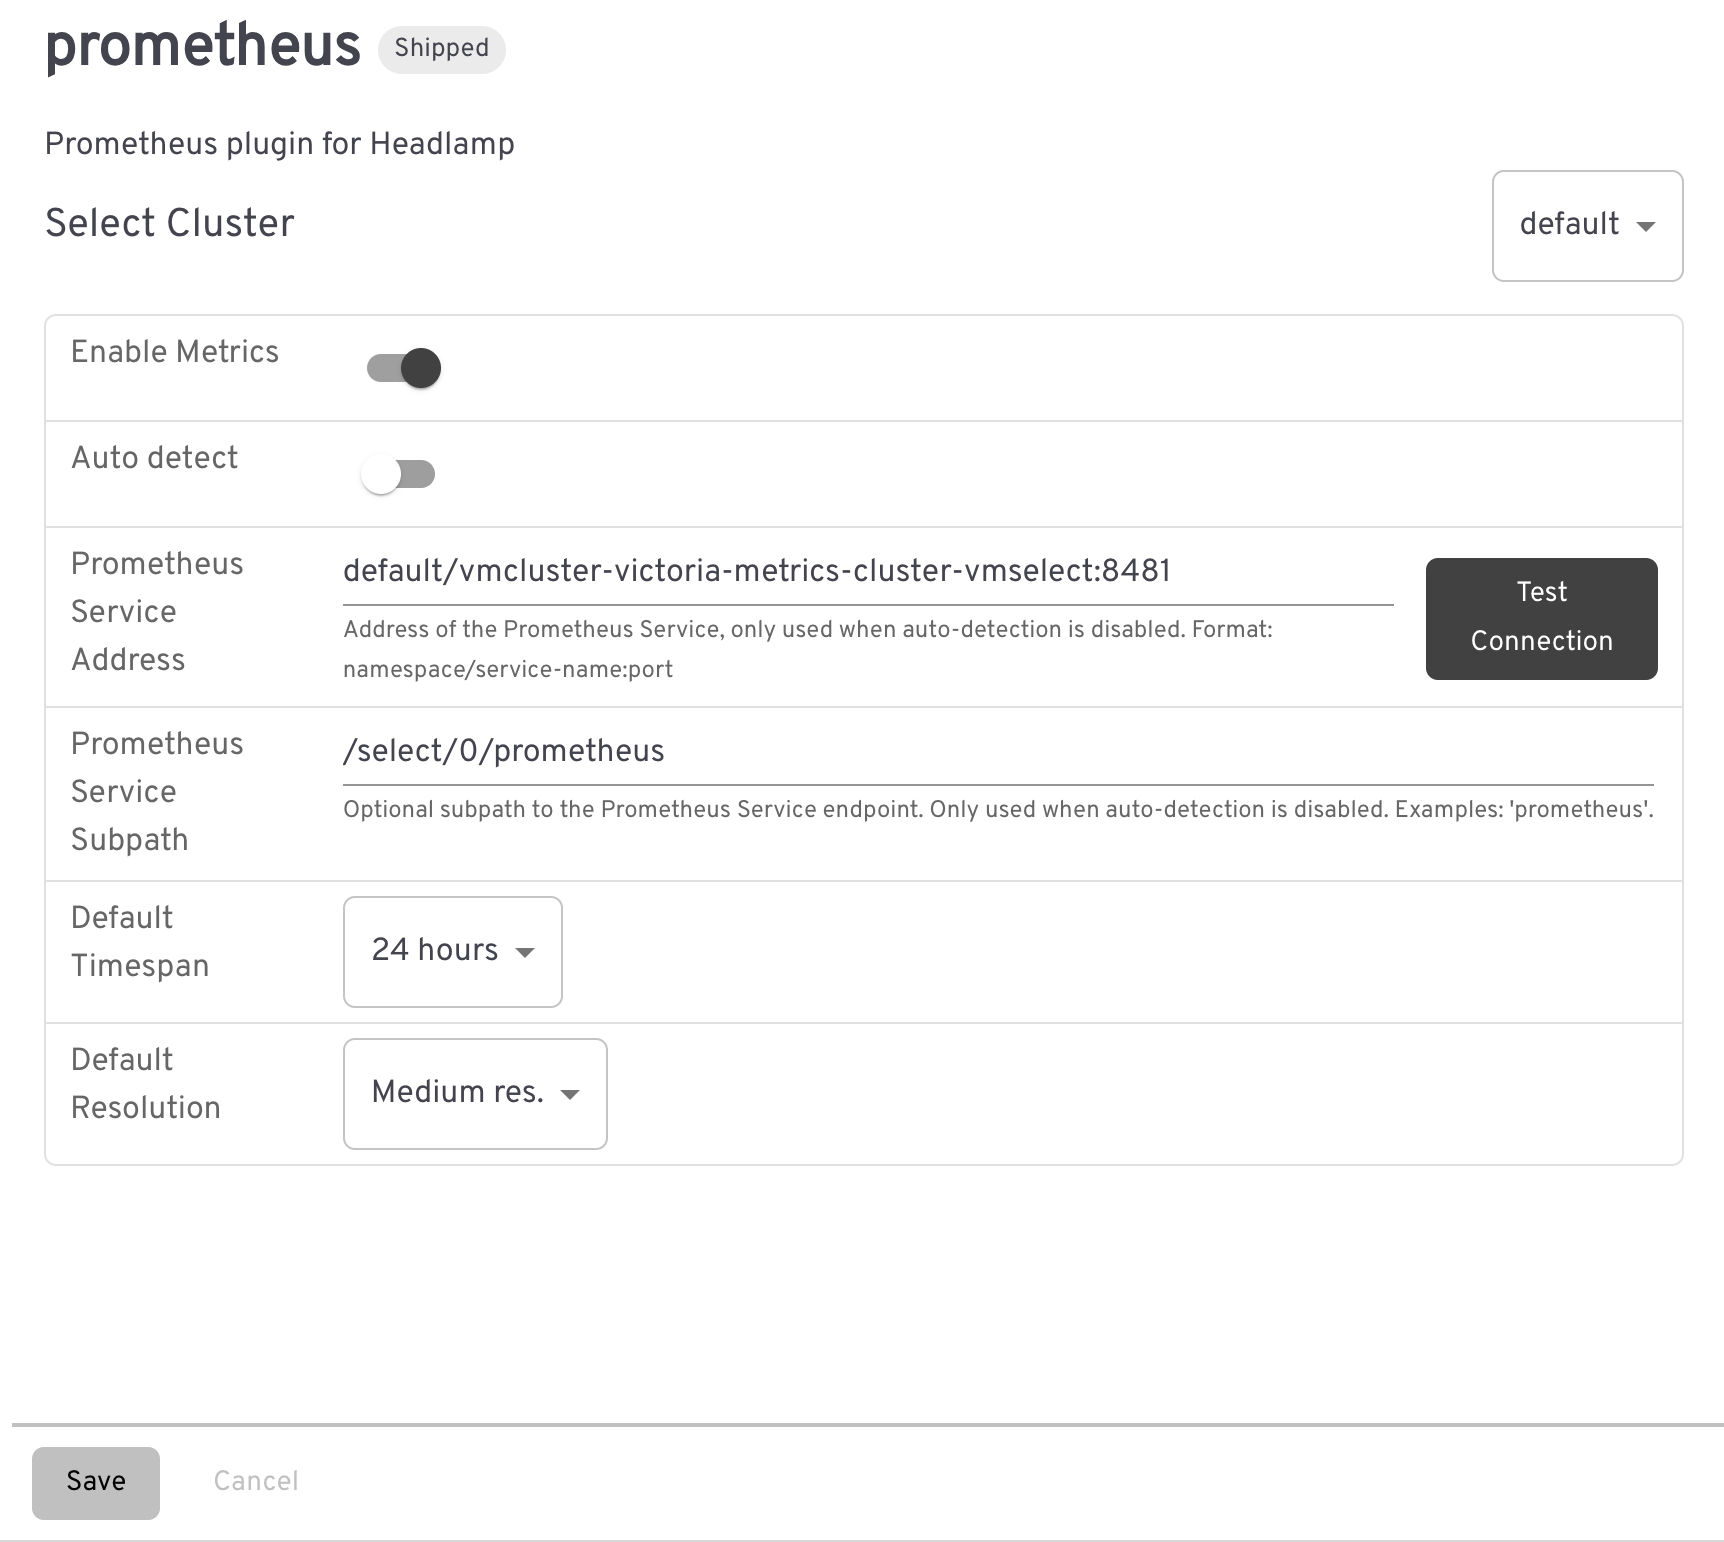
Press Save to confirm your changes.
The Test Connection button does not work with VictoriaMetrics. You can ignore this error; metrics should still be displayed correctly in Headlamp.
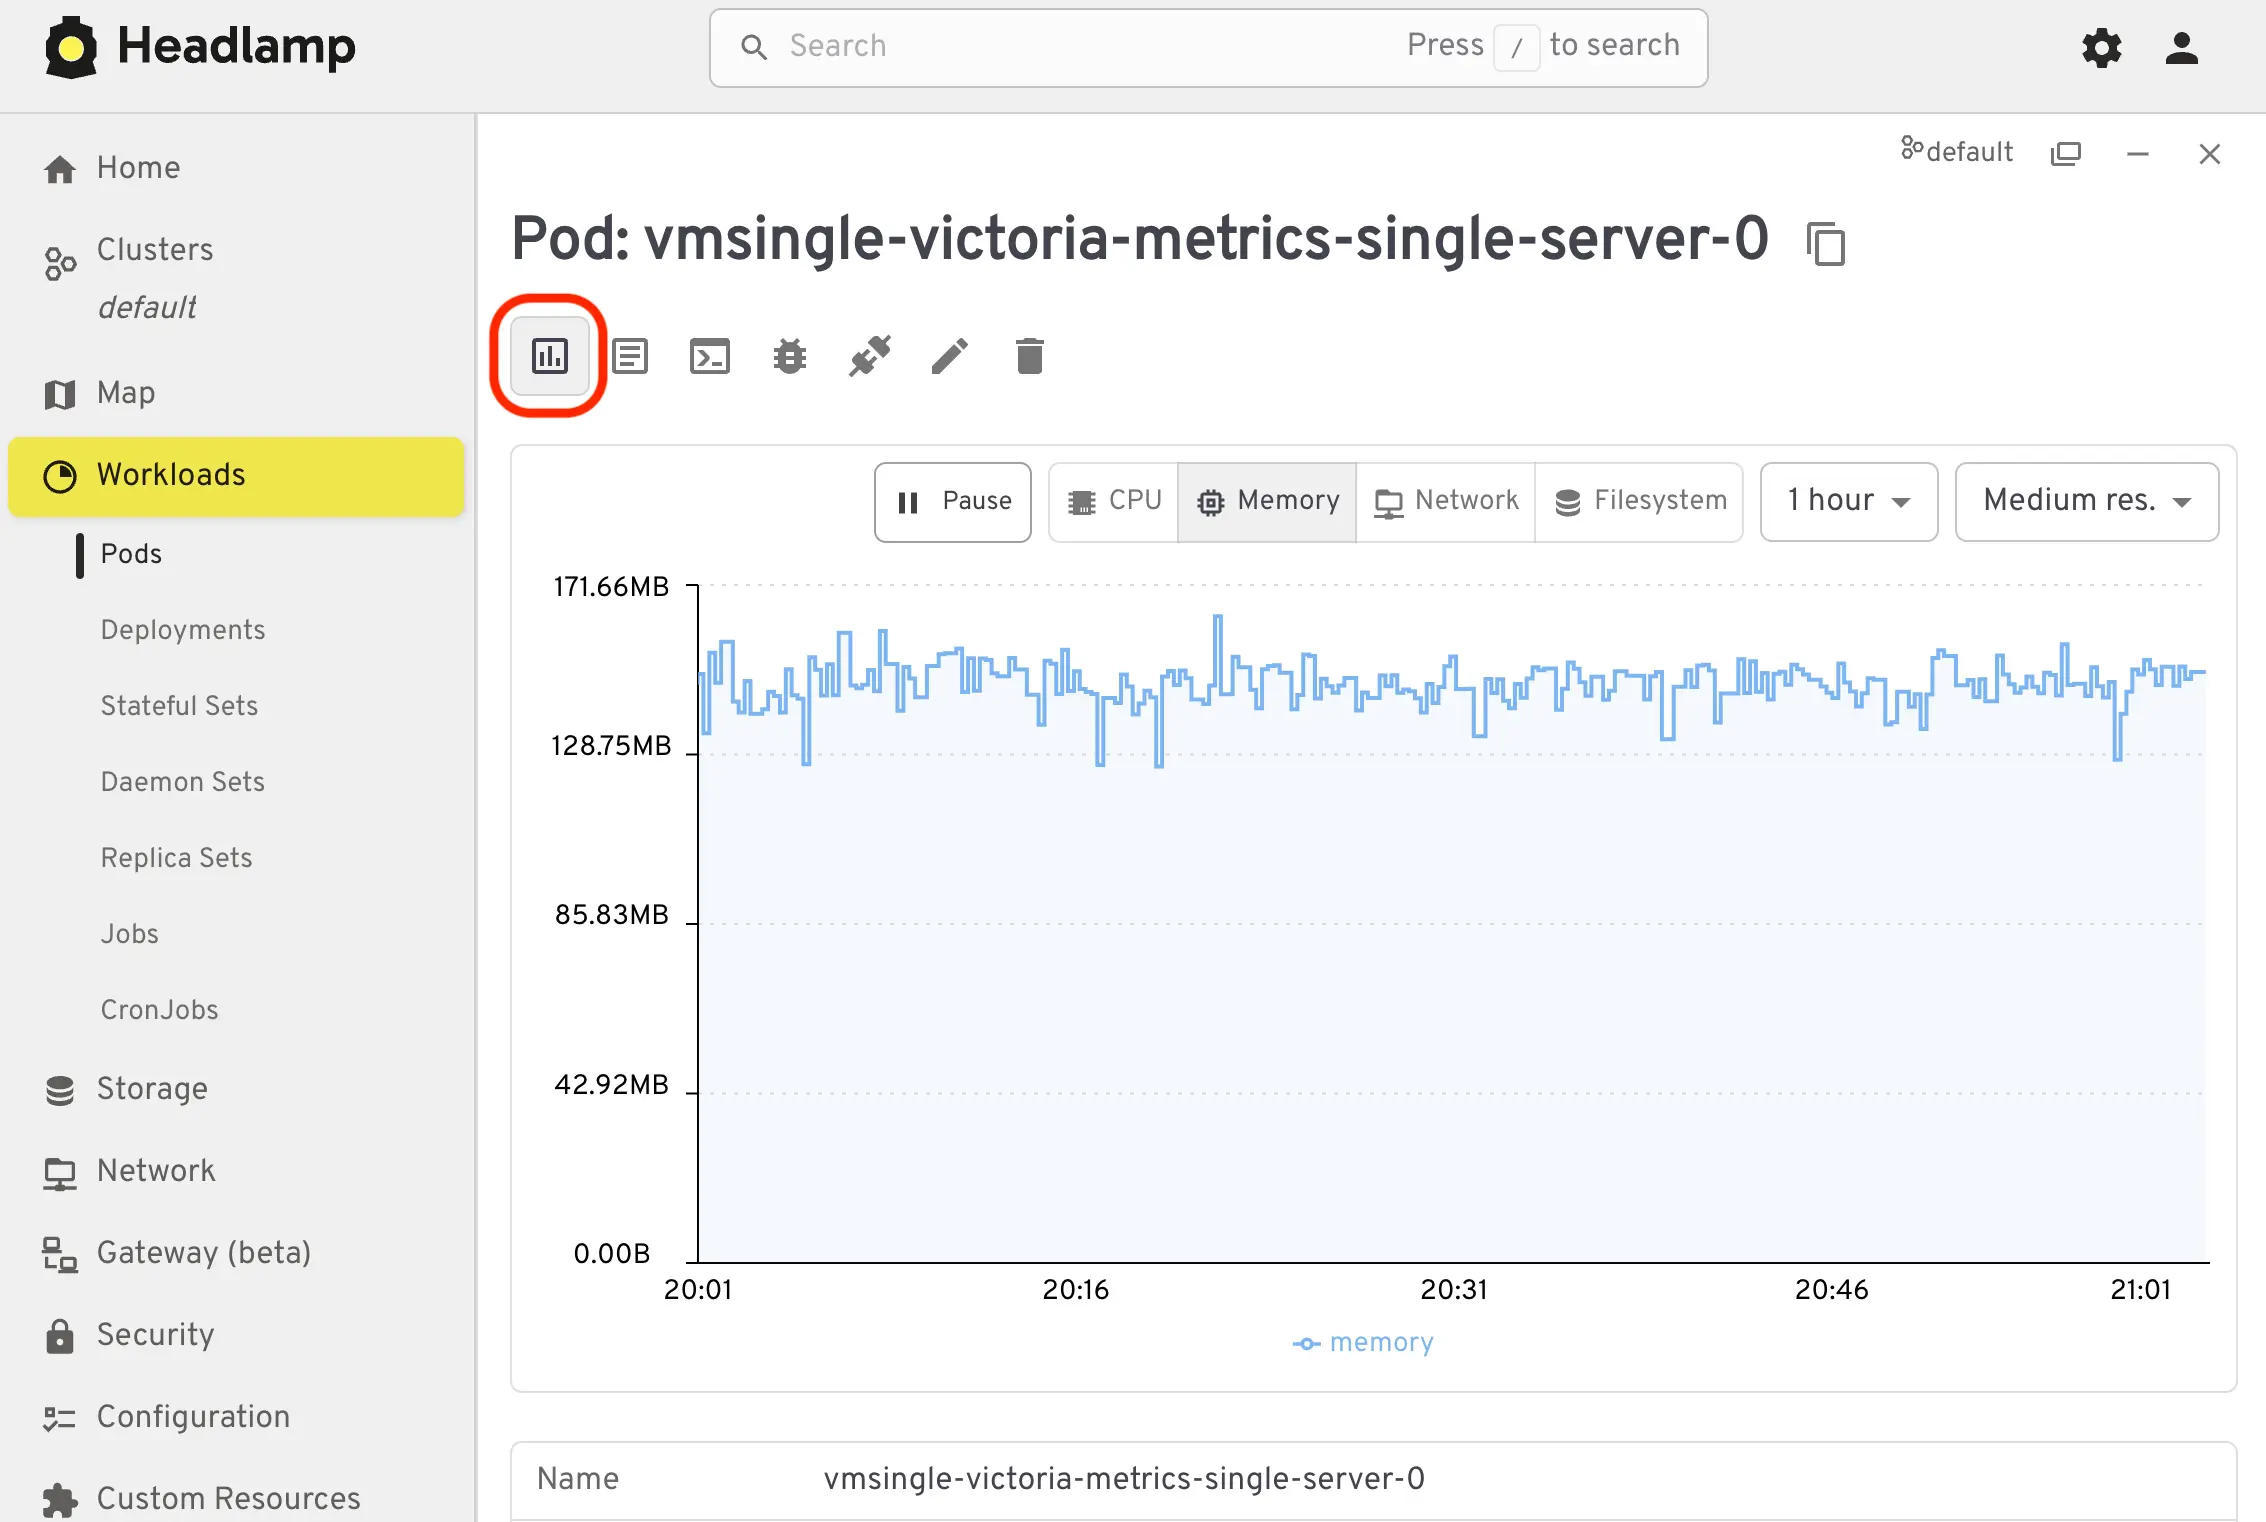
You should now find the Show Prometheus metrics option on several pages.