InfluxDB is a well-known time series database built for IoT monitoring, Application Performance Monitoring (APM) and analytics. It has its query language, unique data model, and rich tooling for collecting and processing metrics.
VictoriaMetrics is a high-performance opensource time series database specifically designed to deal with huge volumes of monitoring data while remaining cost-efficient at the same time. Many companies are choosing to migrate from InfluxDB to VictoriaMetrics specifically for performance and scalability reasons. Along them see case studies provided by ARNES and Brandwatch .
This guide covers the differences between two solutions, most commonly asked questions, and approaches for migrating from InfluxDB to VictoriaMetrics.
Data model differences #
Readers are familiar with InfluxDB key concepts . The data model of VictoriaMetrics is explained here . Let’s list similarities and differences:
- both databases are schemaless, which means there is no need to define metrics or their tags in advance;
- multidimensional data support is implemented via tags in InfluxDB and via labels in VictoriaMetrics. However, labels in VictoriaMetrics are always strings , while InfluxDB supports many data types;
- timestamps are stored with nanosecond resolution in InfluxDB, while in VictoriaMetrics it is milliseconds;
- in VictoriaMetrics metric value is always float64 , while InfluxDB supports multiple data types.
- there are no measurements or fields in VictoriaMetrics, metric name contains it all. If measurement contains more than 1 field, then for VictoriaMetrics it will be multiple metrics;
- there are no databases , buckets or organizations . All data in VictoriaMetrics is stored in a global namespace or within a tenant .
- VictoriaMetrics query language is MetricsQL . Influx has multiple versions of query languages. VictoriaMetrics doesn’t support any of them.
Let’s consider the following sample data borrowed from InfluxDB docs as an example:
| _measurement | _field | location | scientist | _value | _time |
|---|---|---|---|---|---|
| census | bees | klamath | anderson | 23 | 2019-08-18T00:00:00Z |
| census | ants | portland | mullen | 30 | 2019-08-18T00:00:00Z |
| census | bees | klamath | anderson | 28 | 2019-08-18T00:06:00Z |
| census | ants | portland | mullen | 32 | 2019-08-18T00:06:00Z |
In VictoriaMetrics data model it will have the following form:
| metric name | labels | value | time |
|---|---|---|---|
| census_bees | {location=“klamath”, scientist=“anderson”} | 23 | 2019-08-18T00:00:00Z |
| census_ants | {location=“portland”, scientist=“mullen”} | 30 | 2019-08-18T00:00:00Z |
| census_bees | {location=“klamath”, scientist=“anderson”} | 28 | 2019-08-18T00:06:00Z |
| census_ants | {location=“portland”, scientist=“mullen”} | 32 | 2019-08-18T00:06:00Z |
Actually, metric name for VictoriaMetrics is also a label with static name __name__, and example above can be
converted to {__name__="census_bees", location="klamath", scientist="anderson"}. All labels are automatically indexed
by VictoriaMetrics, so lookups by names or labels have the same query speed.
Write data #
VictoriaMetrics supports InfluxDB line protocol for data ingestion. For example, to write a measurement to VictoriaMetrics we need to send an HTTP POST request with payload in a line protocol format:
curl -d 'census,location=klamath,scientist=anderson bees=23' -X POST 'http://<victoriametrics-addr>:8428/write'
An arbitrary number of lines delimited by \n (aka newline char) can be sent in a single request.
To check the written data export series matching the location="klamath" filter:
curl -G 'http://<victoriametrics-addr>:8428/api/v1/export' -d 'match={location="klamath"}'
The expected response is the following:
      {
  "metric": {
    "__name__": "census_bees",
    "location": "klamath",
    "scientist": "anderson"
  },
  "values": [
    23
  ],
  "timestamps": [
    1566079200000
  ]
}
VictoriaMetrics performs additional data mapping to the data ingested via InfluxDB line protocol.
VictoriaMetrics is also compatible with Telegraf
.
To make Telegraf sending data, simply add http://<victoriametric-addr>:8428 URL to Telegraf configs:
      [[outputs.influxdb]]
  urls = ["http://<victoriametrics-addr>:8428"]
In addition to InfluxDB line protocol, VictoriaMetrics supports many other ways for metrics collection .
Query data #
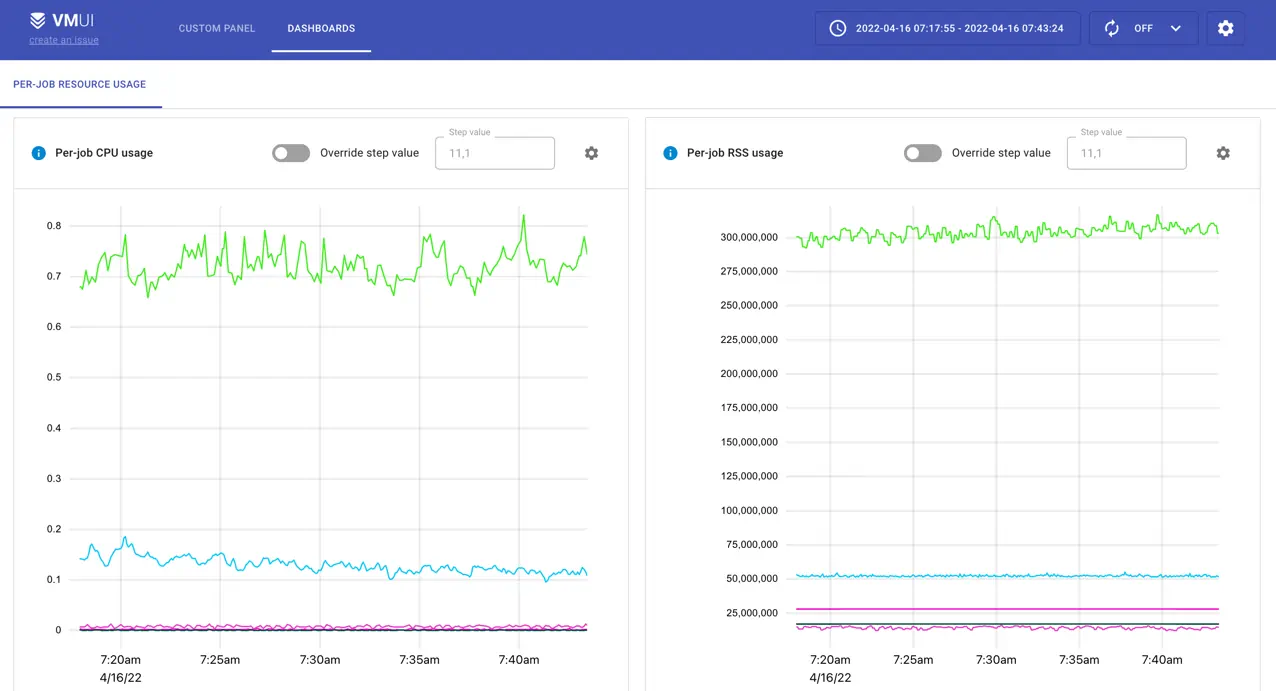
VictoriaMetrics does not have a command-line interface (CLI). Instead, it provides VMUI - a graphical User Interface for querying and visualizing metrics:
VictoriaMetrics can be configured as Grafana datasource . See more about how to query data in VictoriaMetrics .
Basic concepts #
Let’s use the following data sample:
      foo,instance=localhost bar=1.00 1652169600000000000
foo,instance=localhost bar=2.00 1652169660000000000
foo,instance=localhost bar=3.00 1652169720000000000
foo,instance=localhost bar=5.00 1652169840000000000
foo,instance=localhost bar=5.50 1652169960000000000
foo,instance=localhost bar=5.50 1652170020000000000
foo,instance=localhost bar=4.00 1652170080000000000
foo,instance=localhost bar=3.50 1652170260000000000
foo,instance=localhost bar=3.25 1652170320000000000
foo,instance=localhost bar=3.00 1652170380000000000
foo,instance=localhost bar=2.00 1652170440000000000
foo,instance=localhost bar=1.00 1652170500000000000
foo,instance=localhost bar=4.00 1652170560000000000
This data sample consists of data points for a measurement foo and a field bar with additional
tag instance=localhost. If we would like plot this data as a time series in Grafana it might have the following look:

The query used for this panel is written in InfluxQL :
      SELECT last ("bar")
FROM "foo"
WHERE ("instance" = 'localhost')
  AND $timeFilter
GROUP BY time (1m)
Now, let’s import the same data sample in VictoriaMetrics and plot it in Grafana. To understand how the InfluxQL query might be translated to MetricsQL let’s break it into components first:
SELECT last("bar") FROM "foo"- all requests to instant or range VictoriaMetrics APIs are reads, so no need to specify theSELECTstatement. There are nomeasurementsorfieldsin VictoriaMetrics, so the whole expression can be replaced withfoo_barin MetricsQL;WHERE ("instance" = 'localhost')- filtering by labels in MetricsQL requires specifying the filter in curly braces next to the metric name. So in MetricsQL filter expression will be translated to{instance="localhost"};WHERE $timeFilter- filtering by time is done via request params sent along with query, so in MetricsQL no need to specify this filter;GROUP BY time(1m)- grouping by time is done by default in range API according to specifiedstepparam. This param is also a part of params sent along with request. See how to perform additional aggregations and grouping via MetricsQL .
In result, the MetricsQL expression will have the following form: foo_bar{instance="localhost"}.
See its result executed with step=1m for the same set of data in Grafana below:
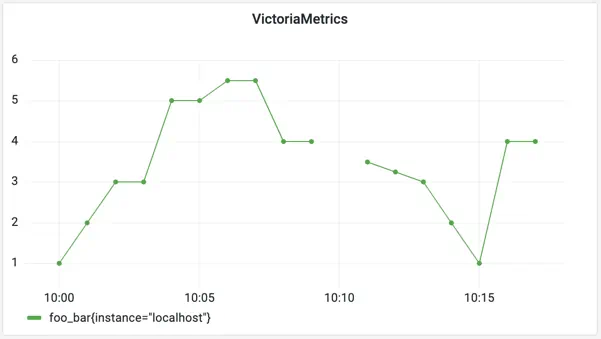
Visualizations from both databases are a bit different - VictoriaMetrics shows some extra points filling the gaps in the graph.
This behavior is described in more detail
here
.
In InfluxDB, we can achieve a similar behavior by adding fill(previous) to the query.
VictoriaMetrics fills the gaps on the graph assuming time series are always continuous and not discrete.
To limit the interval on which VictoriaMetrics will try to fill the gaps, set -search.setLookbackToStep
command-line flag. This limits the gap filling to a single step interval passed to
/api/v1/query_range
.
Advanced usage #
The good thing is that knowing the basics is often enough for using MetricsQL. Let’s consider one of the most popular Grafana dashboards Node Exporter Full . It has almost 15 million downloads and about 230 queries in it! But a closer look at those queries shows the following:
- ~120 queries are just selecting a metric with label filters, e.g.
node_textfile_scrape_error{instance="$node",job="$job"}; - ~80 queries are using
rate
function for selected metric,
e.g.
rate(node_netstat_Tcp_InSegs{instance="$node",job="$job"}[5m]) - and the rest are aggregation functions like sum or count .
To get a better understanding of how MetricsQL works, see the following resources:
How to migrate current data from InfluxDB to VictoriaMetrics #
Migrating data from other databases to VictoriaMetrics is as simple as importing data via any of supported ingestion formats .
But migration from InfluxDB might get easier with vmctl . See more about migrating from InfluxDB v1.x versions . Migrating data from InfluxDB v2.x is not supported. But there is a useful 3rd party solution for this.
Please note, data migration is a backfilling process, so read about backfilling tips .
Frequently asked questions #
- How does VictoriaMetrics compare to InfluxDB?
- Why don’t VictoriaMetrics support Remote Read API, so I don’t need to learn MetricsQL?
- PromQL and MetricsQL are often mentioned together - why is that?
- MetricsQL - query language inspired by PromQL. MetricsQL is backward-compatible with PromQL, so Grafana dashboards backed by Prometheus datasource should work the same after switching from Prometheus to VictoriaMetrics. Both languages share the same concepts with slight differences.
- Query returns more data points than expected - why?
- VictoriaMetrics may return non-existing data points if
stepparam is lower than the actual data resolution. See more about this here .
- VictoriaMetrics may return non-existing data points if
- How do I get the
reallast data point?- last_over_time
function returns last value on
the given look-behind window. For example,
last_over_time(metric[10s])would return sample values only if the real samples are located closer than 10 seconds to the calculated timestamps according tostart,endandstepquery args passed to range query . - tlast_over_time function returns last timestamp on the given look-behind window, similarly to last_over_time .
- last_over_time
function returns last value on
the given look-behind window. For example,
- How do I get raw data points with MetricsQL?
- For getting raw data points specify the interval at which you want them in square brackets and send
as
instant query
. For
example,
GET api/v1/query?query=my_metric[5m]&time=<time>will return raw samples formy_metricin interval from<time>to<time>-5m.
- For getting raw data points specify the interval at which you want them in square brackets and send
as
instant query
. For
example,
- Can you have multiple aggregators in a MetricsQL query, e.g.
SELECT MAX(field), MIN(field) ...?- Yes, try the following query
( alias(max(field), "max"), alias(min(field), "min") ).
- Yes, try the following query
- How to translate Influx
percentilefunction to MetricsQL? - How to translate Influx
stddevfunction to MetricsQL?