VictoriaMetrics software provides native OpenTelemetry ingestion across metrics, logs, and traces via dedicated components. This allows running OpenTelemetry-based observability pipeline with VictoriaMetrics software as your backend.
VictoriaMetrics provides a dedicated database for each signal type :
- VictoriaMetrics for Metrics ;
- VictoriaLogs for Logs ;
- VictoriaTraces for Traces .
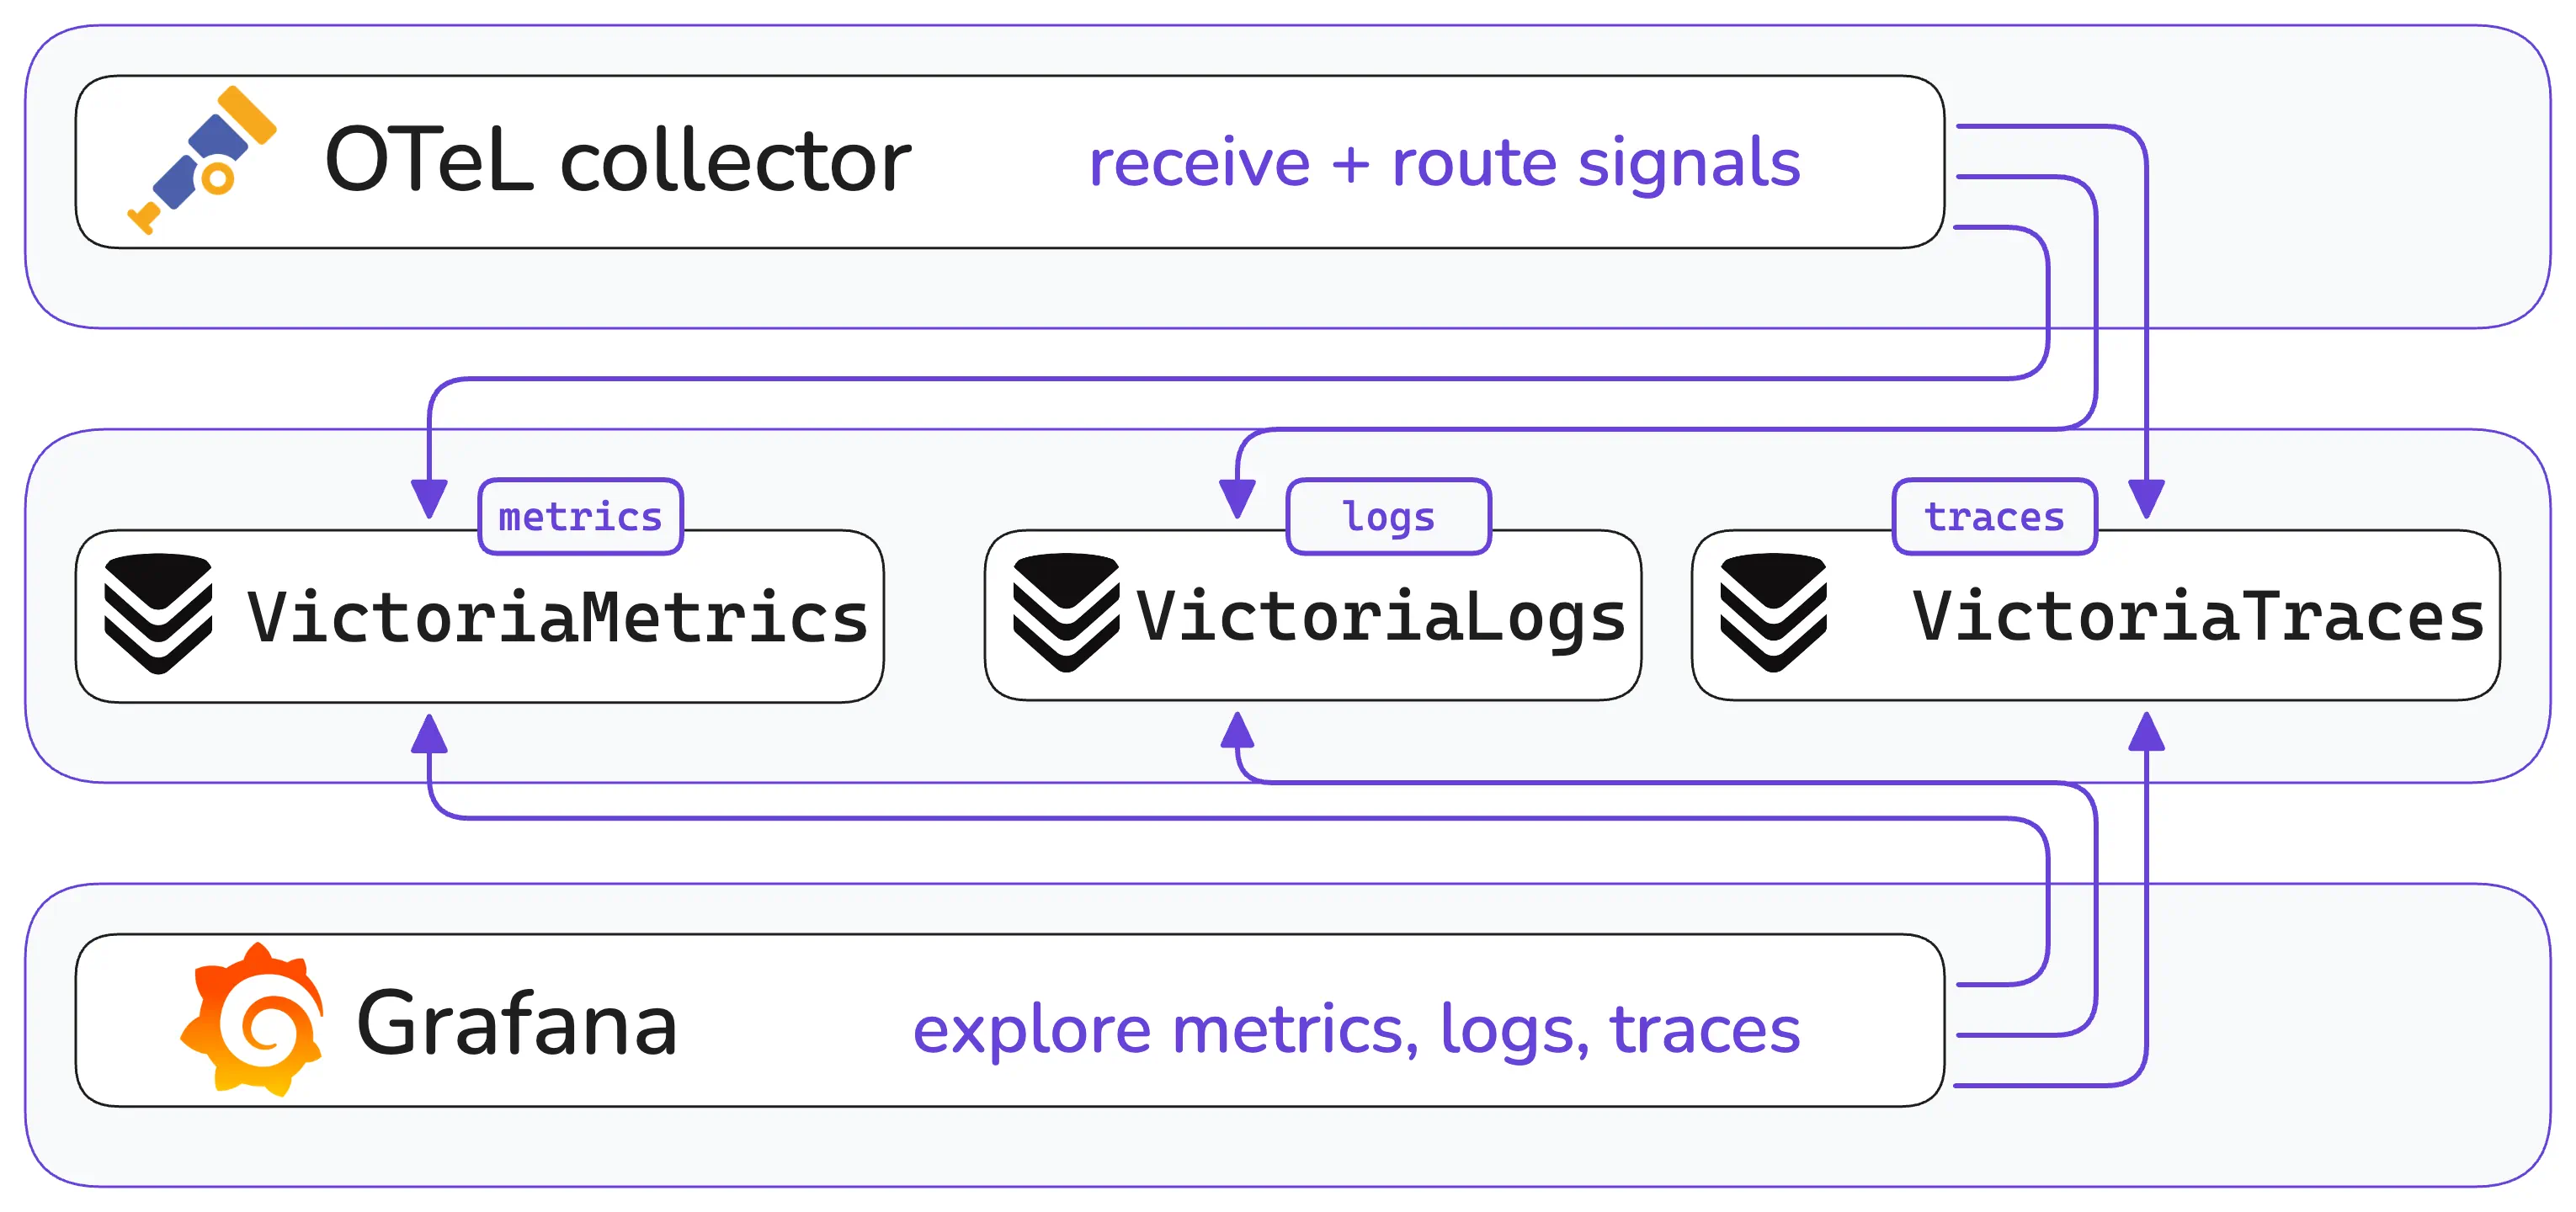
Each database is optimized for its own signal and usage scenario to improve maintainability and efficiency.
Resources:
- OpenTelemetry Astronomy Shop demo with integrated VictoriaMetrics backends.
- Live Grafana Playground with OTeL demo and VictoriaMetrics components.
- Full-Stack Observability with VictoriaMetrics in the OTel Demo blogpost.
Metrics (VictoriaMetrics) #
VictoriaMetrics single-node, vmagent and vminsert components support ingestion of metrics via OpenTelemetry Protocol (OTLP) from OpenTelemetry Collector and applications instrumented with OpenTelemetry SDKs .
See the detailed description about protocol support here .
See a practical guide How to use OpenTelemetry metrics with VictoriaMetrics .
Once metrics are ingested into VictoriaMetrics, they can be read via the following tools:
- vmui - VictoriaMetrics User Interface for ad-hoc queries and data exploration.
- Grafana - integrates with VictoriaMetrics using Prometheus datasource or VictoriaMetrics datasource plugins.
- Perses - integrates with VictoriaMetrics via Prometheus plugins .
- vmalert - is an alerting tool for VictoriaMetrics. It executes a list of the given alerting or recording rules and sends notifications to Alertmanager.
Logs (VictoriaLogs) #
VictoriaLogs single-node, vlagent and vlinsert components support ingestion of logs via OpenTelemetry Protocol (OTLP) from OpenTelemetry Collector and applications instrumented with OpenTelemetry SDKs .
See the detailed description about protocol support here .
See a practical guide How to use OpenTelemetry metrics with VictoriaLogs .
Once logs are ingested into Victorialogs, they can be read via the following tools:
- vmui - VictoriaLogs User Interface for ad-hoc queries and data exploration.
- Grafana - integrates with VictoriaLogs using VictoriaLogs datasource plugin.
- Perses - integrates with VictoriaLogs via VictoriaLogs plugins .
- vmalert - is an alerting tool for VictoriaLogs. It executes a list of the given alerting and sends notifications to Alertmanager. It can convert LogsQL queries into metrics via recording rules and persist them into VictoriaMetrics.
Traces (VictoriaTraces) #
VictoriaTraces single-node and vtinsert components support ingestion of traces via OpenTelemetry Protocol (OTLP) from OpenTelemetry Collector and applications instrumented with OpenTelemetry SDKs .
See the detailed description about protocol support here .
Once traces are ingested into VictoriaTraces, they can be read via the following tools:
- Grafana - integrates with VictoriaTraces using Jaeger datasource plugin.
- Jaeger frontend - integrates with VictoriaTraces via Jaeger Query Service JSON APIs .
- vmalert - is an alerting tool for VictoriaTraces. It executes a list of the given alerting and sends notifications to Alertmanager. It can convert LogsQL queries into metrics via recording rules and persist them into VictoriaMetrics.
Correlations #
Signals can be correlated together if they share the same list of attributes, so they can uniquely identify the same system or event. The recommended user interface for correlations is Grafana thanks to its correlation interfaces . See below various scenarios of correlating signals in Grafana using VictoriaMetrics, VictoriaLogs and VictoriaTraces as backends.
Depending on the Grafana datasource plugin there could be multiple correlations available:
- Trace to logs, log to trace, log to metrics - see correlations via VictoriaLogs plugin .
- Trace to metrics, metric to logs, metric to traces - see correlations via VictoriaMetrics plugin .
- Metrics to logs or traces correlations are possible via Prometheus datasource as well.
- Plugins Tempo, Jaeger, and Zipkin can correlate with logs or metrics using Trace to logs and Trace to metrics feature.