VictoriaMetrics operator exports internal metrics in Prometheus exposition format at /metrics page.
These metrics can be scraped via vmagent or Prometheus.
Dashboard #
Official Grafana dashboard available for vmoperator .
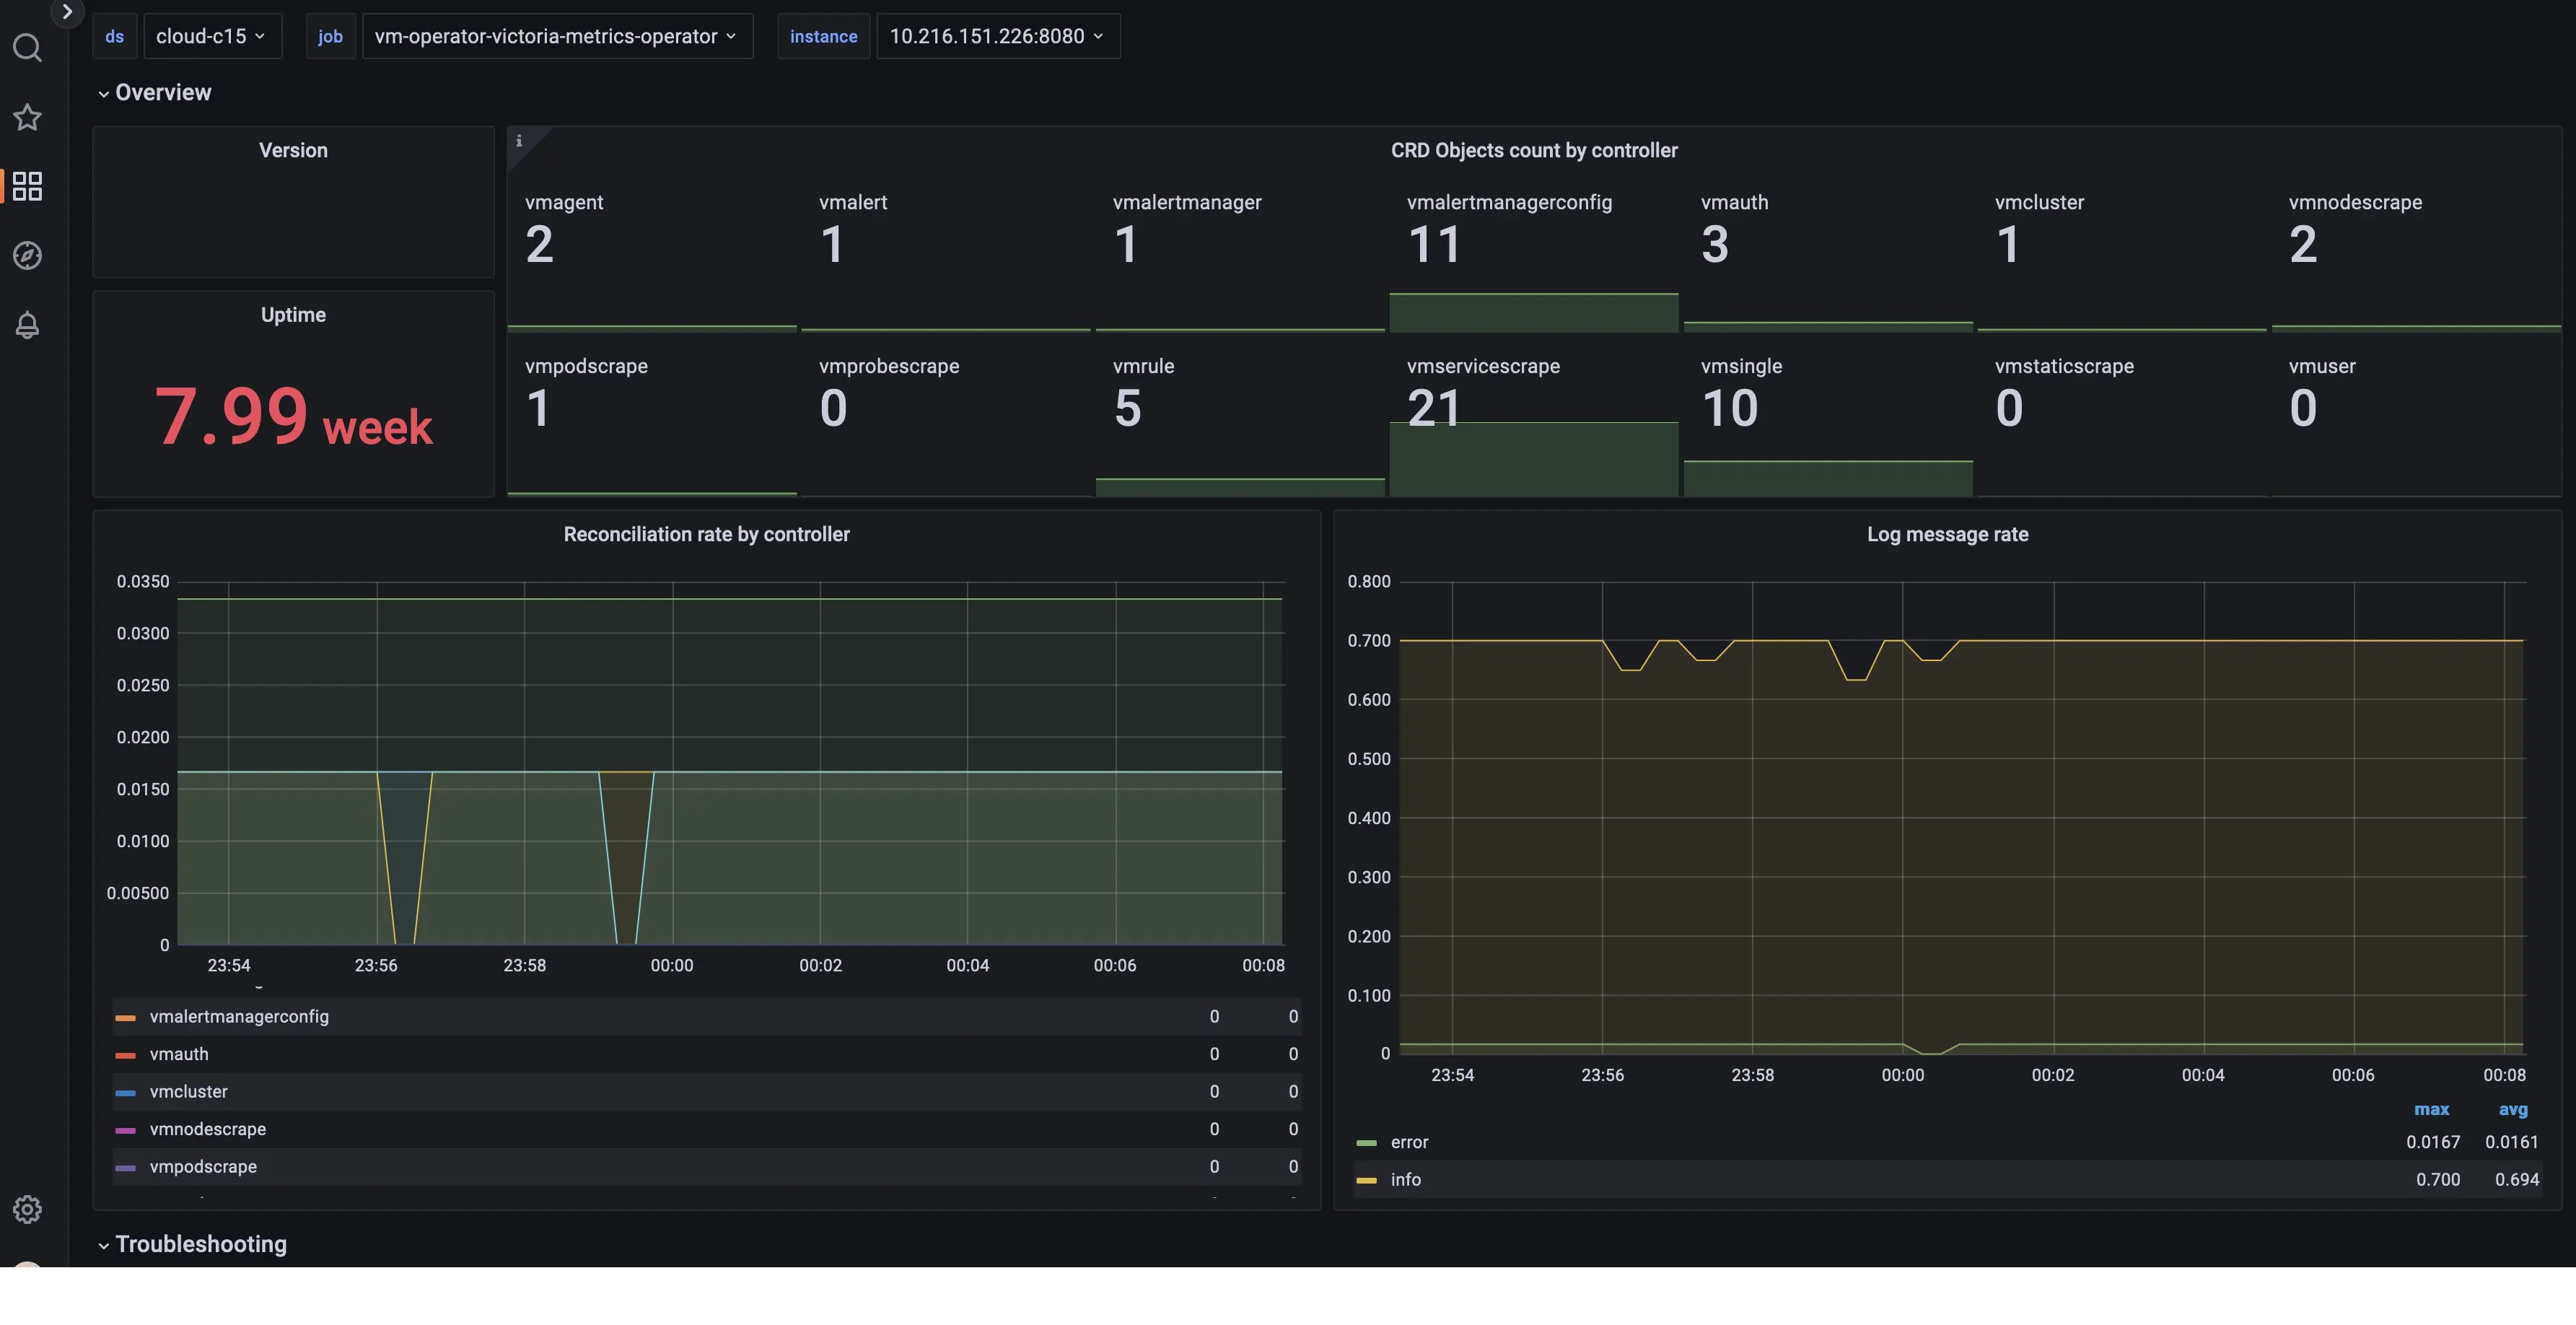
Graphs on the dashboards contain useful hints - hover the i icon in the top left corner of each graph to read it.
Alerting rules #
Alerting rules for VictoriaMetrics operator are available here .
Configuration #
Helm-chart victoria-metrics-k8s-stack #
In victoria-metrics-k8s-stack helm-chart operator self-scrapes metrics by default.
This helm-chart also includes official grafana dashboard for operator and official alerting rules for operator .
Helm-chart victoria-metrics-operator #
With
victoria-metrics-operator
you can use following parameter in values.yaml:
      # values.yaml
#...
# -- configures monitoring with serviceScrape. VMServiceScrape must be pre-installed
serviceMonitor:
  enabled: true
This parameter makes helm-chart to create a scrape-object for installed operator instance.
You will also need to deploy a (vmsingle)[https://docs.victoriametrics.com/operator/resources/vmsingle] where the metrics will be collected.
Pure operator installation #
With pure operator installation you can use config with separate vmsingle and scrape object for operator like that:
      apiVersion: operator.victoriametrics.com/v1beta1
kind: VMServiceScrape
metadata:
  name: vmoperator
  namespace: monitoring
spec:
  selector:
    matchLabels:
      app.kubernetes.io/instance: vm-operator
      app.kubernetes.io/name: victoria-metrics-operator
  endpoints:
    - port: http
  namespaceSelector:
    matchNames:
      - monitoring
See more info about object VMServiceScrape .
You will also need a vmsingle where the metrics will be collected.