The per-tenant statistic is a part of enterprise package . It is available for download and evaluation at releases page . To get the license key you can request a free trial license .
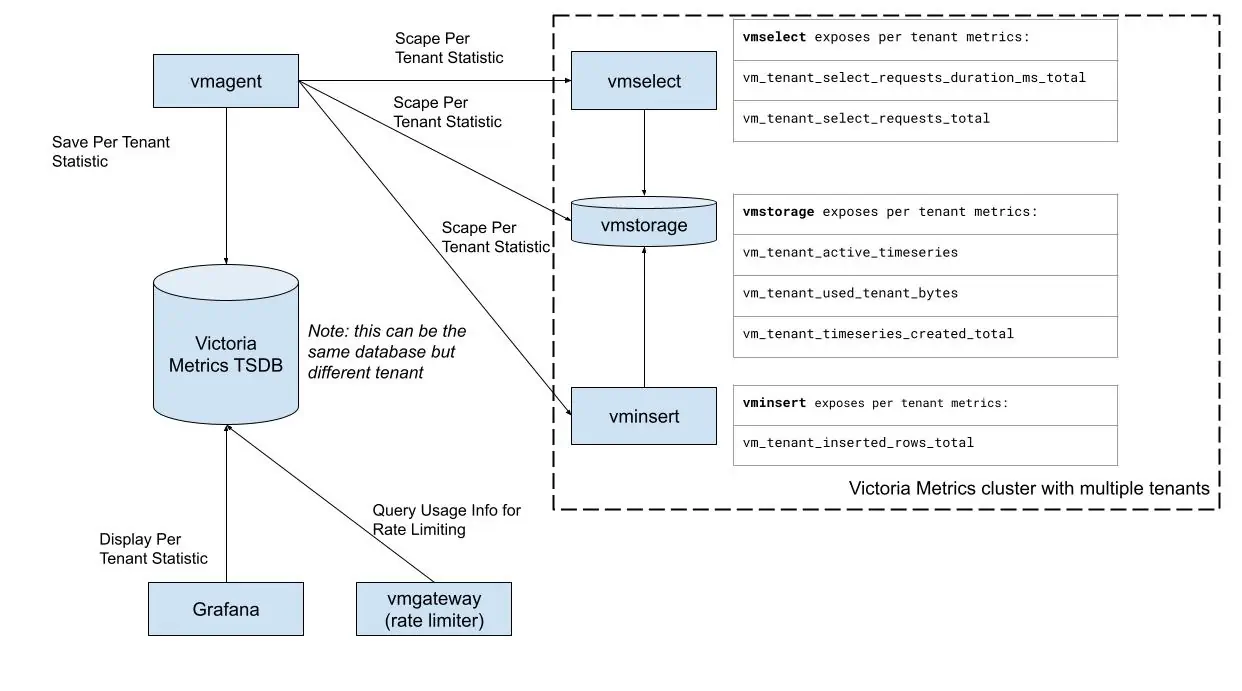
VictoriaMetrics cluster for enterprise provides various metrics and statistics usage per tenant:
vminsert:
vm_tenant_inserted_rows_total- total number of inserted rows. Find out which tenant puts the most of the pressure on the storage.
vmselect:
vm_tenant_select_requests_duration_ms_total- query latency. Helps to identify tenants with the heaviest queries.vm_tenant_select_requests_total- total number of requests. Discover which tenant sends the most of the queries and how it changes with time.
vmstorage:
vm_tenant_active_timeseries- number of active time series. This metric correlates with memory usage, so can be used to find the most expensive tenant in terms of memory.vm_tenant_used_tenant_bytes- disk space usage. Helps to track disk space usage per tenant.vm_tenant_timeseries_created_total- number of new time series created. Helps to track the churn rate per tenant, or identify inefficient usage of the system.
Collect the metrics by any scrape agent you like (vmagent, victoriametrics, Prometheus, etc) and put into TSDB.
It is ok to use existing cluster for storing such metrics, but make sure to use a different tenant for it to avoid collisions.
Or just run a separate TSDB (VM single, Prometheus, etc.) to keep the data isolated from the main cluster.
Example of the scraping configuration for statistic is the following:
      scrape_configs:
  - job_name: cluster
    scrape_interval: 10s
    static_configs:
    - targets: ['vmselect:8481','vmstorage:8482','vminsert:8480']
Visualization #
Use this dashboard for visualizing per-tenant statistics in Grafana. It contains Statistic and Billing sections.
Use cases #
Data distribution between tenants #
Understand the impact of every tenant on VictoriaMetrics. You can visualize the current distribution of tenants and find the outliers. This statistic also helps define tenants that harm the database in emergencies at the exact time.
Internal billing #
When you provide VictoriaMetrics as a Platform for different organizations, teams or customers, you can create the billing based on statistics exposed by tenants.
The metrics cover:
- ingestion flow(vm_tenant_inserted_rows_total),
- reading requests(vm_tenant_select_requests_duration_ms_total and vm_tenant_select_requests_total),
- disk space usage(vm_tenant_used_tenant_bytes)
- data distribution (vm_tenant_timeseries_created_total and vm_tenant_active_timeseries)
- These four buckets provide complete information on the cost of every tenant.
Using the /api/v1/query endpoint, you can collect these metrics in your application to create a separate billing service.
Example of billing logic:
- Understand the cost of running VictoriaMetrics, calculate the percentage of every tenant and divide the cost between organizations/teams. This way is suitable for internal usage.
- Define the Unit ( for example, 1 unit equals 1k active timeseries, 1k new series over 24h, 1GB of disk space, 1k datapoints per second, etc.) and price per Unit. Collect the data from the
/api/v1/queryendpoint of existent usage and calculate the number of units the tenant uses. This way is suitable when you provide VictoriaMetrics for your customers and inside the organization or teams.
Check the Billing section of Grafana Dashboard , it contains billing section.
Integration with vmgateway #
vmgateway supports integration with Per Tenant Statistics data for rate limiting purposes.
More information can be found in the
vmgateway documentation
Integration with vmalert #
You can generate alerts based on each tenant’s resource usage and send notifications to prevent limits exhaustion.
Here is an alert example for high churn rate by the tenant:
- alert: TooHighChurnRate
  expr: |
    (
    sum(rate(vm_tenant_timeseries_created_total[5m])) by(accountID,projectID)
    /
    sum(rate(vm_tenant_inserted_rows_total[5m])) by(accountID,projectID)
    ) > 0.1
  for: 15m
  labels:
    severity: warning
  annotations:
    summary: "Churn rate is more than 10% for the last 15m"
    description: "VM constantly creates new time series in the tenant: {{ $labels.accountID }}:{{ $labels.projectID }}.\n
            This effect is known as Churn Rate.\n
            High Churn Rate is tightly connected with database performance and may
            result in unexpected OOM's or slow queries."