This playground is particularly useful if you already use Grafana and want to see how VictoriaMetrics integrates into existing workflows. It provides a hosted Grafana instance preconfigured with:
- VictoriaMetrics as a metrics data source
- VictoriaLogs as a logs data source
- VictoriaTraces as a Jaeger data source for traces
What can you do here? #
- Explore real dashboards built on top of VictoriaMetrics
- See how MetricsQL and LogsQL are used in Grafana panels
- Explore correlation with the help of the OpenTelemetry Collector dashboard
- Learn dashboard design and visualization best practices
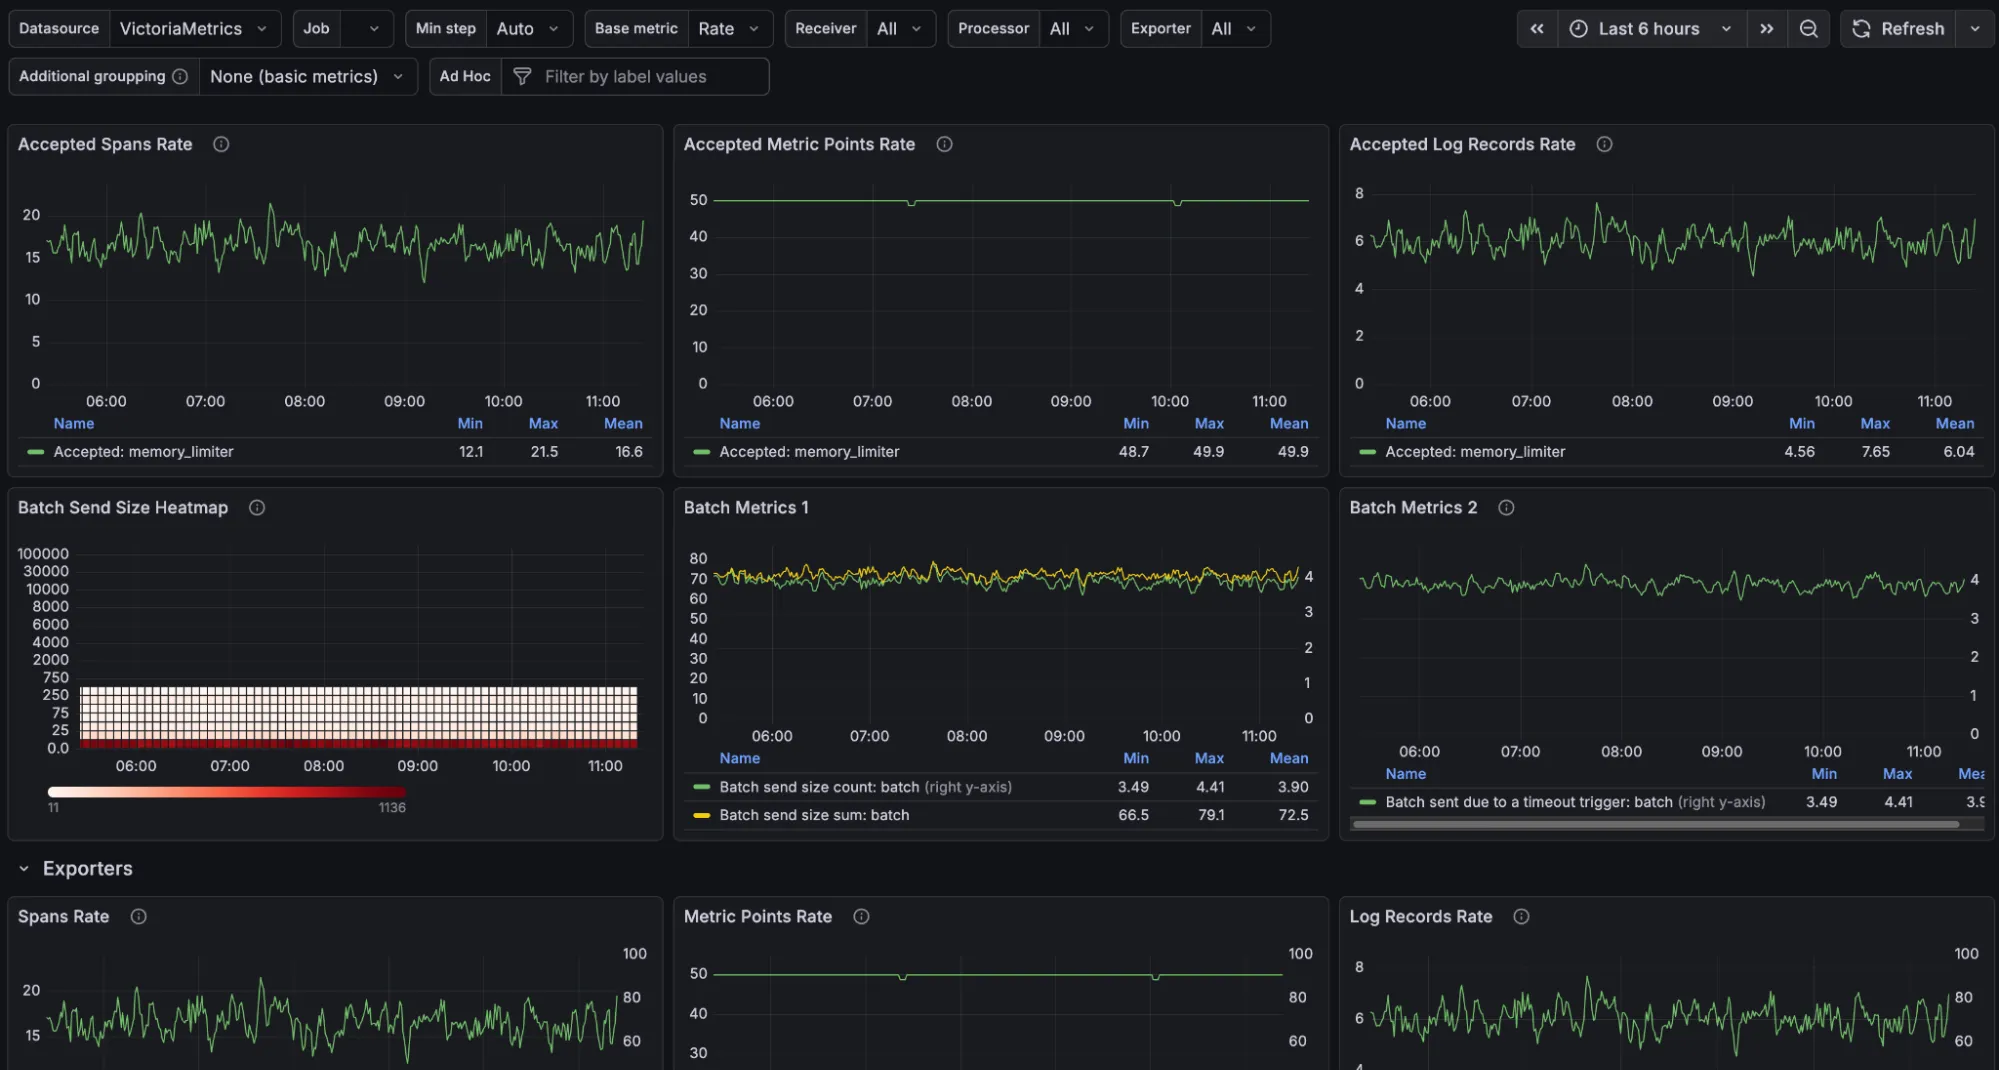
The OpenTelemetry Collector dashboard is built on the official OpenTelemetry Astronomy Shop demo . It lets you visualize and understand telemetry data alongside VictoriaMetrics Stack observability signals, using VictoriaMetrics for metrics, VictoriaLogs for logs, and VictoriaTraces for traces.
For an always-updated list of dashboards, bookmark this playground.
Distribution #
Relevant GitHub:
- VictoriaMetrics Grafana datasource: https://github.com/VictoriaMetrics/victoriametrics-datasource
- VictoriaLogs Grafana datasource: https://github.com/VictoriaMetrics/victorialogs-datasource