- Try it: https://play.victoriametrics.com/
- Query language reference: MetricsQL
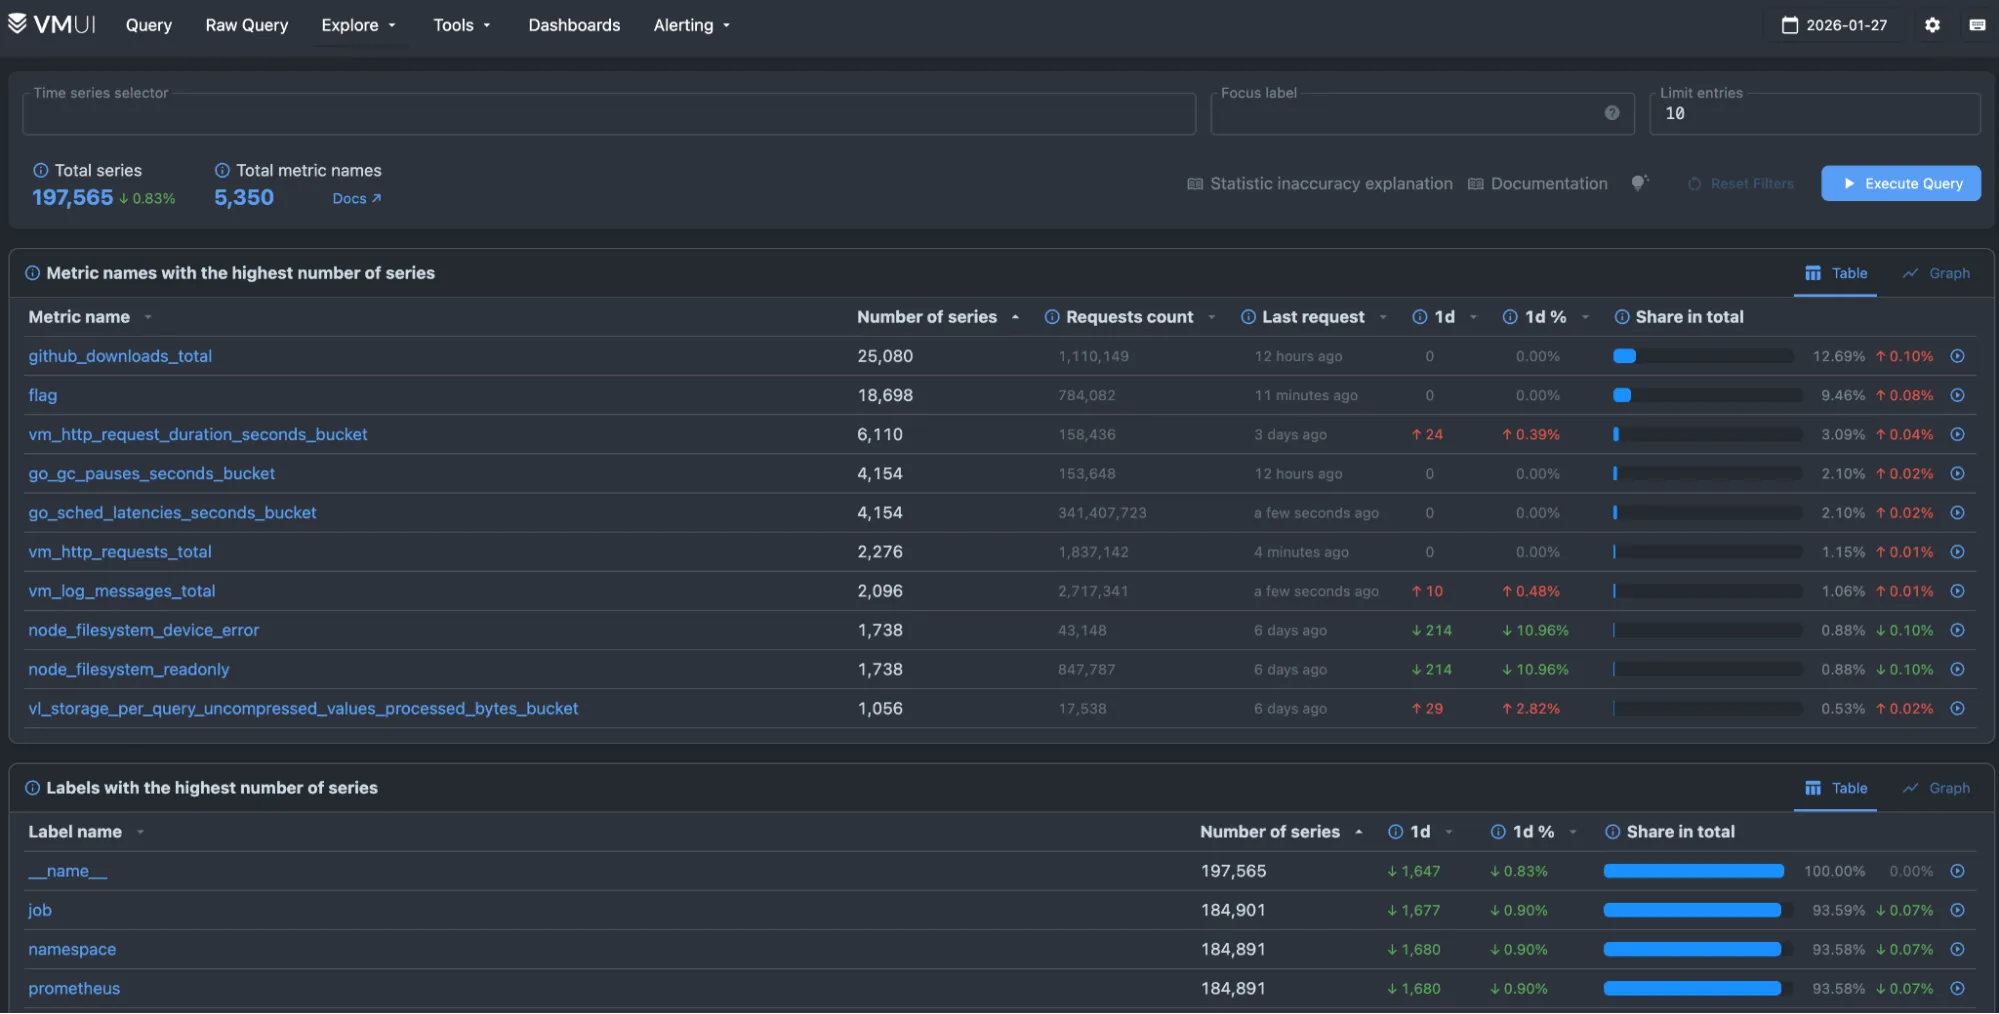
This is the primary playground for VictoriaMetrics, powered by VMUI and backed by a VictoriaMetrics cluster installation. Use it to experiment with the query engine, see available pages, or try tools such as the relabeling debugger.
This playground is the best starting point for understanding how VictoriaMetrics stores and queries metrics at scale.
What can you do here? #
The query tab provides a sandbox to experiment with MetricsQL . Turn on Autocomplete and start typing to discover time series. You can add multiple queries and compare them.
You can try these to get started:
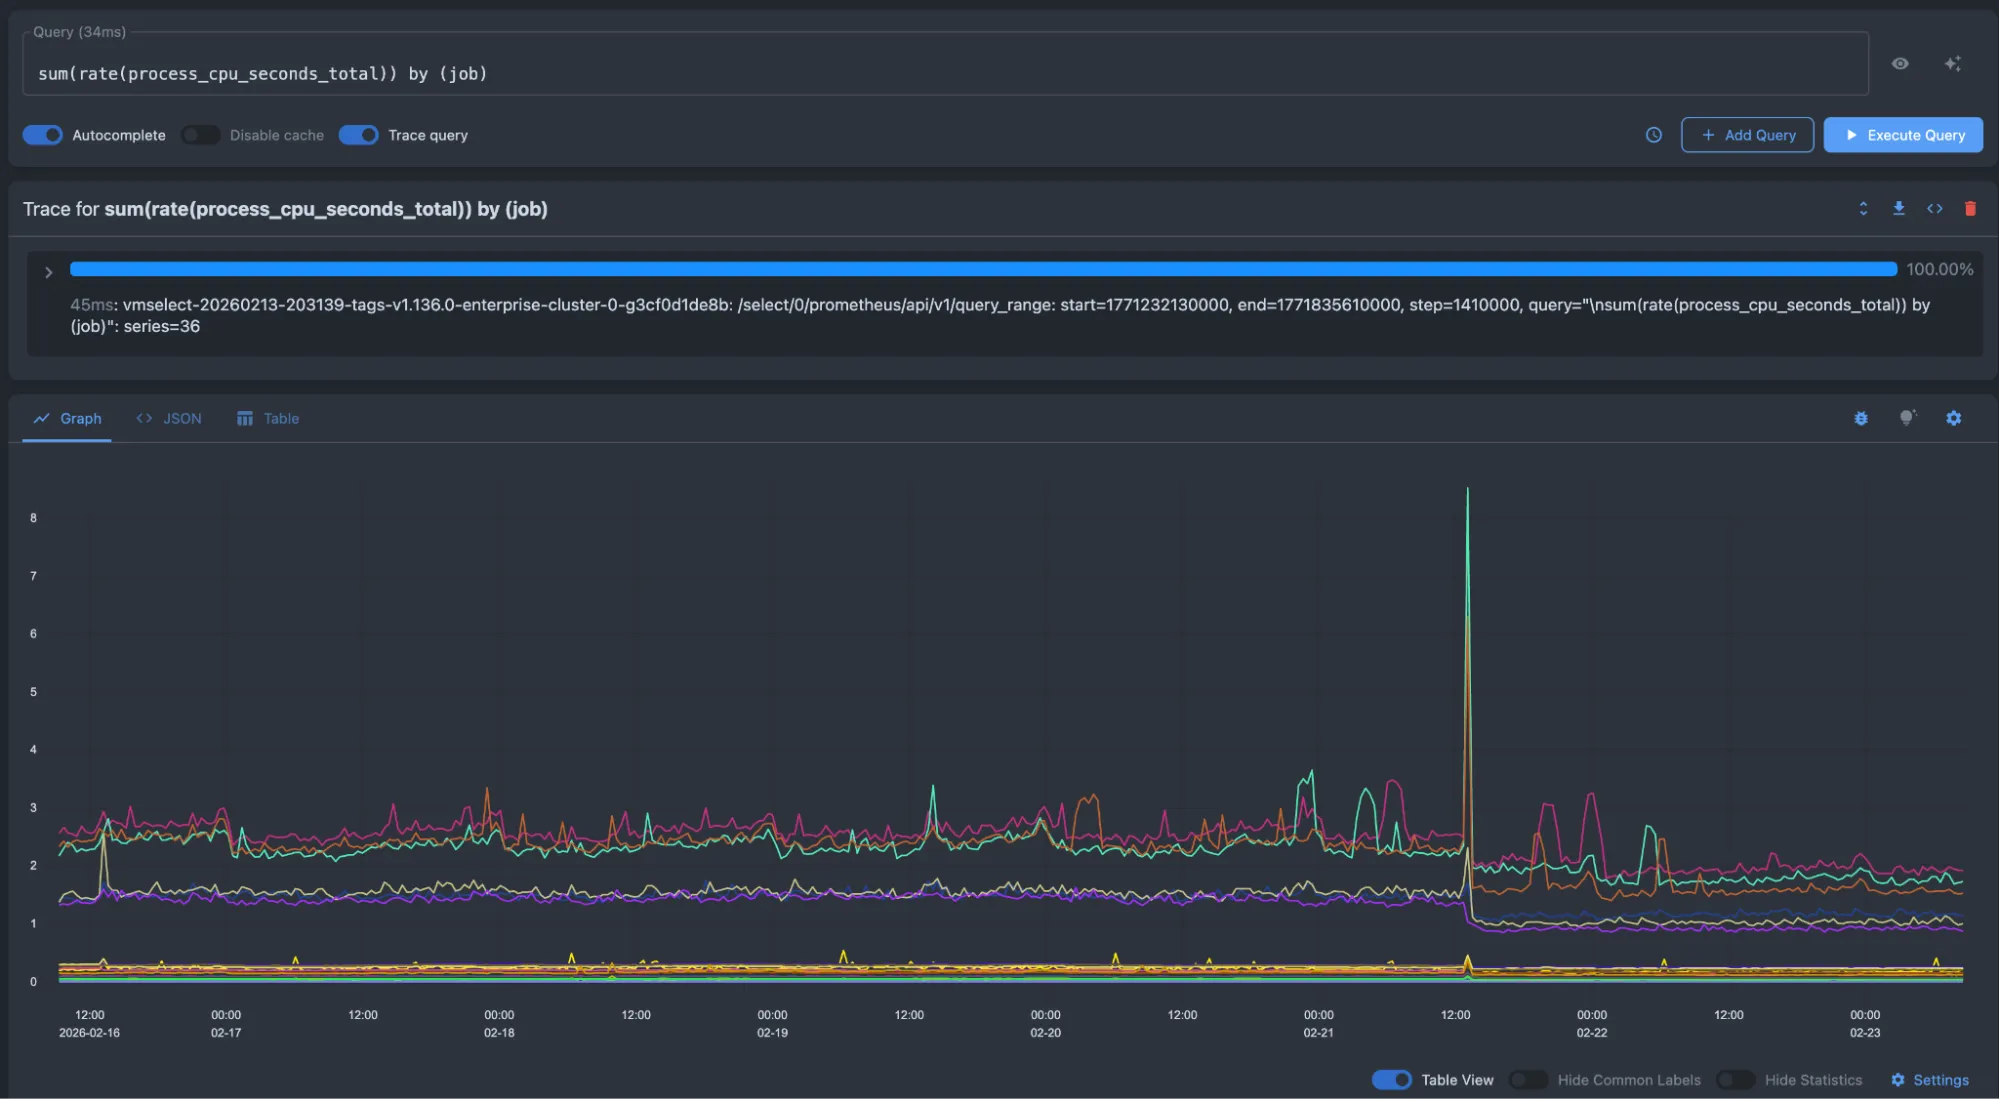
- Average CPU usage per job:
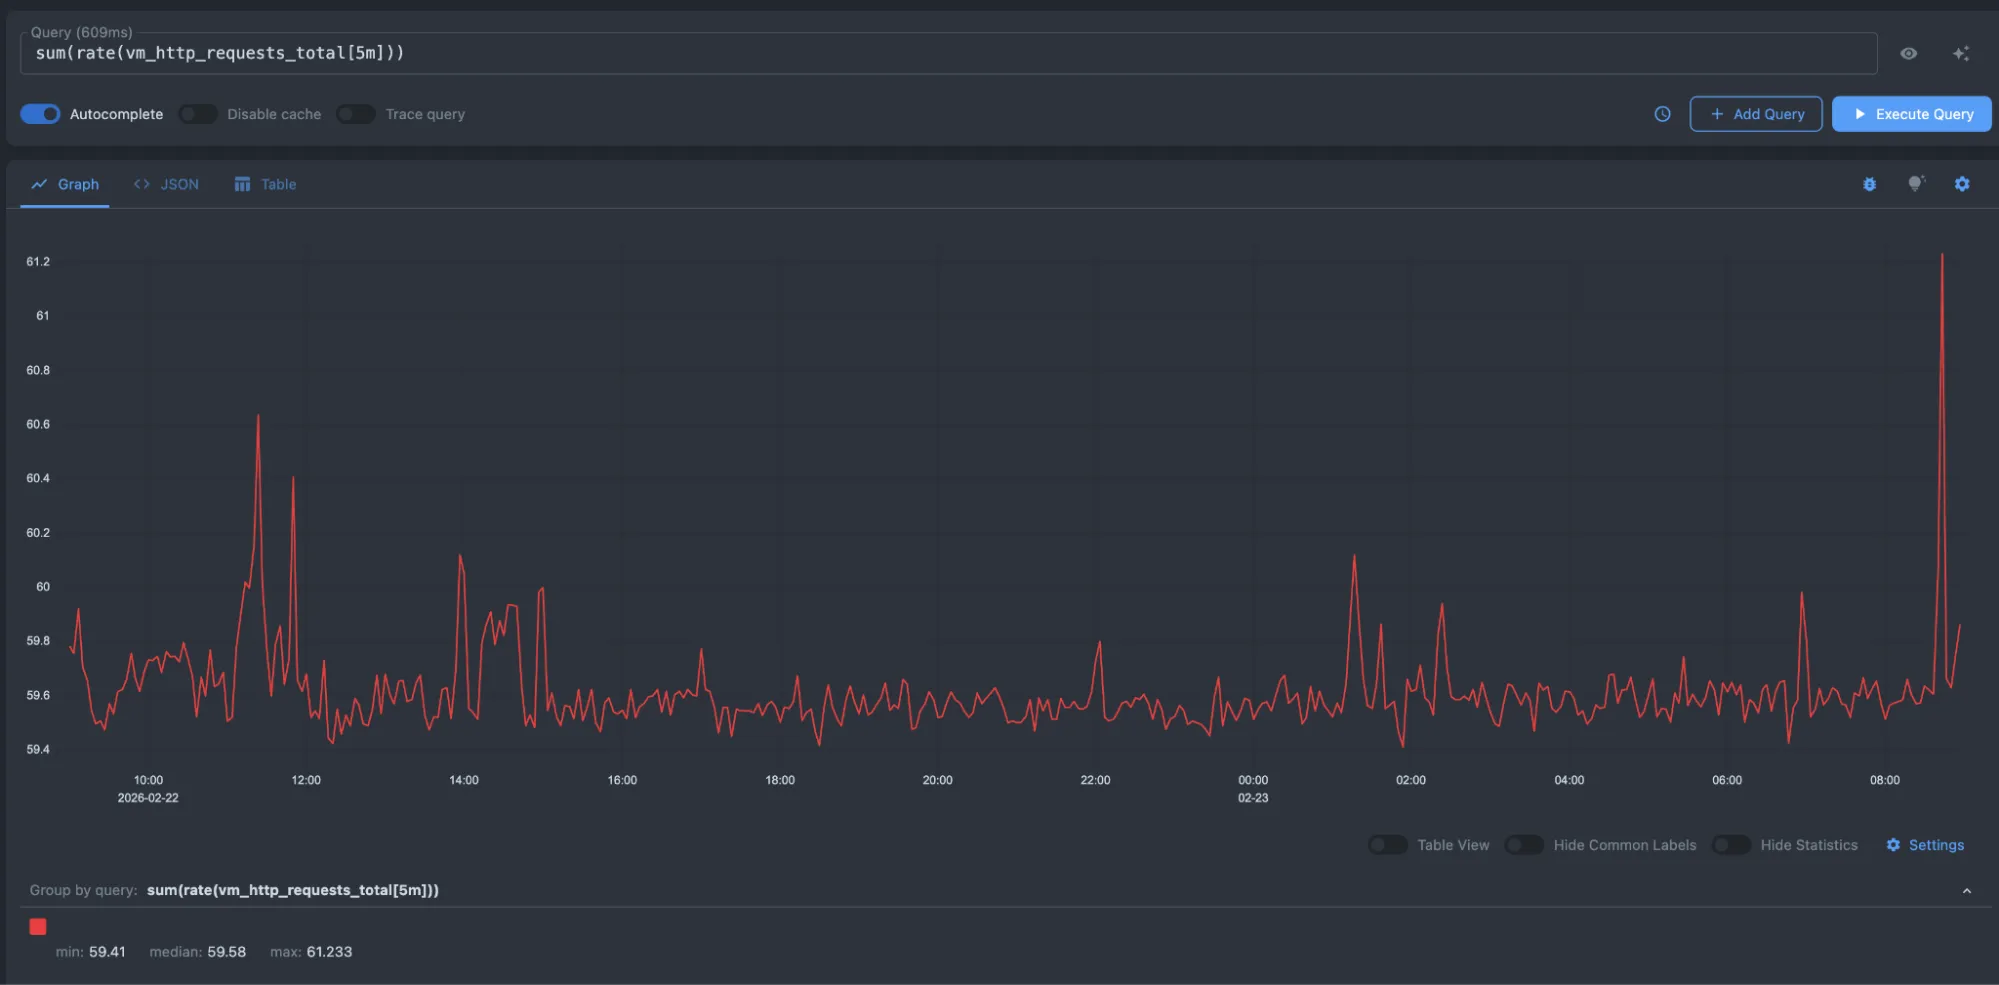
sum(rate(process_cpu_seconds_total[5m])) by (job) - HTTP requests per-second rate:
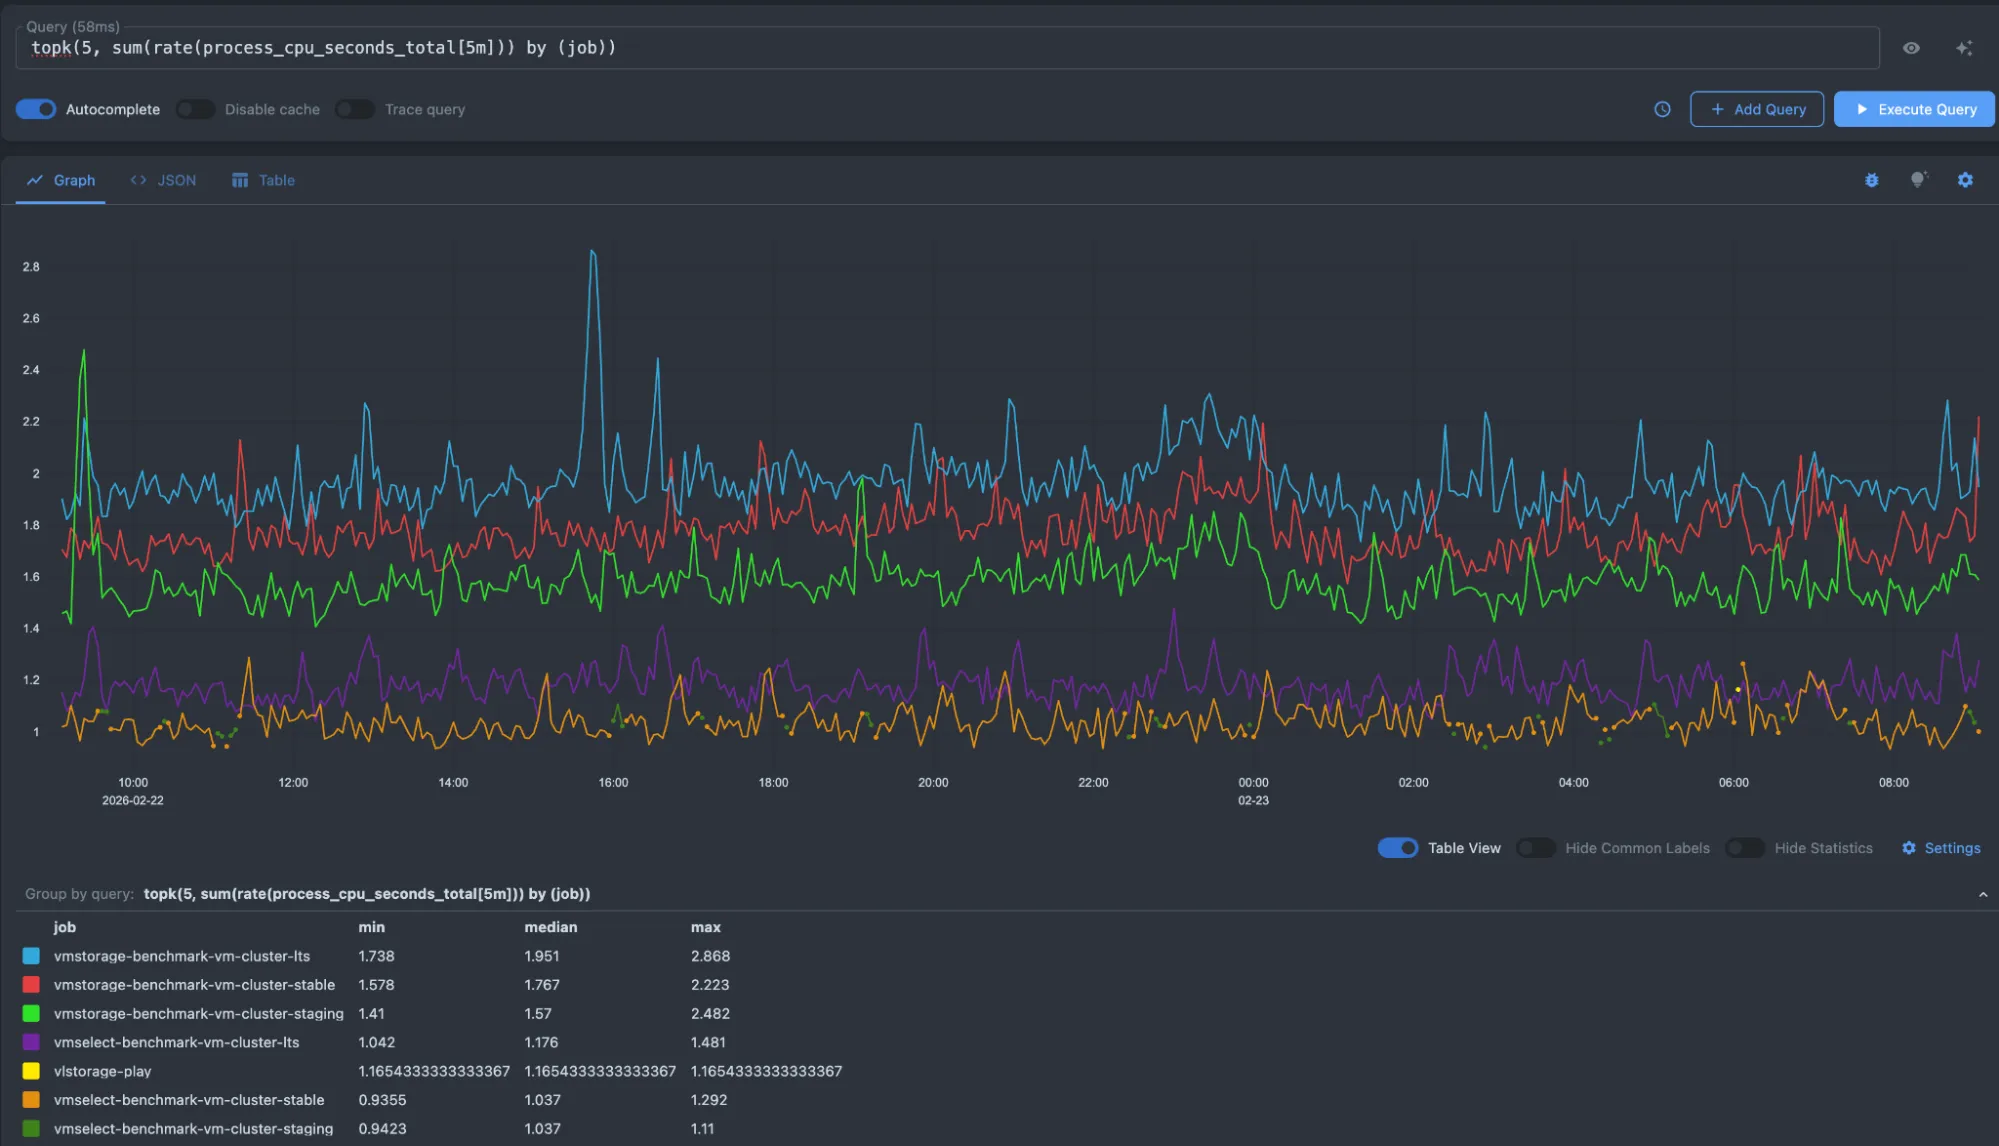
sum(rate(vm_http_requests_total[5m])) - Top 5 CPU intensive jobs
topk(5, sum(rate(process_cpu_seconds_total[5m])) by (job))
Below is an example of average CPU usage per job:
sum(rate(process_cpu_seconds_total[5m])) by (job)
Here, we are requesting the per-second rate of HTTP requests:
sum(rate(vm_http_requests_total[5m]))
And here is an example for obtaining the top 5 high CPU jobs:
topk(5, sum(rate(process_cpu_seconds_total[5m])) by (job))
For a deep dive into all the features of this playground, please visit the VMUI page.