- Try it: https://play-vmanomaly.victoriametrics.com/metrics/vmui/
- UI Guide: https://docs.victoriametrics.com/anomaly-detection/ui/#example-usage
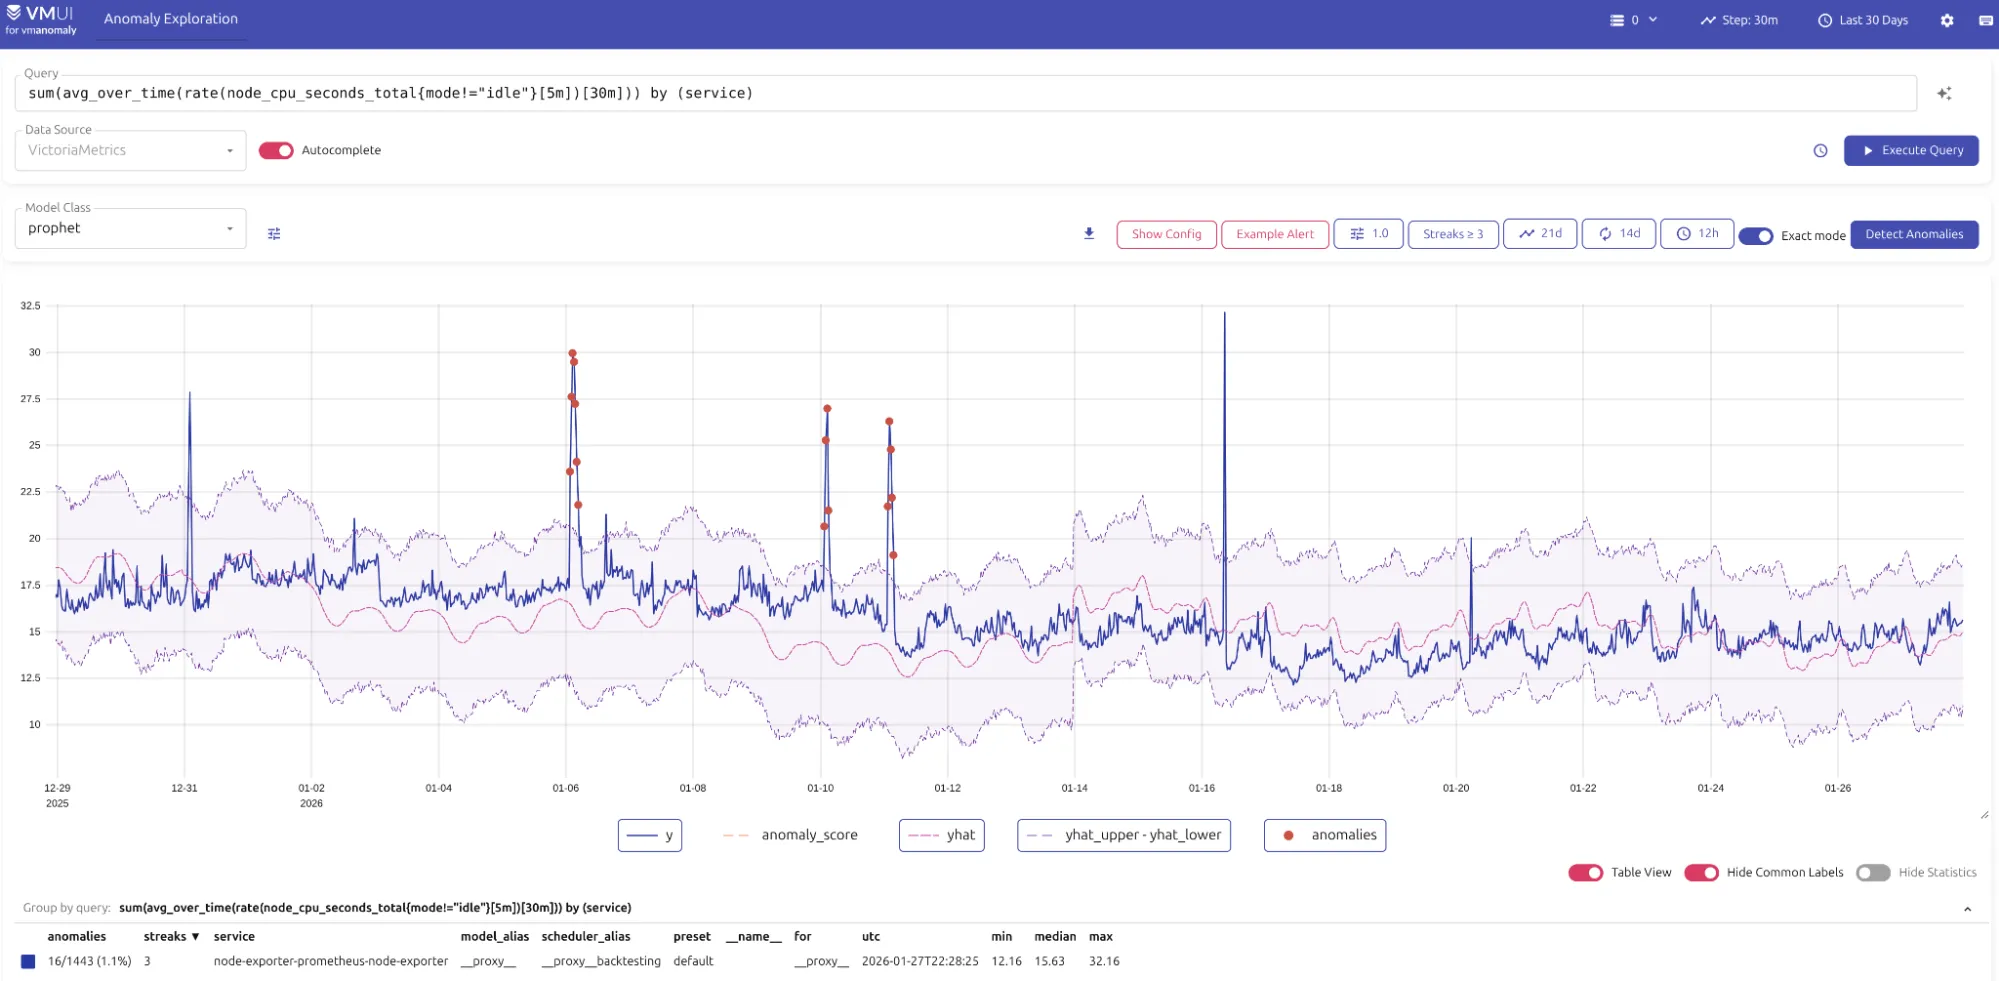
The playground demonstrates automatic anomaly detection .
The playground showcases anomaly detection data (native timeseries or converted to timeseries) using VictoriaMetrics, VictoriaLogs, or VictoriaTraces datasources, respectively:
- https://play-vmanomaly.victoriametrics.com/metrics/
- https://play-vmanomaly.victoriametrics.com/logs/
- https://play-vmanomaly.victoriametrics.com/traces/
What can you do here? #
The Anomaly Detection playground lets you:
- Understand how MetricsQL and LogsQL are used to generate input data for anomaly detection.
- Explore metrics data enriched with anomaly scores, predictions, and confidence intervals.
- Visualize anomalies directly in VMUI, including consecutive anomalies that last over time rather than being a single point, to imitate how alerting rules trigger on such data.
- Learn how anomaly scores can be used for alerting purposes by exploring generated alerting rules.
Distribution & setup #
VMAnomaly is distributed through various channels:
- Installation guide
- Docker containers available in Docker Hub and Quay.io
- Helm charts (including anomaly setups)
- VM Operator