vmalert
integrates with VictoriaLogs via stats APIs
/select/logsql/stats_query
and
/select/logsql/stats_query_range
.
These endpoints return log stats in a format compatible with the Prometheus querying API
.
This allows using VictoriaLogs as the datasource in vmalert and creating alerting and recording rules via
LogsQL
.
This page provides only integration instructions for vmalert and VictoriaLogs. See the full textbook for vmalert here .
Quick Start #
Run vmalert with the following settings:
      ./bin/vmalert -rule=alert.rules                  \  # Path to the files or HTTP URL with alerting and/or recording rules in YAML format
    -datasource.url=http://victorialogs:9428     \  # VictoriaLogs address
    -notifier.url=http://alertmanager:9093       \  # Alertmanager URL (required if alerting rules are used)
    -remoteWrite.url=http://victoriametrics:8428 \  # Remote write-compatible storage to persist recording rules and alerts state info
    -remoteRead.url=http://victoriametrics:8428  \  # Prometheus HTTP API-compatible datasource to restore alerts state from
Note: By default, vmalert assumes all configured rules have the prometheus type and will validate them accordingly.
For rules in
LogsQL
, specify type: vlogs at the
group level
.
Or set the -rule.defaultRuleType=vlogs command-line flag to change the default rule type.
Each -rule file may contain an arbitrary number of
groups
.
See examples in the
Groups
section. See the full list of configuration flags and their descriptions in the
Configuration
section.
With the configuration example above, vmalert will perform the following interactions:
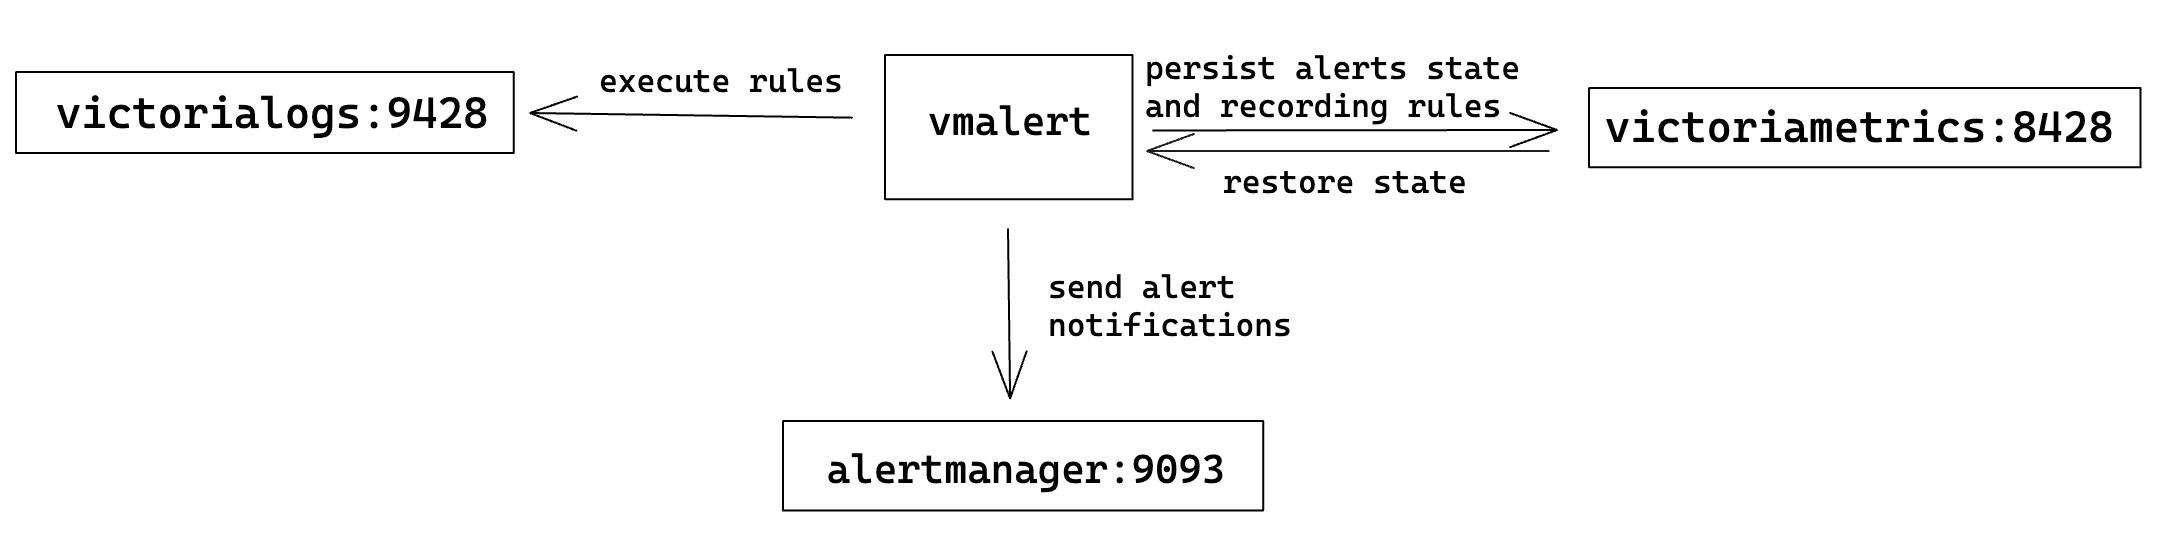
- Rules listed in the
-rulefile are executed against the VictoriaLogs service configured via-datasource.url. - Triggered alerting notifications are sent to the Alertmanager
service configured via
-notifier.url. - Results of recording rule expressions and alerts state are persisted to a Prometheus-compatible remote-write endpoint
(i.e., VictoriaMetrics) configured via
-remoteWrite.url. - On vmalert restarts, alerts state
can be restored
by querying a Prometheus-compatible HTTP API endpoint (i.e., VictoriaMetrics) configured via
-remoteRead.url.
Configuration #
Flags #
For a complete list of command-line flags, visit
https://docs.victoriametrics.com/victoriametrics/vmalert/#flags
or execute the ./vmalert --help command.
The following are key flags related to integration with VictoriaLogs:
      -datasource.url string
   Datasource address supporting log stats APIs, which can be a single VictoriaLogs node or a proxy in front of VictoriaLogs. Supports an address in the form of an IP address with a port (e.g., http://127.0.0.1:8428) or a DNS SRV record.
-notifier.url array
   Prometheus Alertmanager URL, e.g., http://127.0.0.1:9093. List all Alertmanager URLs if it runs in cluster mode to ensure high availability.
   Supports an array of values separated by commas or specified via multiple flags.
   Values can contain commas inside a single-quoted or double-quoted string, and inside {}, [] and () braces.
-remoteWrite.url string
   Optional URL to VictoriaMetrics or vminsert where to persist alerts state and recording rule results as time series. Supports an address in the form of an IP address with a port (e.g., http://127.0.0.1:8428) or a DNS SRV record. For example, if -remoteWrite.url=http://127.0.0.1:8428 is specified, then the alerts state will be written to http://127.0.0.1:8428/api/v1/write. See also '-remoteWrite.disablePathAppend', '-remoteWrite.showURL'.
-remoteRead.url string
   Optional URL to a datasource compatible with MetricsQL. It can be a single-node VictoriaMetrics or vmselect. Remote read is used to restore alerts state. This configuration makes sense only if vmalert was configured with '-remoteWrite.url' before and has successfully persisted its state. Supports an address in the form of an IP address with a port (e.g., http://127.0.0.1:8428) or a DNS SRV record. See also '-remoteRead.disablePathAppend', '-remoteRead.showURL'.
-rule array
   Path to the files or HTTP URL with alerting and/or recording rules in YAML format.
   Supports hierarchical patterns and regular expressions.
   Examples:
    -rule="/path/to/file". Path to a single file with alerting rules.
    -rule="http://<some-server-addr>/path/to/rules". HTTP URL to a page with alerting rules.
    -rule="dir/*.yaml" -rule="/*.yaml" -rule="gcs://vmalert-rules/tenant_%{TENANT_ID}/prod".
    -rule="dir/**/*.yaml". Includes all the .yaml files in "dir" subfolders recursively.
   Rule files support multi-document YAML. Files may contain %{ENV_VAR} placeholders, which are substituted by the corresponding env vars.
   The enterprise version of vmalert supports S3 and GCS paths to rules.
   For example: gs://bucket/path/to/rules, s3://bucket/path/to/rules
   S3 and GCS paths support only matching by prefix, e.g. s3://bucket/dir/rule_ matches
   all files with prefix rule_ in folder dir.
   Supports an array of values separated by commas or specified via multiple flags.
   Values can contain commas inside a single-quoted or double-quoted string, and inside {}, [] and () braces.
-rule.defaultRuleType
   The default type for rule expressions; can be overridden by the 'type' parameter inside the rule group. Supported values: "graphite", "prometheus" and "vlogs".
   The default is "prometheus"; change it to "vlogs" if all rules are written with LogsQL.
-rule.evalDelay time
   Adjustment of the time parameter for rule evaluation requests to compensate for intentional data delay from the datasource. Normally, it should be equal to `-search.latencyOffset` (command-line flag configured for VictoriaMetrics single-node or vmselect).
   Since there is no intentional search delay in VictoriaLogs, `-rule.evalDelay` can be reduced to a few seconds to accommodate network and ingestion time.
See the full list of configuration options here .
Groups #
See the complete group attributes here .
Alerting rules #
vmalert executes the given
LogsQL query
from the expr option
according to the provided interval. See
config options for alerting rules
for more details.
The expr query must contain
stats pipe
in order to calculate
some metric over the selected logs, and use this metric in alerting threshold. Use
filter pipe
for filtering the calculated metric according to the needed threshold. For example, the following alerting rule fires
if the number of logs with the error or warn status in env=prod exceeds 10 during the last 5 minutes:
      groups:
- name: ServiceLog
  type: vlogs
  interval: 5m
  rules:
  - alert: HasMoreThan10ErrorLogs
    expr: '{env=prod} status:in(error,warn) | stats count() as error_logs | filter error_logs:>10'
    annotations:
      description: 'Too big number of errors and warnings during the last 5 minutes: {{$value}}'
It is possible to group the calculated metrics by arbitrary log fields, by using
stats by (...) pipe
.
Use
math pipe
for performing additional calculations over the metrics calculated with
stats pipe
.
Use
fields pipe
for leaving only the needed metrics.
The following example of alerting rule uses stats by (...), math and fields pipes
for triggering an alert if the number of failed requests exceeds 10% for the given ip:
      - name: ServiceRequest
  type: vlogs
  interval: 5m
  rules:
  - alert: TooManyFailedRequestsByIP
    expr: '* | extract "ip=<ip> " | extract "status_code=<code>;" | stats by (ip) count() if (code:~"4.*") as failed, count() as total | math (failed / total) * 100 as failed_percentage | filter failed_percentage:>10 | fields ip, failed_percentage'
    annotations:
      description: "Connection from address {{$labels.ip}} has {{$value}}% failed requests in the last 5 minutes"
Recording rules #
vmalert executes the given
LogsQL query
from the expr option
according to the provided interval and stores the query results as metrics at the remote storage specified via -remoteWrite.url command-line flag.
See
config options for recording rules
for more details.
The expr query must contain
stats pipe
in order to calculate
some metric over the selected logs. For example, the following recording rule calculates the number of logs for env=test and service=nginx
per every 5 minute interval:
      groups:
- name: RequestCount
  type: vlogs
  interval: 5m
  rules:
  - record: nginxRequestCount
    expr: '{env=test,service=nginx} | stats count(*) as requests'
It is possible to group the calculated metrics by arbitrary log fields, by using
stats by (...) pipe
.
Use
math pipe
for performing additional calculations over the metrics calculated with
stats pipe
.
Use
fields pipe
for leaving only the needed metrics.
The following example of recording rule uses stats by (...), math and fields pipes
for calculating the share of errors per each service per every 5 minute interval:
      groups:
- name: RequestCount
  type: vlogs
  interval: 5m
  rules:
  - record: prodErrorsShareByService
    expr: '{env=prod} | stats by (service) count() as logs_total, count() if (error) errors | math (errors / total) as errors_share | fields service, errors_share'
Time filter #
It’s recommended to omit the
time filter
in rule expressions.
By default, vmalert automatically appends the time filter _time: <group_interval> to the expression.
For instance, the rule below will be evaluated every 5 minutes and will return the result with logs from the last 5 minutes:
      groups:
- name: Requests
  type: vlogs
  interval: 5m
  rules:
  - alert: TooManyFailedRequestByIP
    expr: '* | extract "ip=<ip> " | extract "status_code=<code>;" | stats by (ip) count() if (code:~"4.*") as failed, count() as total | math (failed / total) * 100 as failed_percentage | filter failed_percentage:>10 | fields ip, failed_percentage'
    annotations:
      description: "Connection from address {{$labels.ip}} has {{$value}}% failed requests in the last 5 minutes"
Users can specify a custom time filter if needed. For example, the rule below will be evaluated every 5 minutes but will calculate the result over the logs from the last 10 minutes.
      groups:
- name: Requests
  type: vlogs
  interval: 5m
  rules:
  - alert: TooManyFailedRequestByIP
    expr: '_time:10m | extract "ip=<ip> " | extract "status_code=<code>;" | stats by (ip) count() if (code:~"4.*") as failed, count() as total | math (failed / total) * 100 as failed_percentage | filter failed_percentage:>10 | fields ip, failed_percentage'
    annotations:
    description: "Connection from address {{$labels.ip}} has {{$value}}% failed requests in the last 10 minutes"
Please note, vmalert doesn’t support backfilling for rules with a customized time filter yet (might be added in the future).
Rules backfilling #
vmalert supports alerting and recording rule backfilling (aka replay) against VictoriaLogs as the datasource.
      ./bin/vmalert -rule=path/to/your.rules \        # path to files with rules you usually use with vmalert
    -datasource.url=http://localhost:9428 \     # VictoriaLogs address
    -rule.defaultRuleType=vlogs \               # Set default rule type to VictoriaLogs
    -remoteWrite.url=http://localhost:8428 \    # Remote write-compatible storage to persist rules and alerts state info
    -replay.timeFrom=2021-05-11T07:21:43Z \     # start replay from
    -replay.timeTo=2021-05-29T18:40:43Z         # finish replay at (optional; defaults to current time)
See more details about backfilling here .
Performance tip #
LogsQL allows users to obtain multiple stats from a single expression. For instance, the following query calculates
the 50th, 90th, and 99th percentiles for the request_duration_seconds field over logs for the last 5 minutes:
      _time:5m | stats
  quantile(0.5, request_duration_seconds) p50,
  quantile(0.9, request_duration_seconds) p90,
  quantile(0.99, request_duration_seconds) p99
This expression can also be used in recording rules as follows:
      groups:
  - name: requestDuration
    type: vlogs
    interval: 5m
    rules:
      - record: requestDurationQuantile
        expr: '* | stats by (service) quantile(0.5, request_duration_seconds) p50, quantile(0.9, request_duration_seconds) p90, quantile(0.99, request_duration_seconds) p99'
This rule generates three metrics per service in each evaluation:
      requestDurationQuantile{stats_result="p50", service="service-1"}
requestDurationQuantile{stats_result="p90", service="service-1"}
requestDurationQuantile{stats_result="p99", service="service-1"}

requestDurationQuantile{stats_result="p50", service="service-2"}
requestDurationQuantile{stats_result="p90", service="service-2"}
requestDurationQuantile{stats_result="p99", service="service-2"}
...
For additional tips on writing LogsQL, refer to this doc .
Frequently Asked Questions #
How to attach a sample log row to alerts? #
Sometimes it may be useful to attach a representative log line to the alert message (e.g. for Slack notifications without opening UI).
Use
row_any()
only inside annotations via the query template function.
Note: do not use these functions in expr, since the returned row can change between evaluations. vmalert identifies each alert instance by the full label set (excluding __name__), changing labels leads to alert flapping and resets the for: timer.
Example with a stable expr and a sampled log message in annotations:
      groups:
  - name: vlogs
    type: vlogs
    interval: 1m
    rules:
      - alert: ErrorsByPath
        expr: '* | stats by (path) count() as errors | filter errors:>10'
        for: 2m
        annotations:
          description: >-
            path={{ $labels.path }} errors={{ $value }}
            {{ $ms := query (printf "path:%q | stats count() as hits, row_any(_msg) as sample_msg | filter hits:>0" $labels.path) }}
            {{ if gt (len $ms) 0 }}sample={{ label "sample_msg" (index $ms 0) }}{{ end }}
The same approach applies to
row_max()
and
row_min()
.
For example, use row_max(duration, _msg) in an annotation query if you want to attach the “slowest” log line in the evaluation window (the log entry with the maximum duration), and use row_min(duration, _msg) if you want to attach the “fastest” one (minimum duration).
How to use multitenancy in rules? #
vmalert doesn’t support multi-tenancy for VictoriaLogs in the same way as it
supports it for VictoriaMetrics in the Enterprise version
.
However, it is possible to specify the tenant to query in the VictoriaLogs datasource via the headers parameter in the
group config
.
For example, the following config will execute all the rules within the group against the tenant with AccountID=1 and ProjectID=2:
          groups:
    - name: MyGroup
      headers:
      - "AccountID: 1"
      - "ProjectID: 2"
      rules: ...
By default, vmalert persists all results to the specific tenant in VictoriaMetrics that is specified by -remoteWrite.url. For example, if -remoteWrite.url=http://vminsert:8480/insert/0/prometheus/ is set, all data goes to tenant 0.
To persist different rule results to different tenants in VictoriaMetrics, there are the following approaches:
Use the multitenant endpoint of vminsert as the
-remoteWrite.url, and add tenant labels under the group configuration.For example, run vmalert with:
./bin/vmalert -datasource.url=http://localhost:9428 -remoteWrite.url=http://vminsert:8480/insert/multitenant/prometheus ...With the rules below,
recordingTenant123will be queried from VictoriaLogs tenant123and persisted to tenant123in VictoriaMetrics, whilerecordingTenant123-456:789will be queried from VictoriaLogs tenant124and persisted to tenant456:789in VictoriaMetrics.groups: - name: recordingTenant123 type: vlogs headers: - "AccountID: 123" labels: vm_account_id: 123 rules: - record: recordingTenant123 expr: 'tags.path:/var/log/httpd OR tags.path:/var/log/nginx | stats by (tags.host) count() requests' - name: recordingTenant124-456:789 type: vlogs headers: - "AccountID: 124" labels: vm_account_id: 456 vm_project_id: 789 rules: - record: recordingTenant124-456:789 expr: 'tags.path:/var/log/httpd OR tags.path:/var/log/nginx | stats by (tags.host) count() requests'Run the enterprise version of vmalert with
-clusterModeenabled, and specify the tenant parameter for each group.For example, run vmalert with:
./bin/vmalert -datasource.url=http://localhost:9428 -clusterMode=true -remoteWrite.url=http://vminsert:8480/ ...With the rules below,
recordingTenant123will be queried from VictoriaLogs tenant123and persisted to tenant123in VictoriaMetrics, whilerecordingTenant123-456:789will be queried from VictoriaLogs tenant124and persisted to tenant456:789in VictoriaMetrics.groups: - name: recordingTenant123 type: vlogs headers: - "AccountID: 123" tenant: "123" rules: - record: recordingTenant123 expr: 'tags.path:/var/log/httpd OR tags.path:/var/log/nginx | stats by (tags.host) count() requests' - name: recordingTenant124-456:789 type: vlogs headers: - "AccountID: 124" tenant: "456:789" rules: - record: recordingTenant124-456:789 expr: 'tags.path:/var/log/httpd OR tags.path:/var/log/nginx | stats by (tags.host) count() requests'
How to use one vmalert for VictoriaLogs and VictoriaMetrics rules at the same time? #
We recommend running separate instances of vmalert for VictoriaMetrics and VictoriaLogs.
However, vmalert supports having many groups with different rule types (vlogs, prometheus, graphite).
Only one -datasource.url command-line flag can be specified, so it can’t be configured with more than one datasource.
VictoriaMetrics and VictoriaLogs datasources have different query path prefixes, so it is possible to use
vmauth
to route requests of different types between datasources.
See an example of a vmauth config for such routing below:
          unauthorized_user:
      url_map:
        - src_paths:
          - "/api/v1/query.*"
          url_prefix: "http://victoriametrics:8428"
        - src_paths:
          - "/select/logsql/.*"
          url_prefix: "http://victorialogs:9428"
Now vmalert can be configured with -datasource.url=http://vmauth:8427/ to send queries to vmauth,
and vmauth will route them to the specified destinations as in the configuration example above.