VictoriaMetrics Cloud helps users to analyze time series, logging or tracing data and troubleshoot
queries through the built-in Explore utility. This functionality is powered by
VMUI
components and available for metrics, logs and traces.
You can Explore your data accessing to this section in the two following ways:
- Explore page at console.victoriametrics.cloud/explore
- Per deployment, via a dedicated URL pattern:
console.victoriametrics.cloud/deployment/<DEPLOYMENT_ID>/explore
What is VMUI? #
VMUI
is the
native user interface for VictoriaMetrics, designed to help users explore, troubleshoot and optimize
their queries and metrics. In VictoriaMetrics Cloud, this UI is integrated into the Explore view,
offering an accessible toolset to
get instant value from data
.
The VMUI documentation may be found here , which is maintained and updated alongside product releases.
The same approach is used for the VictoriaLogs User Interface, sometimes known as VLUI, which provides
visualization and analysis capabilities for logs data stored in VictoriaLogs deployments, and for the
VictoriaTraces User Interface, which allows browsing and filtering the trace spans stored in
VictoriaTraces deployments.
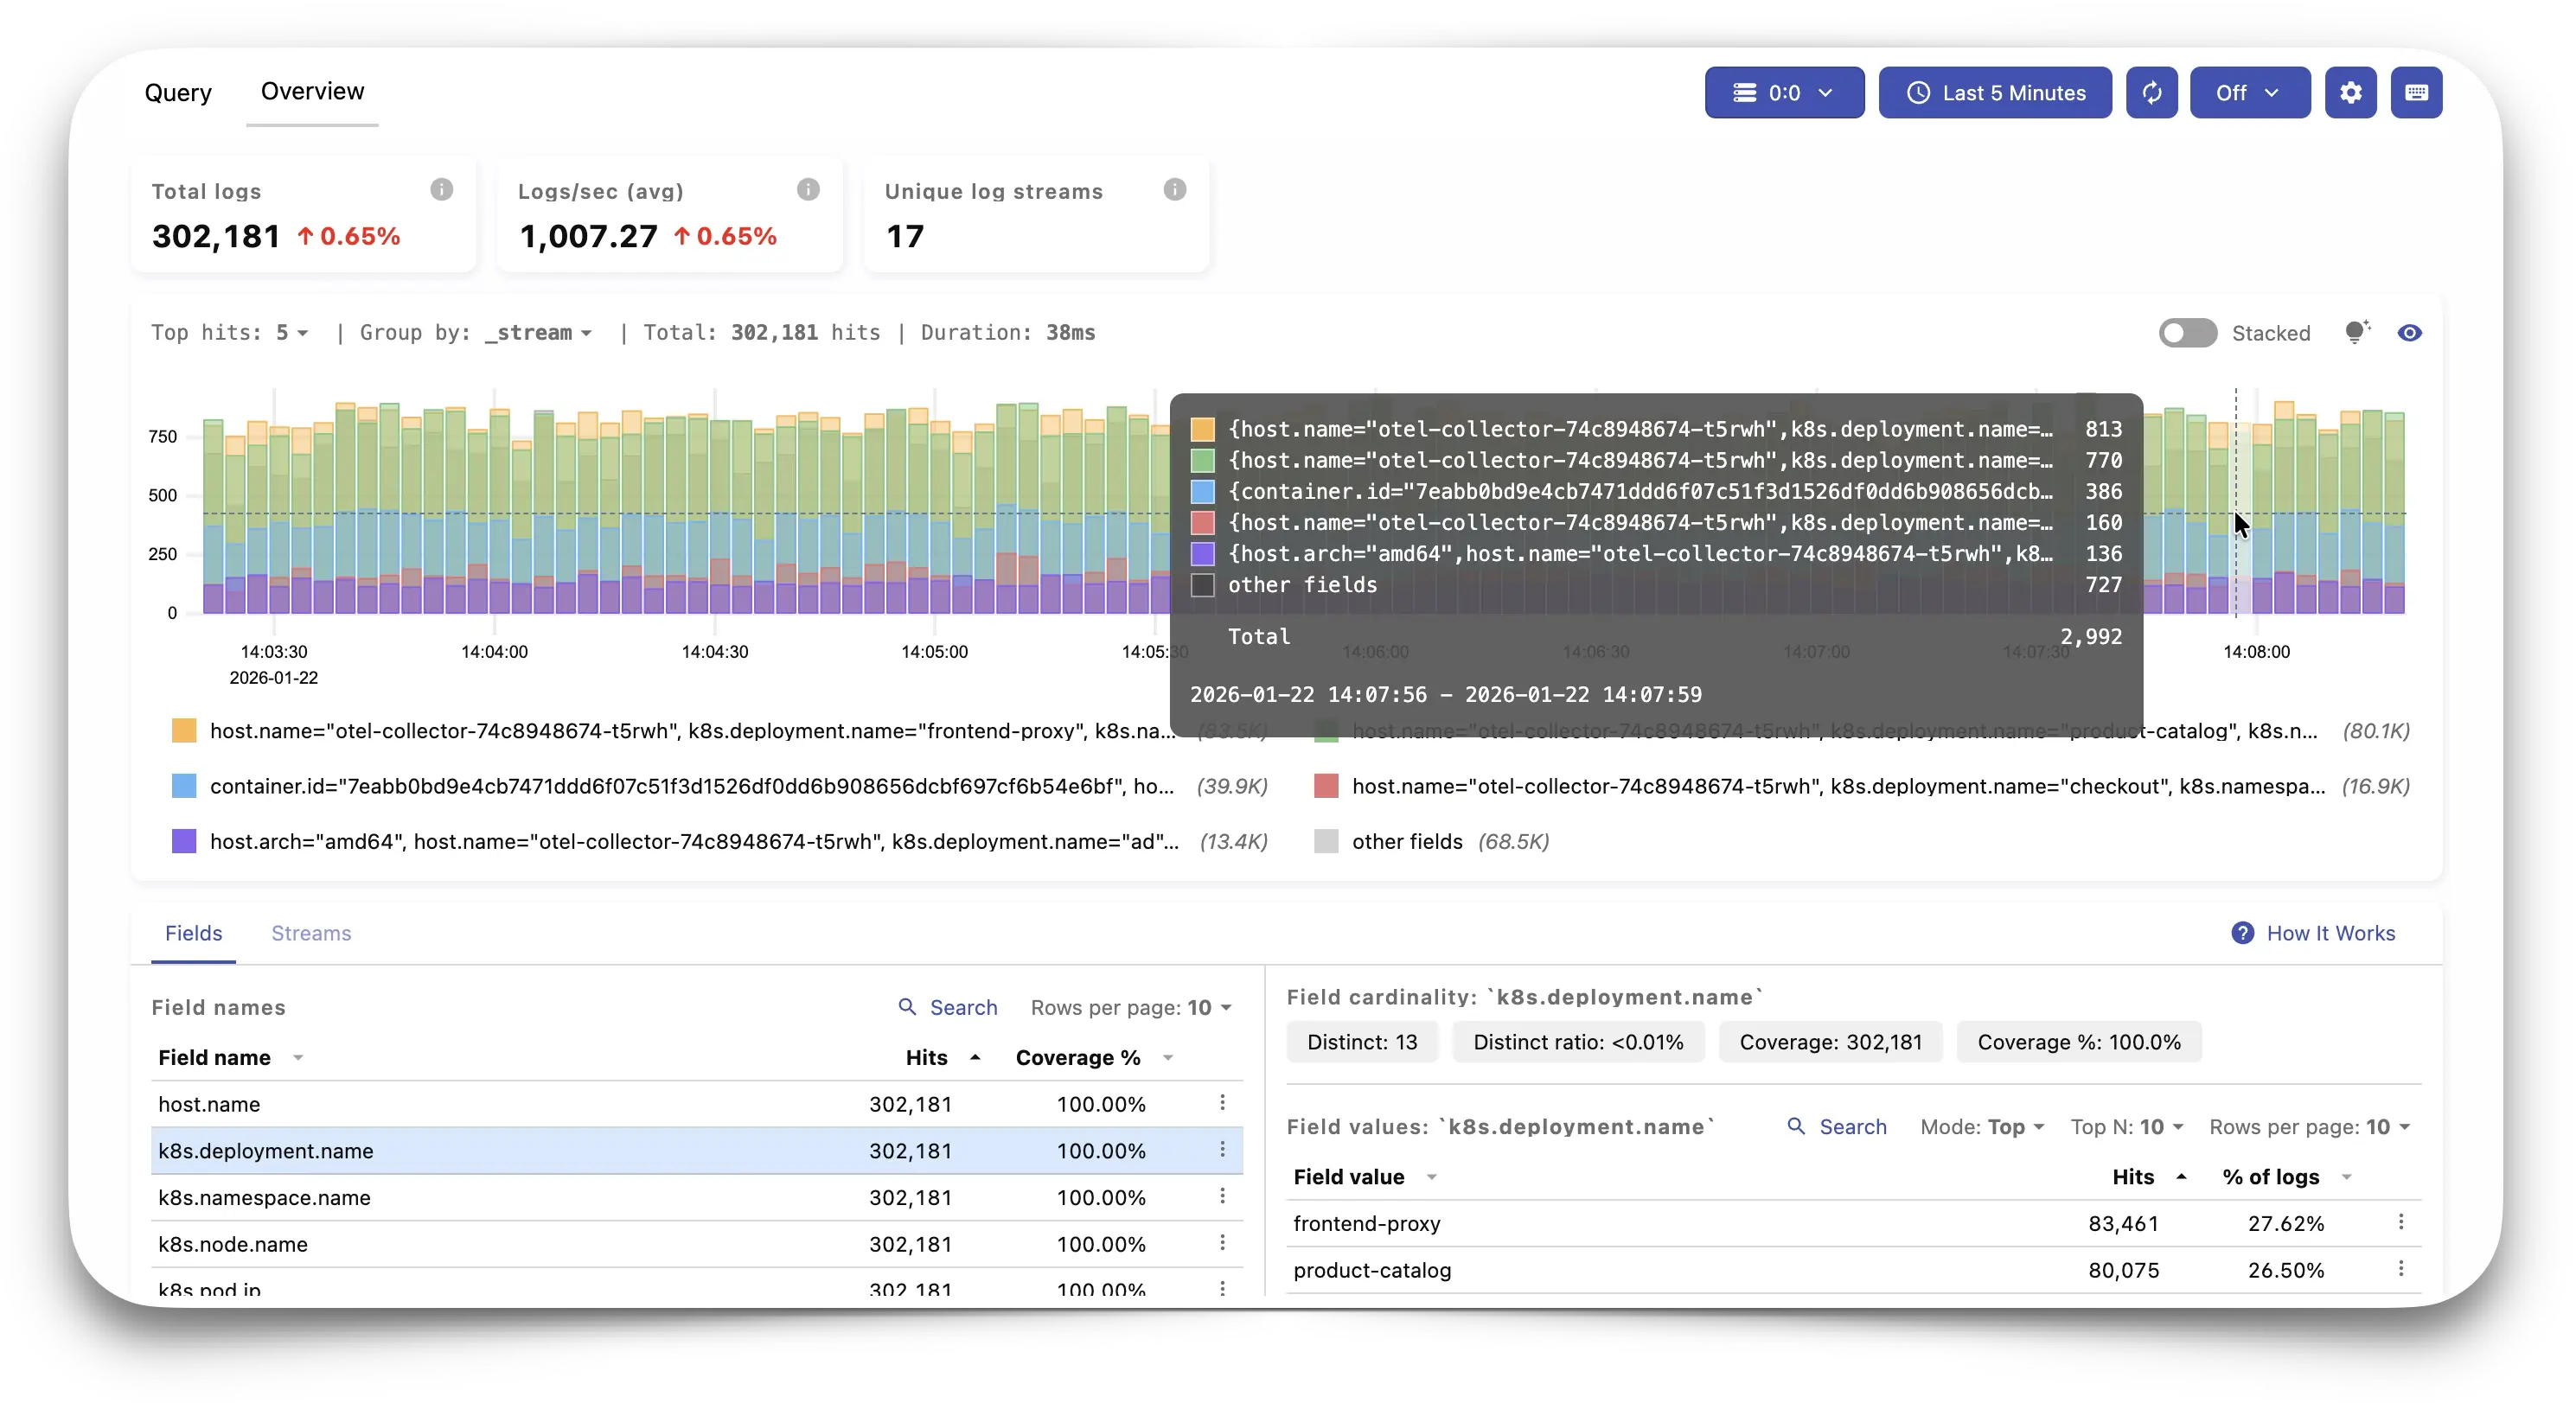
Playground #
The quickest way to discover VMUI is by directly interacting with it. If you are curious, the available playgrounds for VictoriaMetrics , VictoriaLogs and VictoriaTraces allow you to check real examples of different installations of the VictoriaStack. There, you can easily testing and learn the query engine or the relabeling debugger among other tools and pages provided by VMUI.