VictoriaTraces deployments are in beta! Availability is limited while we gather feedback. If you want VictoriaTraces enabled for your organization, contact us at support@victoriametrics.com .
Exploring data in VictoriaTraces #
This section describes the capabilities available in the Explore section of VictoriaTraces deployments.
You can Explore your data accessing to this section in the two following ways:
- Explore page at console.victoriametrics.cloud/explore
- Per deployment, via a dedicated URL pattern:
console.victoriametrics.cloud/deployment/<DEPLOYMENT_ID>/explore
The VictoriaTraces UI provides two sections: Trace Explorer, to search and filter traces, and Trace ID, which renders the waterfall view of a single trace.
Trace Explorer #
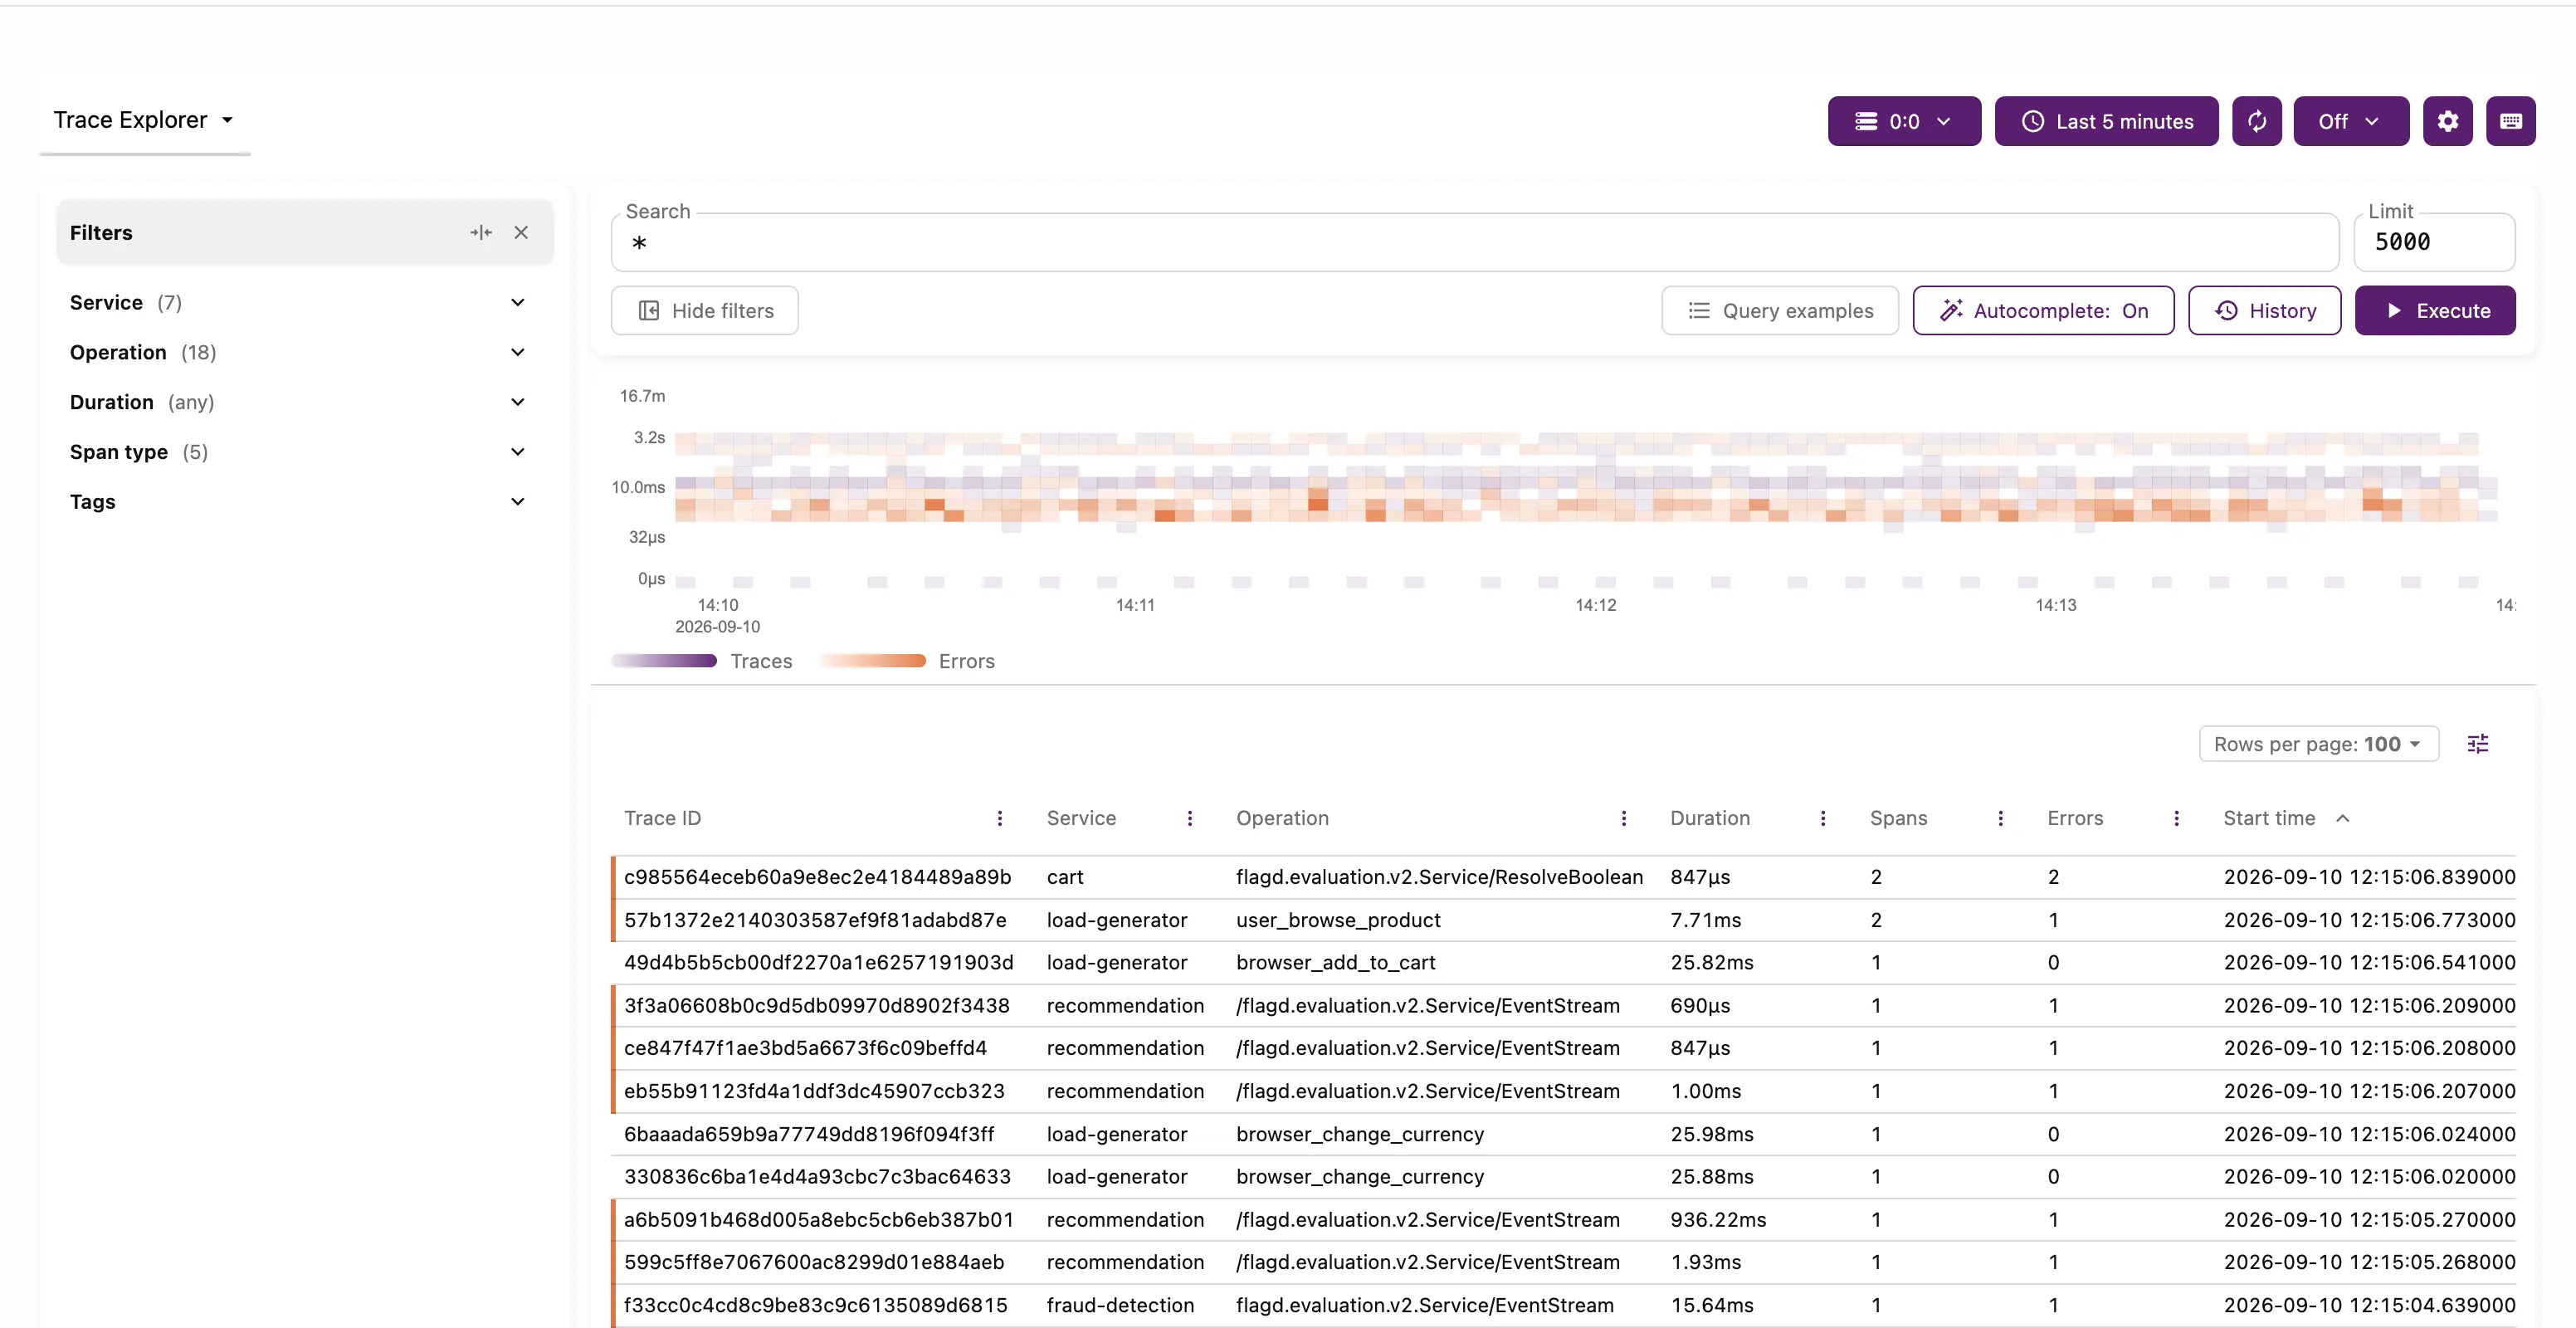
Trace Explorer is the default section. It combines a Filters sidebar, a
LogsQL
query input and a results table, so
you can narrow down traces either by clicking or by writing a query.
The Filters sidebar provides the following sections, each showing how many values are currently
selected:
- Service: the services that reported spans in the selected time range
- Operation: the span names available for the selected services
- Duration: a minimum and maximum duration range, to isolate slow traces
- Span type: the span kind (server, client, producer, consumer, internal)
- Tags: any attribute, selected by
NameandValueand added as a filter badge
Together with the sidebar, in this section you can:
- Select the time range, the tenant, and execute or auto-refresh the query from the header
- Write
LogsQL
queries in the
Searchfield, withAutocompleteto help you,Historyto recover previous queries, andQuery examplesto browse ready-made query patterns by category - Cap the number of returned traces with the
Limitfield - Read the duration heatmap above the results, which shows how traces are distributed over time and duration, with errors highlighted in a separate color scale. Dense or dark areas are a quick way to spot latency and error spikes before filtering further
- Sort and pick the columns of the results table:
Trace ID,Service,Operation,Duration,Spans,ErrorsandStart time, and choose how manyRows per pageto display
In VictoriaTraces, service.name (from the resource attributes) and the span name are used as
stream fields
, which
is why Service and Operation are the fastest filters to narrow down data.
Trace preview #
Clicking a row in the results table opens the Trace preview drawer, a quick summary of that trace
before committing to a full inspection. It shows the trace duration, the number of errors, the
services involved and its Longest span, which usually points at where time was actually spent.
Rows with errors are highlighted in the results table, so they can be spotted without opening them.
Trace ID: the waterfall view #
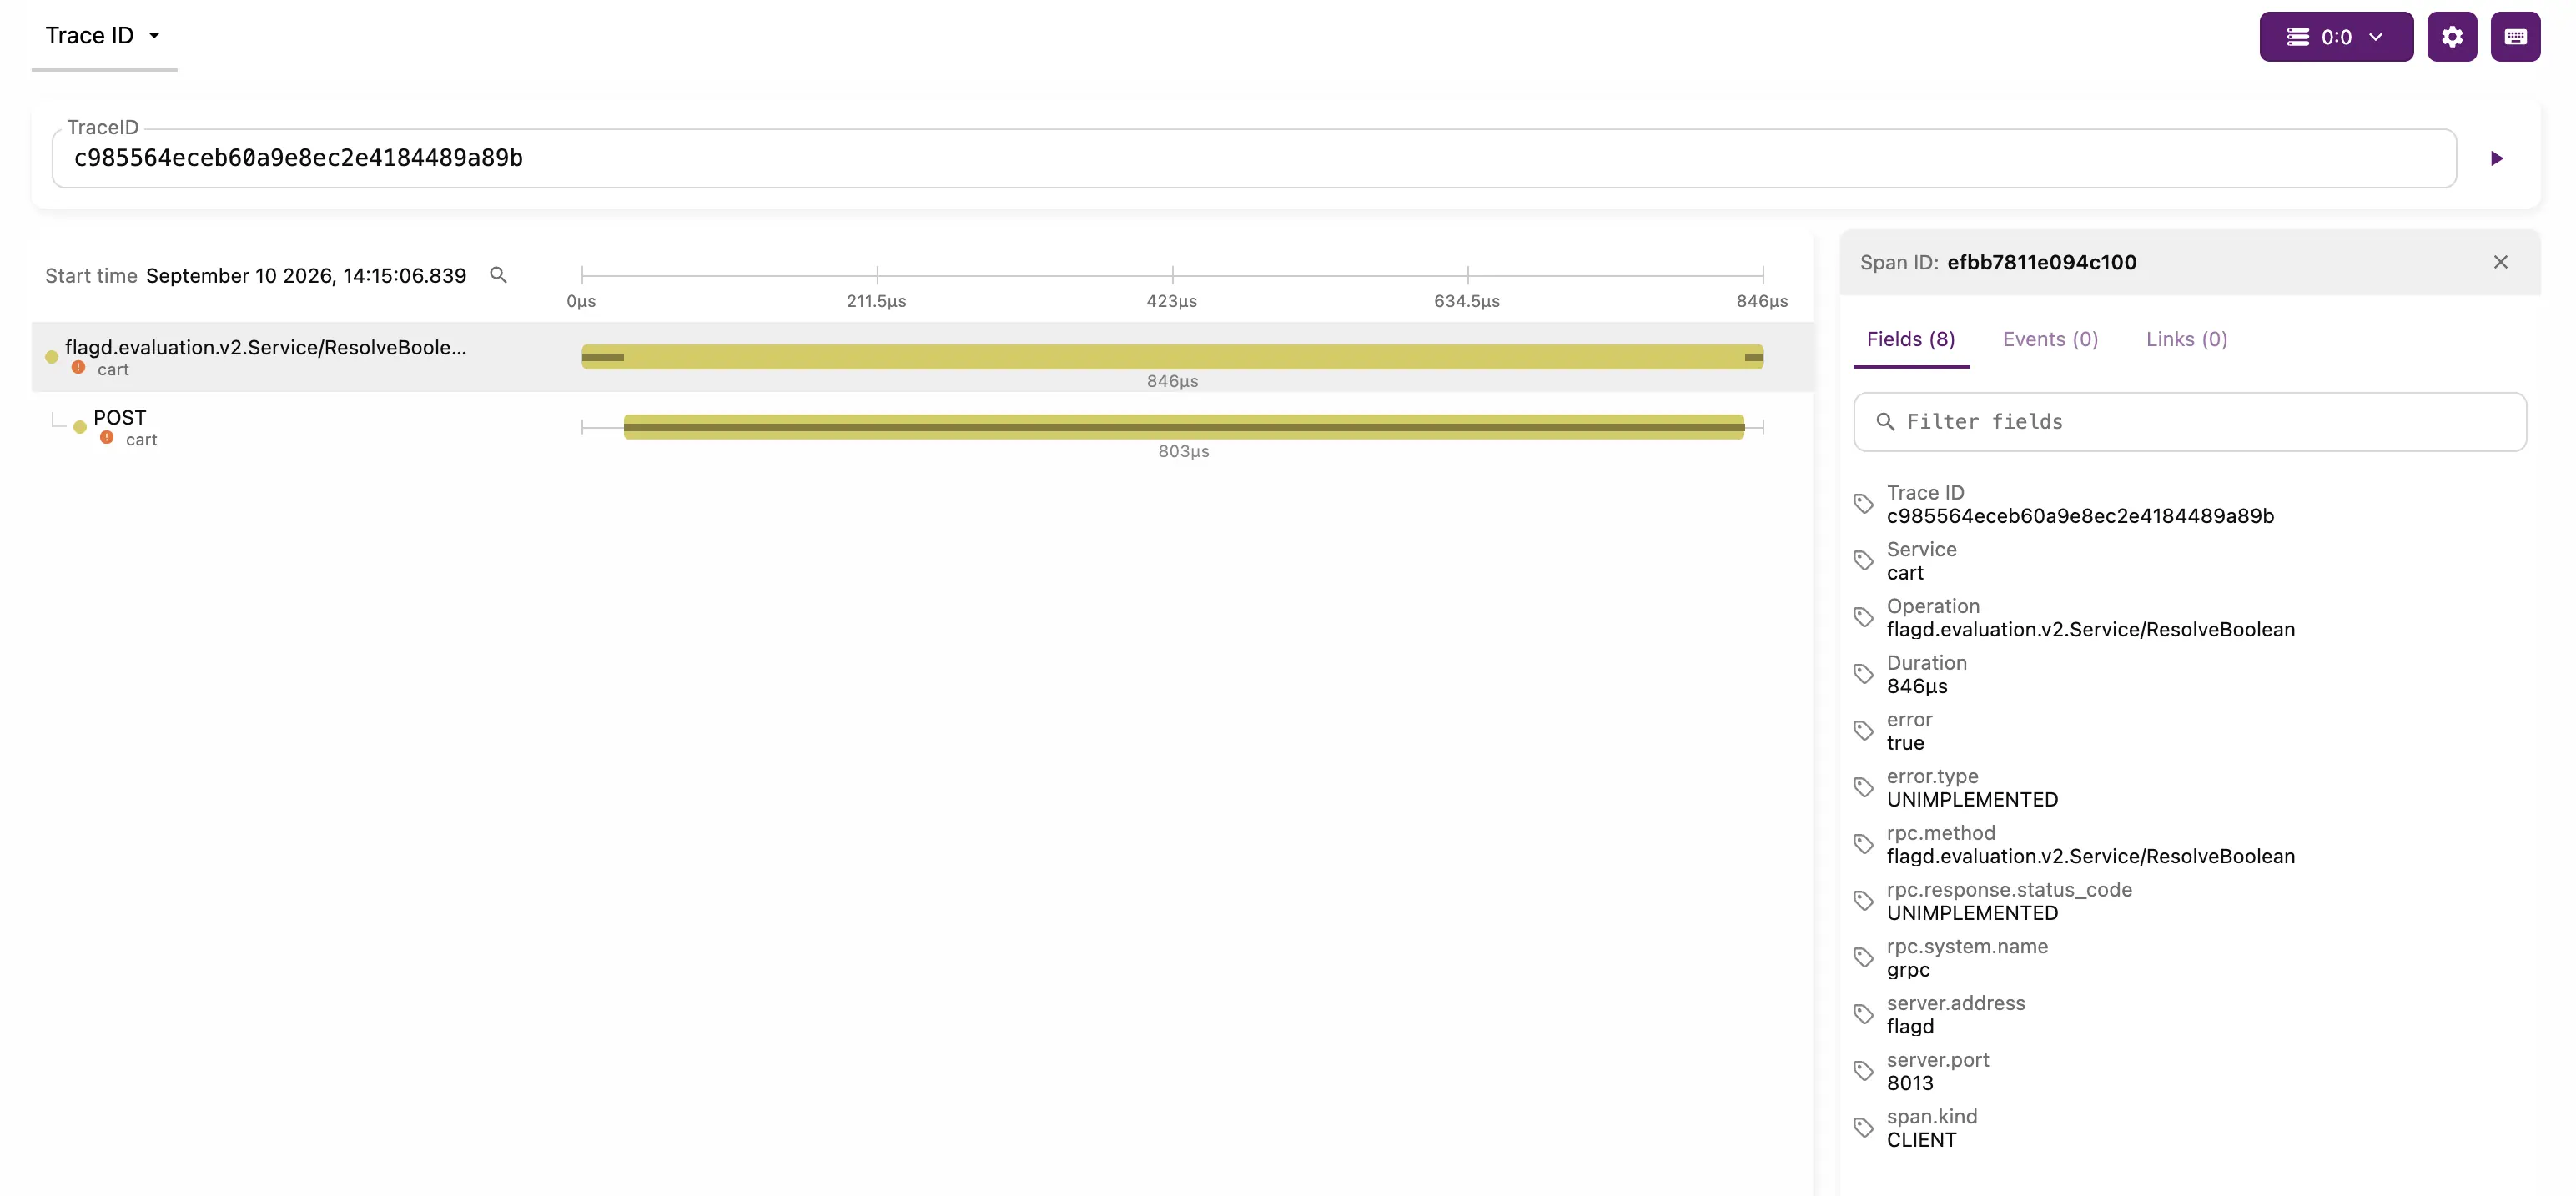
The full waterfall timeline of a trace lives in the Trace ID section. There are three ways to
get there:
- Click
View full tracein theTrace previewdrawer - Click the
Open trace viewaction of a row in the results table - Open the
Trace IDsection directly, paste a trace ID and clickExecute
The third option is the one to use when the trace ID comes from a log line, an alert or an error message, since no filtering is needed to find it.
In the timeline you can:
- See every span of the trace, nested under its parent, positioned by its start time and sized by its duration, with each span labeled by its operation and service and marked when it carries an error
- Read the trace
Start timeand the duration scale on top of the waterfall - Search within the trace to highlight matching spans
- Select any span to open its details panel, identified by its
Span ID - Switch between the Fields, Events and Links tabs of the selected span.
FieldslistsTrace ID,Service,OperationandDurationtogether with every resource, instrumentation scope and span attribute (error,rpc.method,server.address,span.kindand so on), and can be narrowed withFilter fields - Follow a linked trace to continue the investigation in another trace
Querying trace spans #
VictoriaTraces is built on top of VictoriaLogs, so trace spans are queried with
LogsQL
, the same query language used for
logs. This means that all LogsQL filters, pipes and stats functions are available for spans too, and
that the Filters sidebar is a shortcut for queries you can also write by hand.
To get started querying spans, the following documentation and guides may be useful:
Visualizing traces outside the console #
Traces can also be queried from your own tooling and dashboards. VictoriaTraces in VictoriaMetrics Cloud exposes both the Tempo and the Jaeger querying APIs:
| Datasource | URL |
|---|---|
| Tempo | <DEPLOYMENT_ENDPOINT_URL>/select/tempo |
| Jaeger | <DEPLOYMENT_ENDPOINT_URL>/select/jaeger |
Both require an Access Token with read access. Step by step instructions, with your deployment URL and token already filled in, are available in the Grafana and Perses integration pages, and in the Cloud console .
Playground #
The quickest way to discover how trace spans are structured and stored is by directly interacting with them. The VictoriaTraces playground allows you to query real trace data, and the Grafana playground shows the same data visualized as traces.