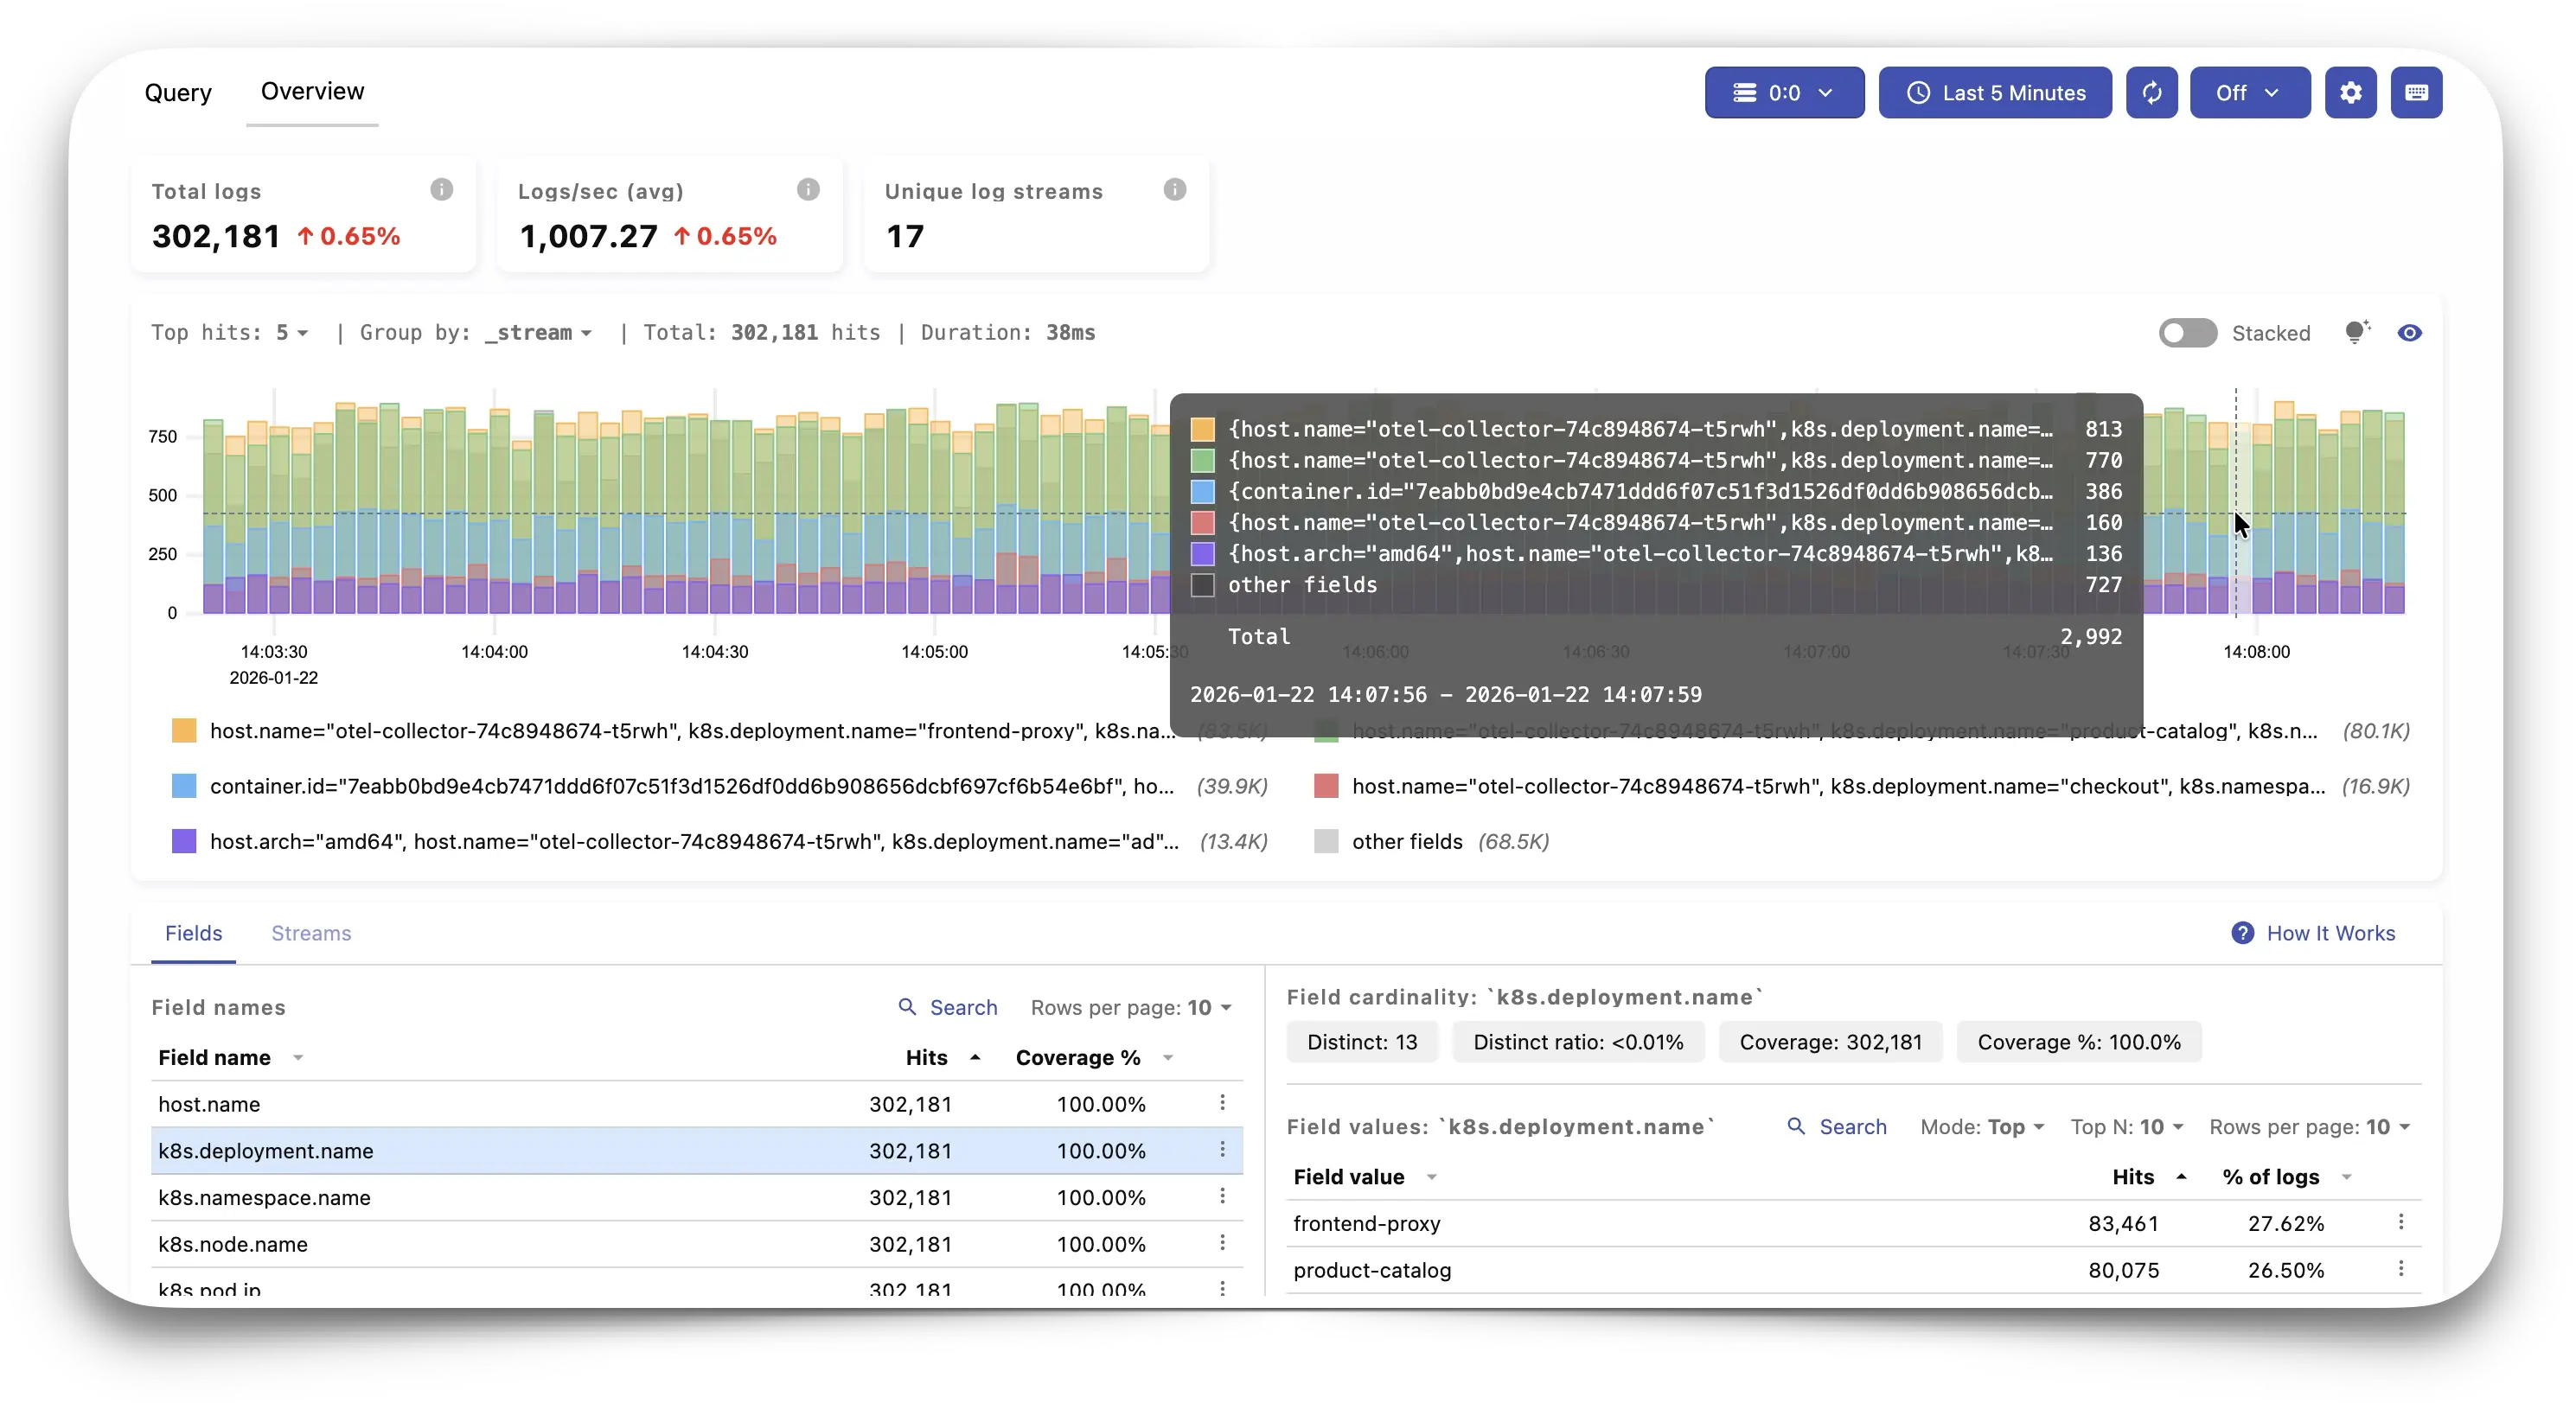
VictoriaMetrics Cloud helps users to analyze time series data and troubleshoot queries through the built-in Explore utility, powered by VMUI . This functionality is directly accessible in the two following ways:

  1. Explore page at console.victoriametrics.cloud/explore ,
  2. Per deployment, via a dedicated URL pattern: console.victoriametrics.cloud/deployment/<DEPLOYMENT_ID>/explore

What is VMUI? #

Full VMUI documentation may be found here , which is maintained and updated alongside product releases.

VMUI is the native user interface for VictoriaMetrics, designed to help users explore, troubleshoot, and optimize their queries and metrics. In VictoriaMetrics Cloud, this UI is integrated into the Explore view, offering an accessible toolset to get instant value from data .

Playground #

The best way to understand VMUI is by directly interacting with it. If you are curious, the available playground allows you to check a real example of a VictoriaMetrics Cluster installation. It is available for testing the query engine, relabeling debugger, other tools and pages provided by VMUI.

Visual Query Exploration #

The Query utility in the Explore page allows you to easily:

  • Visualize your own data in graphs, table or json formats
  • Combine several queries at the same time
  • Prettify your queries to improve readability
  • Autocomplete to help you writing queries
  • Trace your queries to understand behavior
Query
Visual Query Exploration in VictoriaMetrics Cloud

Exploring metrics #

VMUI provides built-in tools to analyze the structure and volume of your metrics data:

  • Explore Prometheus Metrics helps you browse available metrics by job and instance, allowing to build simple charts by just selecting metric names.
  • Explore Cardinality offers insight into the complexity of your time series data, including label dimensions, high-cardinality metrics, and label usage statistics. This is especially useful for optimizing storage and query performance.
  • Top Queries By tracking the last 20,000 queries with durations of at least 1ms, it shows the most frequently executed queries, those with the highest average execution time, and those with the longest cumulative execution time.
  • Active Queries lists currently running queries along with execution duration, time range, and the client that initiated them.
These tools can help you to understand your observability footprint

For example, preventing issues related to excessive cardinality, or debugging performance bottlenecks to identify inefficient queries in real time.

Metrics and Cardinality Explorer

Debugging and Analysis Utilities #

VMUI offers the following utilities for in-depth debugging:

  • Raw Query lets you inspect raw time series samples, aiding in the diagnosis of unexpected results.
  • Query and Trace Analyzers allow you to export and later re-load queries and execution traces for offline inspection.
  • Tools like the WITH expressions playground, metric relabel debugger, downsampling debugger, and retention filters debugger help validate complex configuration logic and query constructs interactively.
Relabel configs
Explore tools: Relabel configs
Stay up to date!

For the full and always-up-to-date list of features, please refer to the official VMUI documentation .

MetricsQL #

In addition, VictoriaMetrics Cloud supports advanced querying through MetricsQL , a powerful PromQL-compatible language that offers enhancements tailored for high-performance environments. MetricsQL is fully supported in the Explore UI and can also be used in Grafana dashboards for long-term observability workflows.

What is MetricsQL? #

MetricsQL is VictoriaMetrics’ powerful query language, designed as a high-performance, backwards-compatible extension of PromQL (Prometheus Query Language). It retains full compatibility with PromQL syntax while introducing enhancements that make it better suited for large-scale environments and advanced analytics.

Using MetricsQL in VictoriaMetrics Cloud #

MetricsQL is natively supported in the Explore section of VictoriaMetrics Cloud, where you can write, run, and visualize queries in real time. The interface includes autocomplete for MetricsQL syntax, functions, and label selectors—streamlining query creation and reducing the chance of errors.

You can also use MetricsQL in Grafana dashboards by configuring the VictoriaMetrics data source , enabling consistent query logic across operational and visualization layers.

For deeper usage examples and advanced query patterns, please refer to the official MetricsQL documentation .

Key Functionality in MetricsQL #

MetricsQL extends PromQL with several unique capabilities:

  • WITH expressions: Define temporary named subqueries to improve readability and reuse logic across queries.
  • Performance-tuned functions: Functions like avg_over_time, count_over_time, and others are optimized for efficient computation over long durations.
  • Flexible filtering: Enhanced match operators (=~, !~, =, !=) and aggregation logic make it easier to craft precise queries.
  • Downsampling and rate smoothing: Built-in functions help reduce noise and CPU cost for long-range queries.

For a full list of functions and capabilities, see the MetricsQL reference .

Why Use MetricsQL? #

MetricsQL addresses many real-world limitations found in PromQL when working with high-cardinality time series data, large datasets, or complex calculations. It introduces performance optimizations and new functions that enable more flexible, efficient, and maintainable queries. Users benefit from:

  • Better performance on large-scale queries
  • Enhanced expressiveness with additional functions and operators
  • Improved readability through support for WITH expressions (query macros)
  • Lower cost by optimizing query execution paths