VictoriaMetrics Cloud helps optimizing your data and maximizing its value in the most reliable way. It can be used as an Enterprise-level Managed Platform for your Observability data. Once you deploy your instances with a few clicks, sending and visualizing data is very easy:
- VictoriaMetrics: just configure your Prometheus, vmagent , an OpenTelemetry Collector or any agent to write data to VictoriaMetrics Cloud.
- VictoriaLogs: scrape or push your logs directly from your applications, OpenTelemetry collectors, vector, vlagent or any other agent.
Finally, explore your data with the built-in VMUI or VLUI , or create dashboards in Grafana or Perses . For compatibility, VictoriaMetrics instances can be integrated with the Prometheus data source.
Features #
VictoriaMetrics Cloud offers a robust suite of features designed to optimize your cloud experience. Seamless integrations, scalability and cost-saving measures, and comprehensive operational tools ensure that VictoriaMetrics Cloud can support your business needs.
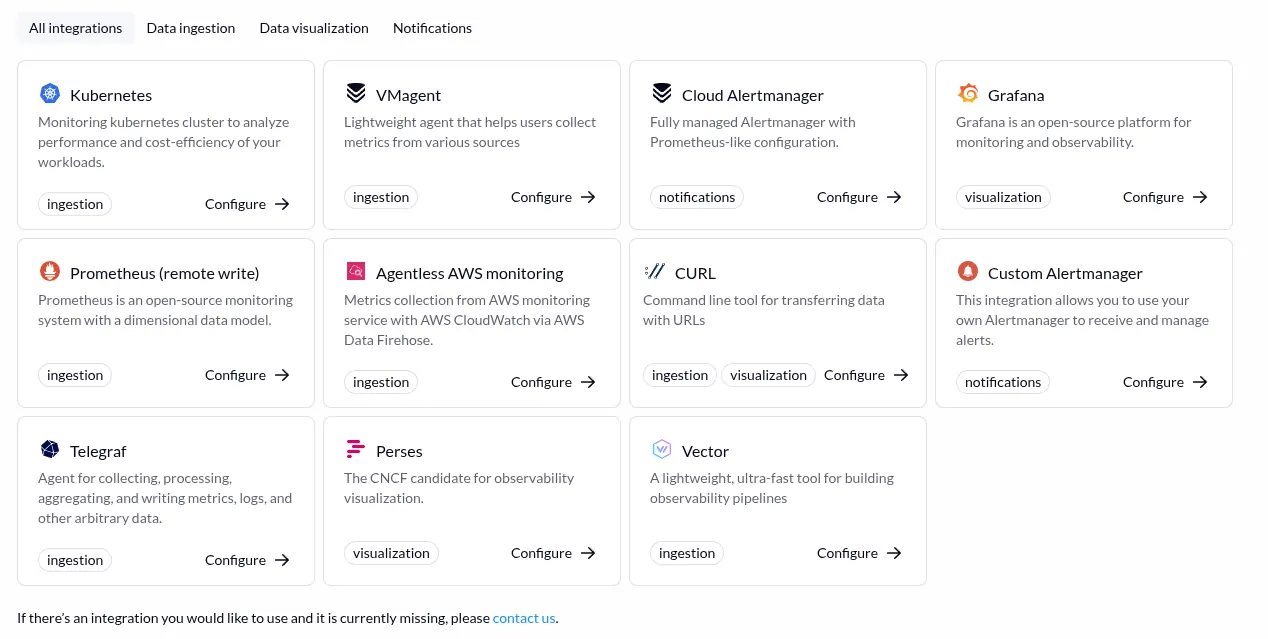
Integrations and Compatibility
- Observability protocols and agents: Prometheus, OpenTelemetry, InfluxDB, DataDog, NewRelic, OpenTSDB, Graphite, FluentBit and Vector.
- Data visualization: Use built-in VictoriaMetrics UI or integrate seamlessly with your current stack to query and visualize your data in Grafana or Perses .
- AWS PrivateLink : enabling even more secure communication with VictoriaMetrics Cloud deployments directly from your VPC.
Scale as you go and save costs
- Easy Scaling: VictoriaMetrics Cloud deployments can be scaled up or down with just a few clicks in line with growth and needs.
- Downsampling: Lower your disk footprint (and save on storage costs!) by keeping fewer data points for historical data and speed up queries for it, while preserving high precision for your operational data.
- Retention filters: Configure a custom retention period on a team (tenant) level or time series level by using label filters so that unneeded time series are wiped out freeing up storage space for new metrics data enabling additional cost savings
- Recording rules: Improve query performance with recording rules, facilitating quicker data access & dashboard responsiveness.
Operations
- Enterprise, managed VictoriaMetrics and VictoriaLogs Solutions: Comes with all the proven features in VictoriaMetrics products. Open Source & Enterprise.
- Fully managed with automatic infrastructure and software versions, including security updates.
- Single-node for both VictoriaMetrics and VictoriaLogs for efficiency and cost-savings.
- Cluster configuration available for VictoriaMetrics instances at scale.
- Built-in Alerting & Recording rules execution. Define your rules & get immediate alerts as issues arise, enabling swift action & minimizing disruption to your users.
- Hosted Alertmanager for sending notifications.
- Isolated Deployments: VictoriaMetrics Cloud provisions dedicated resources for your deployments, so you won’t encounter “noisy neighbors” problems as deployments do not compete for resources.
- Multitenancy: Easily serve multiple teams (tenants) with VictoriaLogs Single or VictoriaMetrics Cluster deployments by having a dedicated namespace for each team.
- Automated Backups: Regular backup procedures are in place. Your data is automatically saved to a backup storage, so you can easily restore it when the need arises.
- High-availability & replication.
- Reliability & extraordinary performance with 99.5% (Single) and 99.95% (Cluster) SLAs.
Get instant value from your data #
VictoriaMetrics Cloud allows you to explore and optimize both your data and deployments.
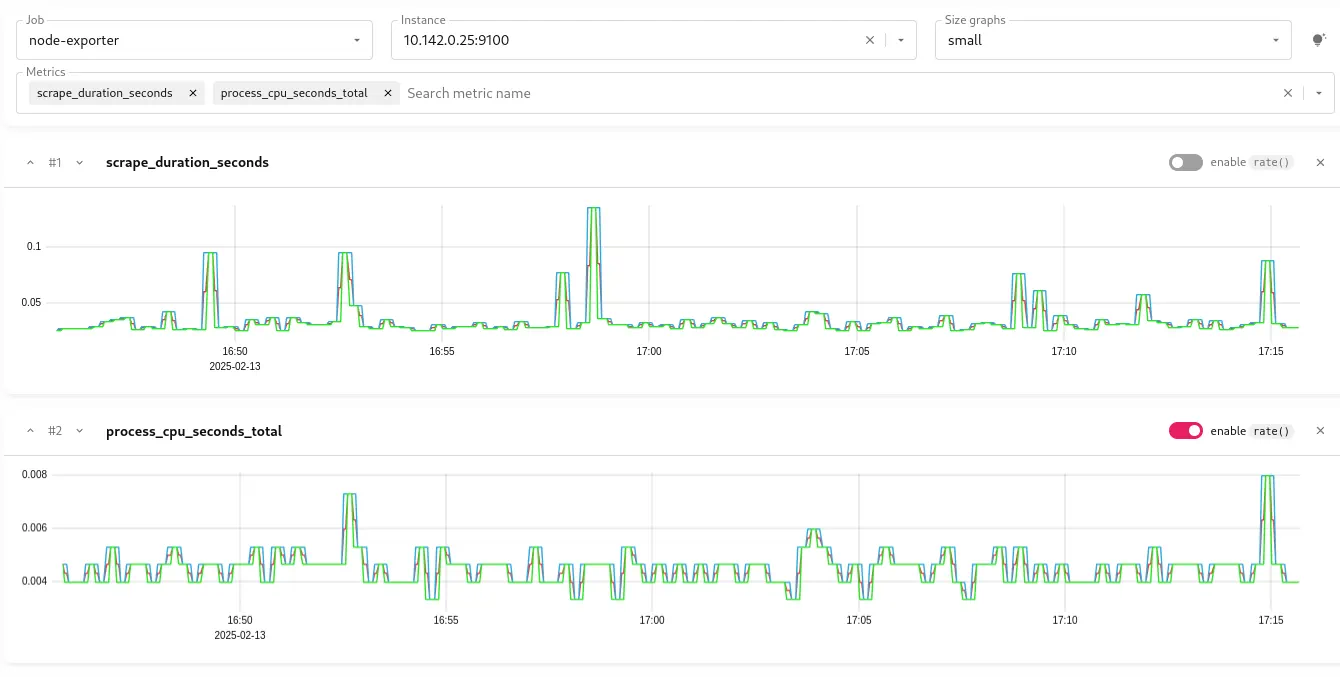
Query your own metrics
- Visualize your own data in graphs, table or json formats
- Combine several queries at the same time
- Prettify your queries to improve readability
- Autocomplete to help you writing queries
- Trace your queries to understand behavior
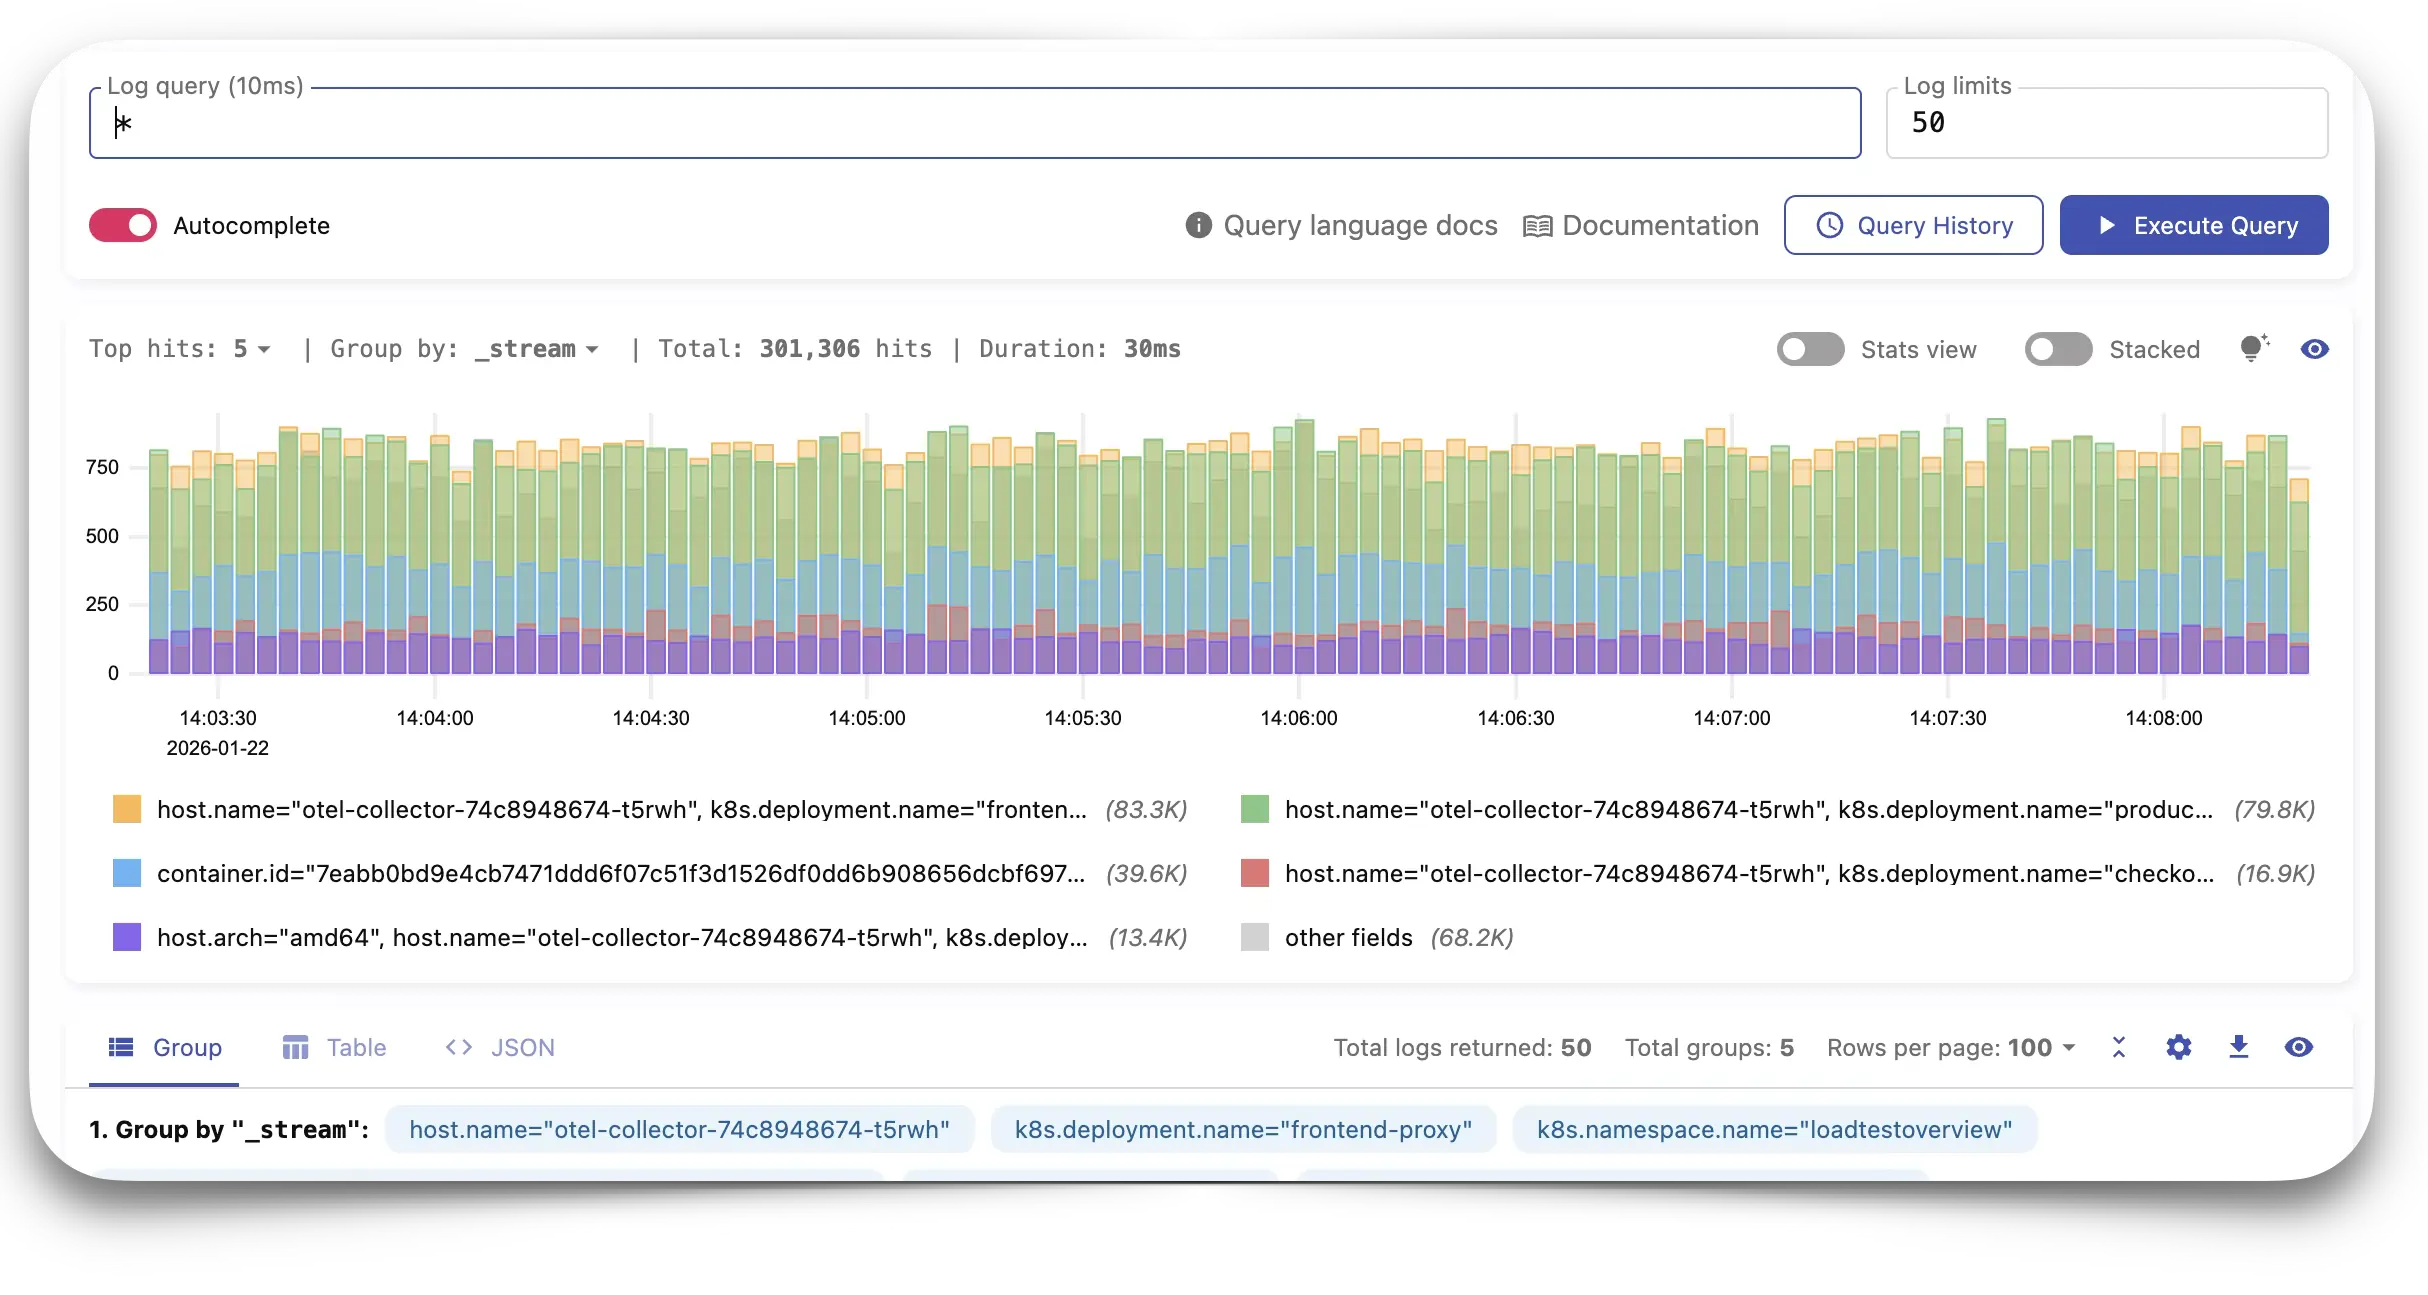
Analyze logs at scale
- Understand your logs behavior through time
- Use LogsQL to maximize value
- Save and search across your querying history, including favorites!
- Autocomplete to help you writing queries
- Overview all your logs at a glance
Explore valuable insights
- List your Prometheus metrics by Job and Instance
- Inspect your time series data cardinality to optimize usage and costs
- Discover top used or heaviest queries

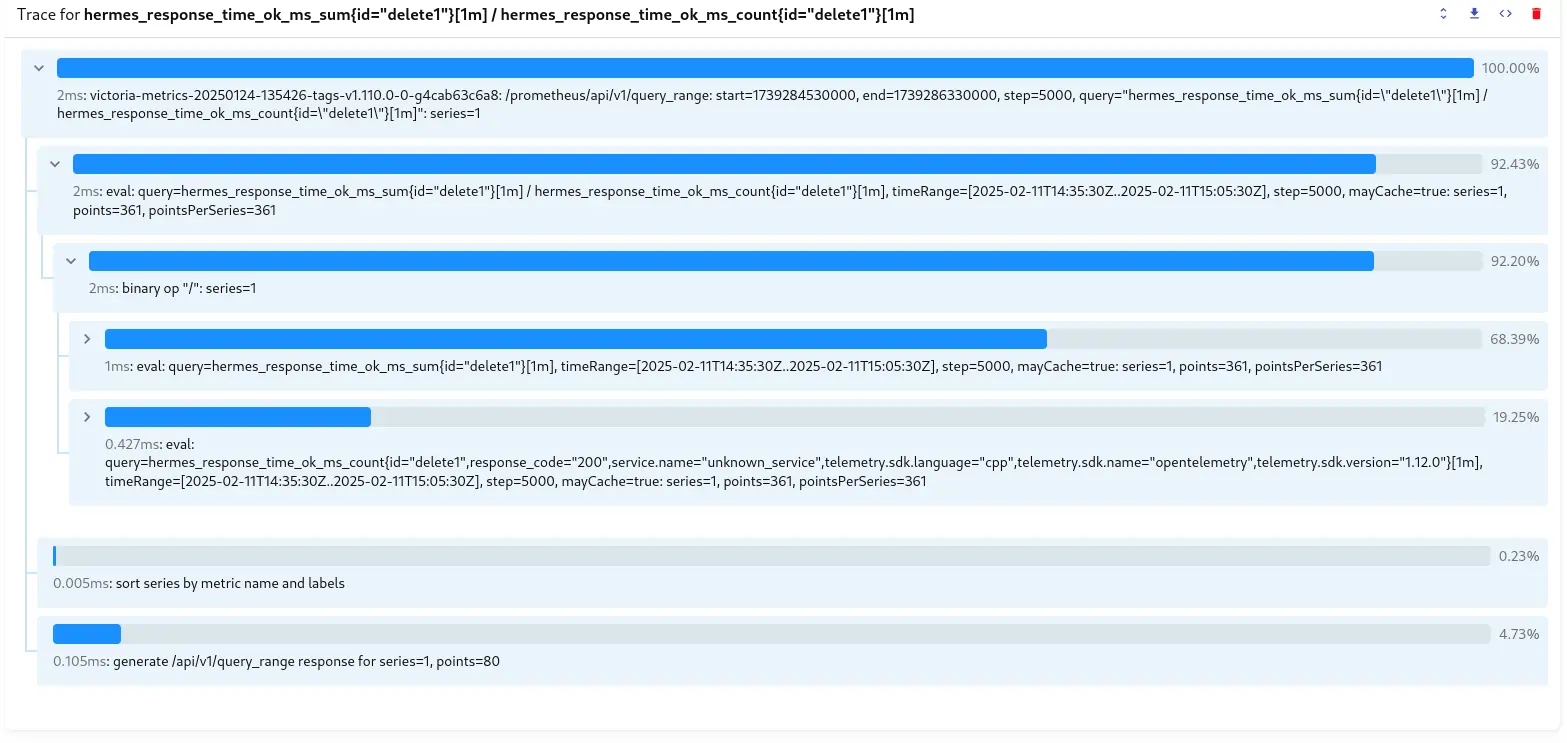
Analyze, debug and learn
- Trace and query analyzer to debug queries
- WITH templating for MetricsQL: functions, variables and filters
- Debug metrics relabling with easy-to-follow examples
Benefits #
In brief, we run VictoriaMetrics Cloud deployments in our AWS environment and provide direct endpoints for data ingestion and querying. The VictoriaMetrics team takes care of optimal configuration and software maintenance. You can think of it as having access to a fully supported, enterprise version of the VictoriaMetrics stack that runs outside your environment, helping you to save resources and costs, without the hustle of performing typical DevOps tasks such as configuration management, monitoring, log collection, access protection, perform software and infrastructure upgrades, store backups regularly or control costs. We take care of that.
VictoriaMetrics Cloud is able to handle larger workloads than competing solutions at a far lower cost.
Easy Migration
- Migrate from costly & less scalable monitoring solutions such as Managed Prometheus service from AWS, GCP or Azure, InfluxDB Cloud, or your on-premises setup.
- Get higher data resolution with much higher cardinality.
- Run more complex queries.
- Save your logs for a rainy day.
- Adapt data resolution through time with downsampling and retention filters.
Enterprise level support
Includes all VictoriaMetrics Enterprise Features Plus:
- Business days & hours support
- 8 hours response time for system impaired issues
Cost-efficient Scaling
- Only pay for the resources that you actually use (compute, disk and network).
- Downsampling and retention filters features enable additional cost-savings.
Ease of Budgeting
No invoice surprises: pick a tier at a fixed price. Our pricing model protects you from surprise overages coming from unexpected changes in workload such as spikes in data ingestion rate, cardinality explosions or accidental heavy queries.
Ease of use
The VictoriaMetrics team takes care of optimal configuration and handles all software maintenance, so you can focus on the monitoring.