The VictoriaMetrics Grafana plugin allows Grafana to query, visualize, and interact with VictoriaMetrics , a high-performance metrics storage and processing system.
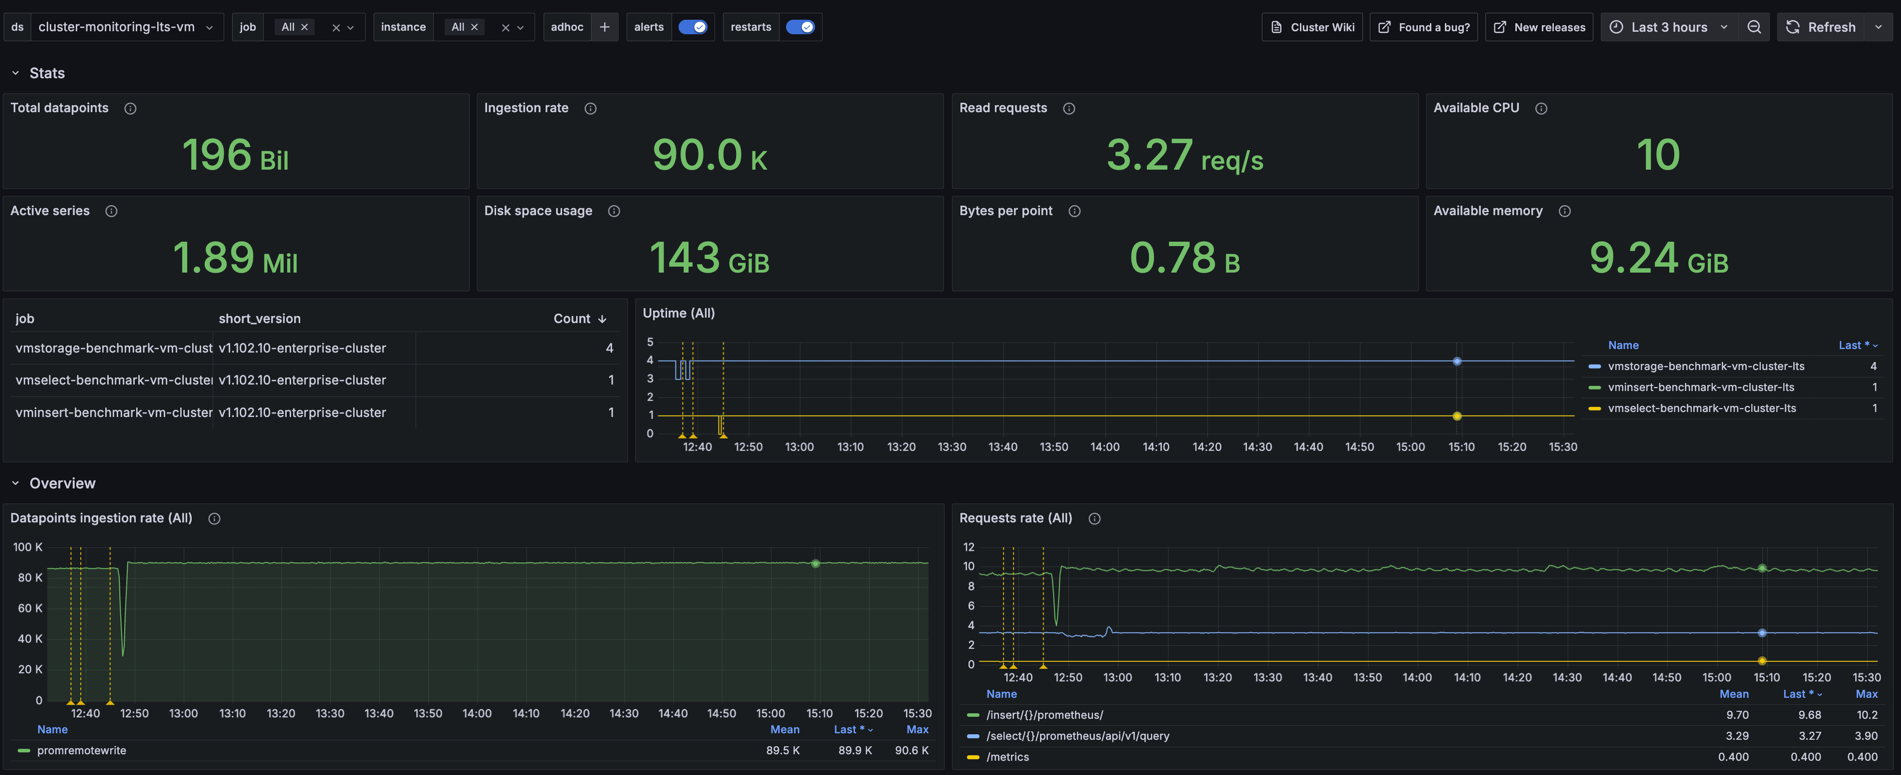
Capabilities #
- Use MetricsQL to query metrics in Grafana.
- Use Explore mode with Grafana.
- Build dashboards and setup alerts.
- Use Ad Hoc filters.
- Template queries and expressions.
- Get insights about query execution bottlenecks via tracing .
- Automatically format queries via
Prettifybutton.
Try it at VictoriaMetrics playground !
Installation #
For detailed instructions on how to install the plugin on Grafana Cloud or locally, please checkout the Plugin installation docs . For installation options in Docker or Kubernetes refer to these docs .
Manual configuration via UI #
Once the plugin is installed on your Grafana instance, follow these instructions to add a new VictoriaMetrics data source, and enter configuration options.
Configuration via file #
Provision of Grafana plugin requires to create datasource config file :
      apiVersion: 1
datasources:
  - name: VictoriaMetrics
    type: victoriametrics-metrics-datasource
    access: proxy
    url: http://victoriametrics:8428
    isDefault: true

  - name: VictoriaMetrics - cluster
    type: victoriametrics-metrics-datasource
    access: proxy
    url: http://vmselect:8481/select/0/prometheus
    isDefault: false
Authentication #
The datasource supports the authentication methods provided by Grafana’s standard HTTP settings (Basic auth, TLS client certificates, custom HTTP headers), plus forwarding the OAuth identity of the signed-in Grafana user.
Forward OAuth Identity #
If Grafana itself authenticates users via OAuth/OIDC (for example, generic OAuth
with Keycloak, Okta, Auth0 or another provider), the datasource can reuse the access token of the logged-in user.
With Forward OAuth Identity enabled, Grafana adds the user’s Authorization: Bearer <access token> header
(and X-Id-Token, when available) to every request the plugin sends to the configured URL:
data queries, health check (“Save & test”) and autocomplete/resource requests.
To enable it in the UI, turn on the Forward OAuth Identity toggle in the Auth section of the datasource settings.
To enable it via provisioning, set jsonData.oauthPassThru: true:
      apiVersion: 1
datasources:
  - name: VictoriaMetrics
    type: victoriametrics-metrics-datasource
    access: proxy
    # vmauth validates the forwarded JWT and routes the request to VictoriaMetrics
    url: http://vmauth:8427
    jsonData:
      oauthPassThru: true
This pairs naturally with vmauth in front of VictoriaMetrics: vmauth can verify the forwarded JWT via OIDC discovery and authorize/route requests based on token claims via JWT claim matching :
      # vmauth -auth.config
users:
  - jwt:
      oidc:
        issuer: "https://sso.example.com/realms/main"
      match_claims:
        # authorize and route requests based on any JWT claims
        team: "observability"
      # Required for tokens issued by general-purpose identity providers
      # (Keycloak, Okta, Auth0, ...) which don't embed the VictoriaMetrics-specific
      # `vm_access` claim, see the note below.
      default_vm_access_claim: {}
    url_prefix: "http://victoriametrics:8428/"
Note about the vm_access claim: since vmauth v1.147.0, a JWT token without the vm_access claim
falls through to unauthorized_user and is rejected unless default_vm_access_claim is configured
in the jwt section. Tokens issued by general-purpose identity providers normally don’t contain vm_access,
so either set default_vm_access_claim (as in the example above) or configure your identity provider
to embed the
vm_access claim
.
The rejection is silent by default — run vmauth with -logInvalidAuthTokens to see the reason.
Limitations: the forwarded token exists only within the session of a signed-in user. Features that run without a user context — alerting and recording rules, public dashboards, reporting — send requests without the token and will be rejected by the auth proxy. For those, use a service credential (for example, Basic auth or a bearer token on a separate datasource).
Building queries #
VictoriaMetrics query language is MetricsQL - query language inspired by PromQL. MetricsQL is backwards-compatible with PromQL, so Grafana dashboards backed by Prometheus datasource should work the same after switching from Prometheus to VictoriaMetrics. However, there are some intentional differences between these two languages.
Queries can be built using raw MetricsQL or via QueryBuilder. Overall, dashboarding experience is the same as with Prometheus datasource.
See panels examples at VictoriaMetrics playground .
How to use WITH templates #
The WITH templates feature simplifies the construction and management of complex queries. You can try this feature in the WITH templates playground
.
The “WITH templates” section allows you to create expressions with templates that can be used in dashboards.
WITH expressions are stored in the datasource object. If the dashboard gets exported, the associated WITH templates will not be included in the resulting JSON (due to technical limitations) and need to be migrated separately.
Defining WITH Expressions #
- Navigate to the dashboard where you want to add a template.
Note: templates are available within the dashboard scope. - Click the
WITH templatesbutton. - Enter the expression in the input field. Once done, press the
Savebutton to apply the changes. For example:
      commonFilters = {instance=~"$node:$port",job=~"$job"},

\# cpuCount is the number of CPUs on the node
cpuCount = count(count(node_cpu_seconds_total{commonFilters}) by (cpu)),

\# cpuIdle is the sum of idle CPU cores
cpuIdle = sum(rate(node_cpu_seconds_total{mode='idle',commonFilters}[5m]))
You can specify a comment before the variable and use markdown in it. The comment will be displayed as a hint during auto-completion. The comment can span multiple lines.
Using WITH Expressions #
After saving the template, you can enter it into the query editor field:
((cpuCount - cpuIdle) * 100) / cpuCount
Thus, the entire query will look as follows:
      WITH (
 commonFilters = {instance=~"$node:$port",job=~"$job"},
 cpuCount = count(count(node_cpu_seconds_total{commonFilters}) by (cpu)),
 cpuIdle = sum(rate(node_cpu_seconds_total{mode='idle',commonFilters}[5m]))
)
((cpuCount - cpuIdle) * 100) / cpuCount
To view the raw query in the interface, enable the Raw toggle.
Correlations #
Signals can be correlated together if they share the same list of attributes, so they can uniquely identify the same system or event. Grafana provides various interfaces for the correlations feature for interactive links between visualizations.
Trace to metrics #
Will be supported since Grafana@v12.4.0 . See issue #392 .
Tempo, Jaeger, and Zipkin data sources support Trace to metrics feature for navigating from a span in a trace directly to metrics relevant for attributes of that trace.
Metric to logs #
Metric to logs correlation can be configured using correlations interface:


Then, in Grafana’s Explore mode click on the specified field will open a split view of Logs datasource already filtered
by the configured fields:

Metric to traces #
VictoriaMetrics storage doesn’t support exemplars for traversing from time series to specific trace.
Jumping from the metric to traces is still possible via correlations
interface in the same fashion as described in Metrics to Logs section above.
FAQ #
How to convert dashboard from Prometheus to VictoriaMetrics datasource? #
Make sure that VictoriaMetrics datasource plugin is installed , and a new datasource is created from the plugin.
Each panel in Grafana dashboard has a datasource dropdown when in Edit mode. Just choose the VictoriaMetrics datasource instead of Prometheus datasource in dropdown.
If datasource is configured via Grafana variable, then change variable to VictoriaMetrics datasource type.
Why VictoriaMetrics datasource doesn’t support alerting? #
Grafana doesn’t allow forwarding Alert requests to alerting API /api/v1/rules for plugins which are not of Prometheus or Loki type.
See more details here
.
License #
This project is licensed under the AGPL-3.0-only .