VictoriaMetrics integrates with Grafana using either Prometheus datasource or VictoriaMetrics datasource plugins.
Resources:
VictoriaMetrics datasource #
Create VictoriaMetrics datasource in Grafana with the following URL for single-server:
http://<victoriametrics-addr>:8428
Replace <victoriametrics-addr> with the VictoriaMetrics hostname or IP address.
For the cluster version, use vmselect address:
http://<vmselect-addr>:8481/select/<tenant>/prometheus
Replace <vmselect-addr> with the hostname or IP address of vmselect service.
If you have more than 1 vmselect, configure
load-balancing
.
Replace <tenant> based on your
multitenancy settings
.
Once connected, you can start building graphs and dashboards using PromQL or MetricsQL .
VictoriaMetrics datasource is publicly available on GitHub . See more in plugin docs .
Creating a datasource may require specific permissions . If you don’t see an option to create a data source - try contacting system administrator.
Prometheus datasource #
Create Prometheus datasource in Grafana. Follow the same connection instructions as for VictoriaMetrics datasource .
In the “Type and version” section set the type to “Prometheus” and the version to at least “2.24.x”. This allows Grafana to use a more efficient API to get label values:
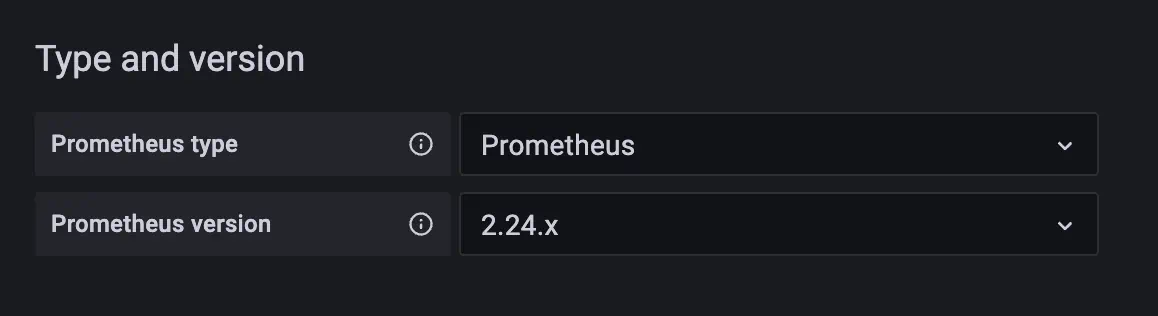
Once connected, you can build graphs and dashboards using PromQL .
Creating a datasource may require specific permissions . If you don’t see an option to create a data source - try contacting system administrator.
Multi-tenant access with vmauth and OIDC #
vmauth can proxy Grafana datasource requests and enforce per-user multi-tenant access using JWT tokens Available from v1.138.0 from an OIDC provider.
When Grafana is configured with OAuth, enable Forward OAuth identity on the datasource so Grafana forwards the user’s
JWT to vmauth with each query. vmauth validates the token and uses the vm_access claim to route requests to the
correct tenant or apply label filters — users only see metrics belonging to their tenant.
See the full walkthrough in the guide Multi-Tenant Access with Grafana & OIDC and JWT token auth proxy .