VictoriaMetrics integrates with Perses via Prometheus plugins .
Plugins setup #
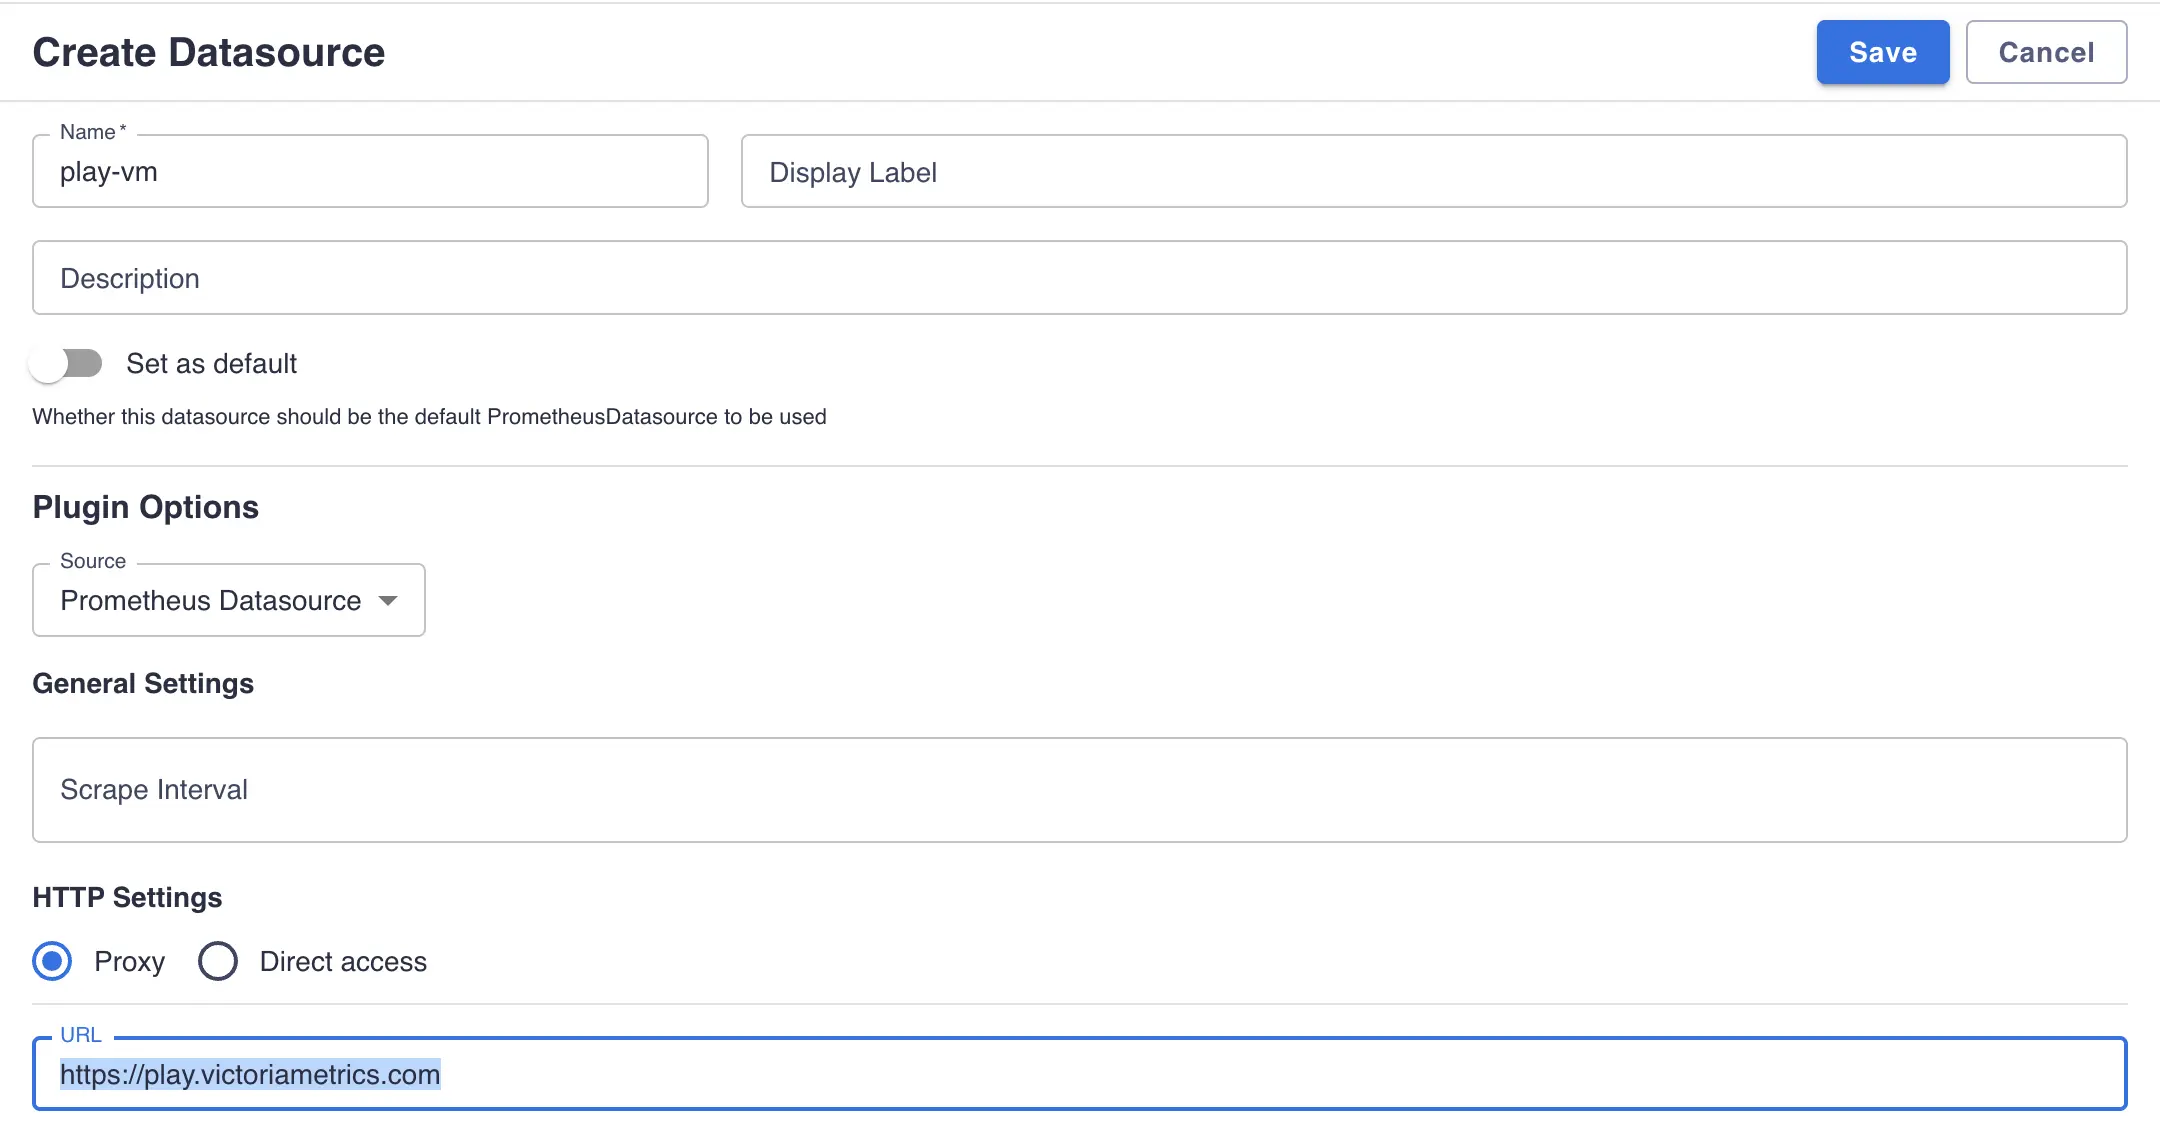
Datasource plugin #
- Go to
http://<perses-url>/projects/<project-name>/datasourcesand clickADD DATASOURCE. - Fill
Namefield with desired datasource name and selectPrometheus DatasourceinSourcedropdown. - Choose
ProxyorDirect accessdepending on the public availability of your VictoriaMetrics instance. - Click
Saveto submit.
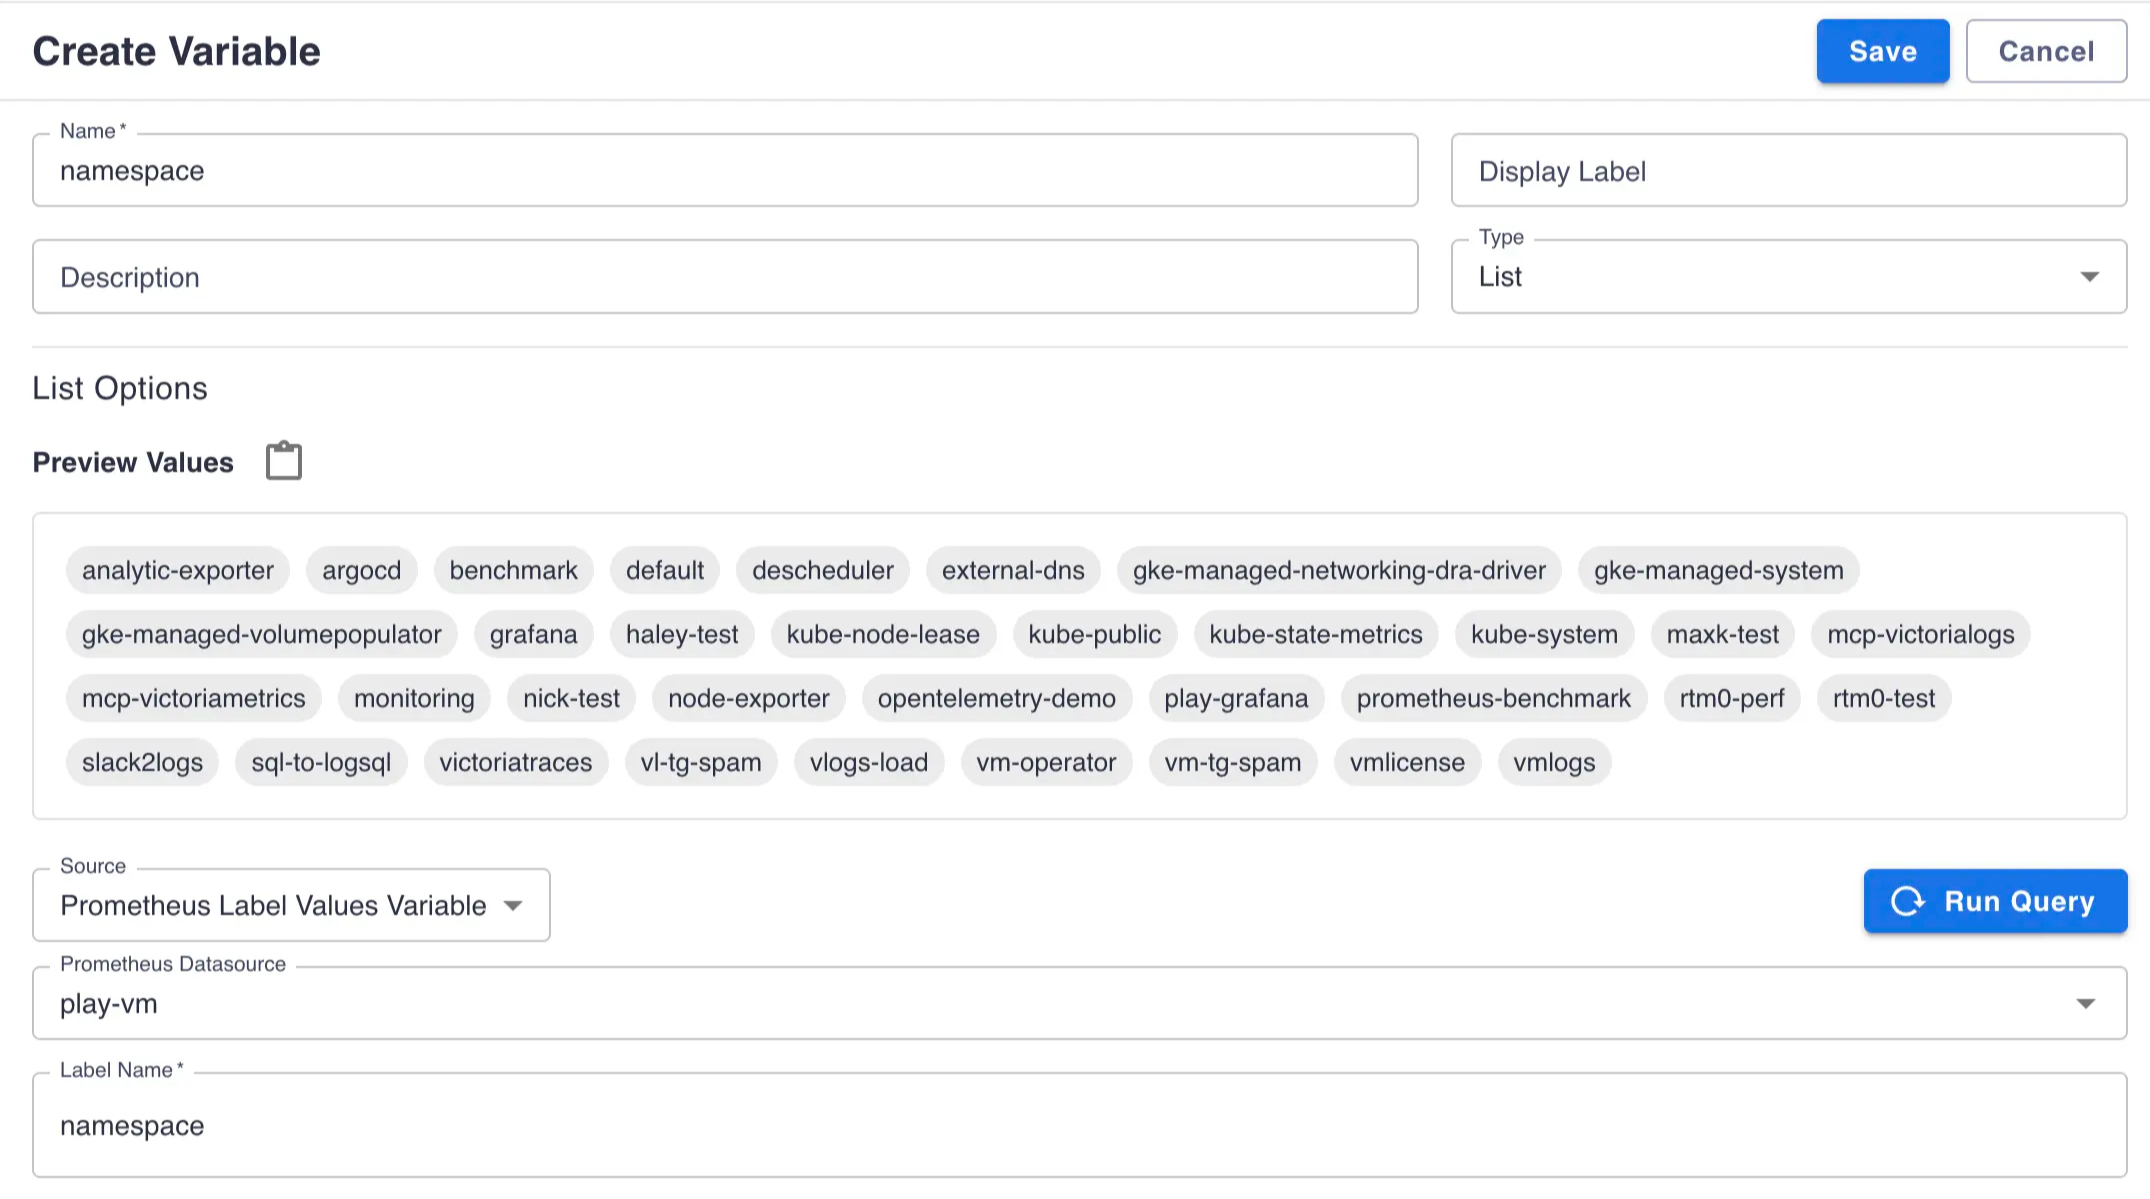
Variables plugin #
- Go to
http://<perses-url>/projects/<project-name>/variablesand clickADD VARIABLE. - Fill
Namefield with desired variable name. - Select
ListinTypedropdown. - Select
Prometheus Label Values VariableinSourcedropdown. - Select the Prometheus datasource you previously created from the
Prometheus Datasourcedropdown. - Type the name of a label in
Label Namefield. - Click
Saveto submit.
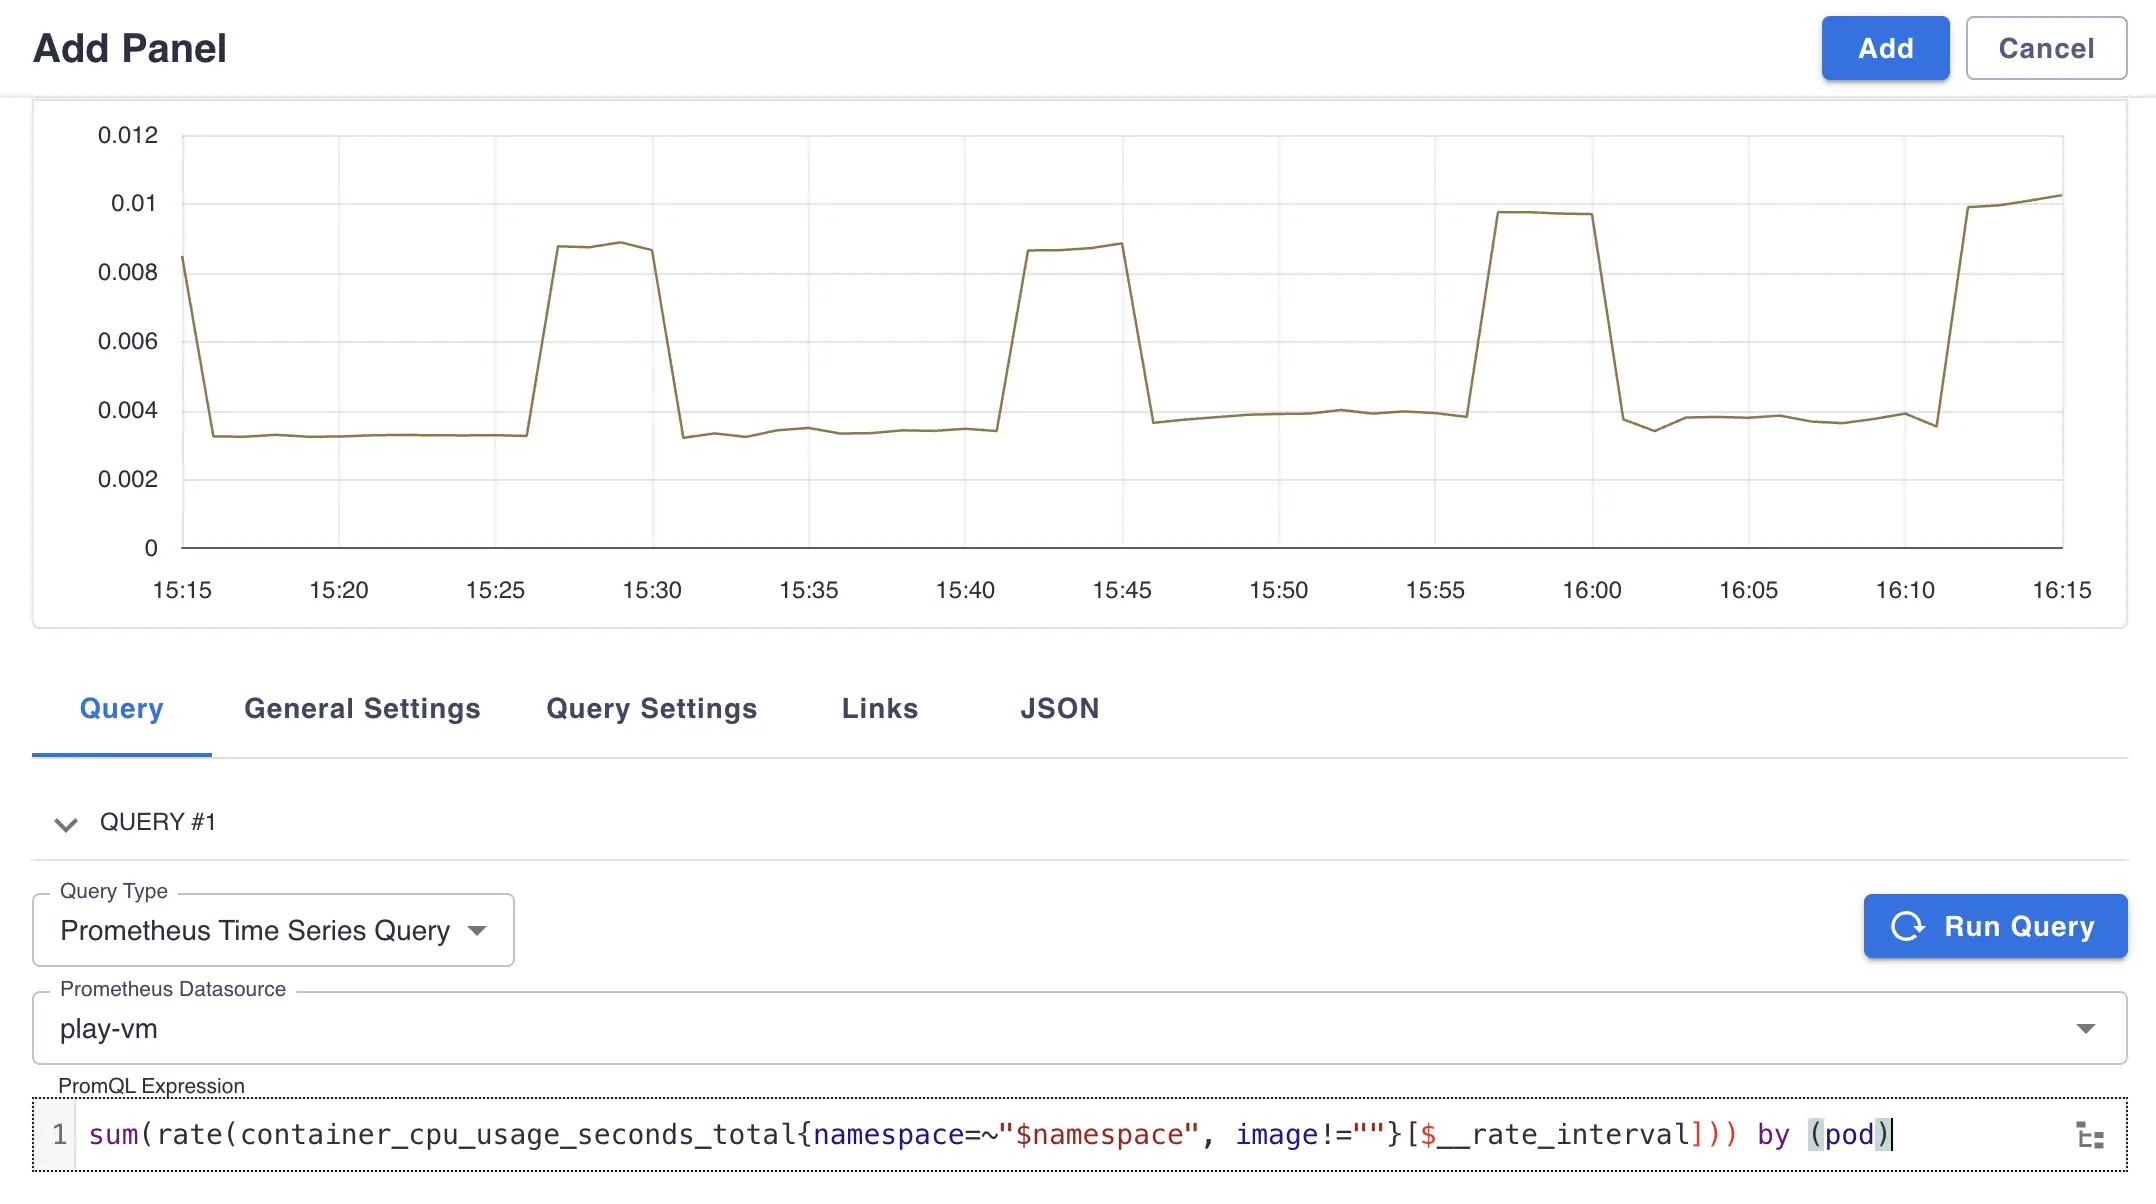
Create panels #
Time Series Panel #
- Go to project dashboard page
http://<perses-url>/projects/<project-name>/dashboards/<dashboard-name>, clickEditand thenPanelbuttons. - Fill
Namefield with desired panel name. - Select
Time Series ChartinTypedropdown. - Select
Prometheus Time Series QueryinQuery Typedropdown. - Select the Prometheus datasource you configured above from the
Prometheus Datasourcedropdown. - Type a valid
MetricsQL expression
in
PromQL Expressionfield. It may reference a variable defined in variables plugin section using${var-name}expression or with specific formats like${var:pipe}for regex filters or${var:csv}for comma-separated values. - Click
Addto save a panel.