VictoriaMetrics Enterprise supports logging statistics Available from v1.116.0 for read queries made through the /api/v1/query and /api/v1/query_range APIs.
Query statistics logging is enabled by default
Available from v1.129.0
with a threshold of 5s.
To disable query statistics logging, add the -search.logSlowQueryStats=0 command line flag to
vmselect
or
Single-node VictoriaMetrics
.
Here’s how <duration> works:
-search.logSlowQueryStats=5slogs statistics for queries that take longer than5s;-search.logSlowQueryStats=1uslogs statistics for all queries;-search.logSlowQueryStats=0turns off query stats logging.
Example of a query statistics log:
2025-03-25T11:23:29.520Z info VictoriaMetrics/app/vmselect/promql/query_stats.go:60 vm_slow_query_stats type=instant query="vm_promscrape_config_last_reload_successful != 1\nor\nvmagent_relabel_config_last_reload_successful != 1\n" query_hash=1585303298 start_ms=1742901750000 end_ms=1742901750000 step_ms=300000 range_ms=0 tenant="0" execution_duration_ms=0 series_fetched=2 samples_fetched=163 bytes=975 memory_estimated_bytes=2032
Log fields #
Each log entry contains the following fields:
type: the type of the query: either instant or range ;query: the executed MetricsQL query;query_hash: a hash of thequery. This makes it easier to filter logs for a specific query;start_ms,end_ms,step_msare query params described in range query ;range_ms: a time range in milliseconds betweenstart_msandend_ms. Ifrange_ms==0it means this query is instant;tenant: a tenant ID. Available only in the cluster version;execution_duration_ms: time it took in milliseconds to execute the query (not including time spent sending results over the network);series_fetched: number of unique time series fetched. This may be higher than the number of series returned if there are filters likecpu_usage > 0;samples_fetched: number of data samples fetched;bytes: number of bytes transferred from storage to process the query;memory_estimated_bytes: estimated memory needed to run the query. See-search.maxMemoryPerQuerycmd-line flag.headers.*: header key-value pairs associated with request Available from v1.121.0 . Only headers listed in-search.logSlowQueryStatsHeadersare logged.
Analysis #
It is recommended to collect query statistics logs into VictoriaLogs for performance analysis. Other logging databases can also be used.
Every log entry starts with vm_slow_query_stats to simplify the filtering. The fields are formatted in logfmt
to simplify the parsing.
Once logs are in VictoriaLogs, run the following query to find the top 5 slowest queries:
      vm_slow_query_stats | extract 'vm_slow_query_stats <query_stats>' | unpack_logfmt from query_stats
| stats by(query) max(execution_duration_ms) execution_duration_max
| sort by(execution_duration_max) desc | limit 5
Here how query works:
- start with
vm_slow_query_statsto filter only statistics logs; - use
extractandunpack_logfmtto parse the log message into fields; - then calculate statistics, like the maximum execution time.
Other useful stats you can calculate:
| stats by(query) max(execution_duration_ms) execution_duration_max
or
| stats by(query,query_hash) sum(series_fetched) series_fetched_sum
With VictoriaLogs Grafana datasource you can build a dashboard to view and filter query stats easily:
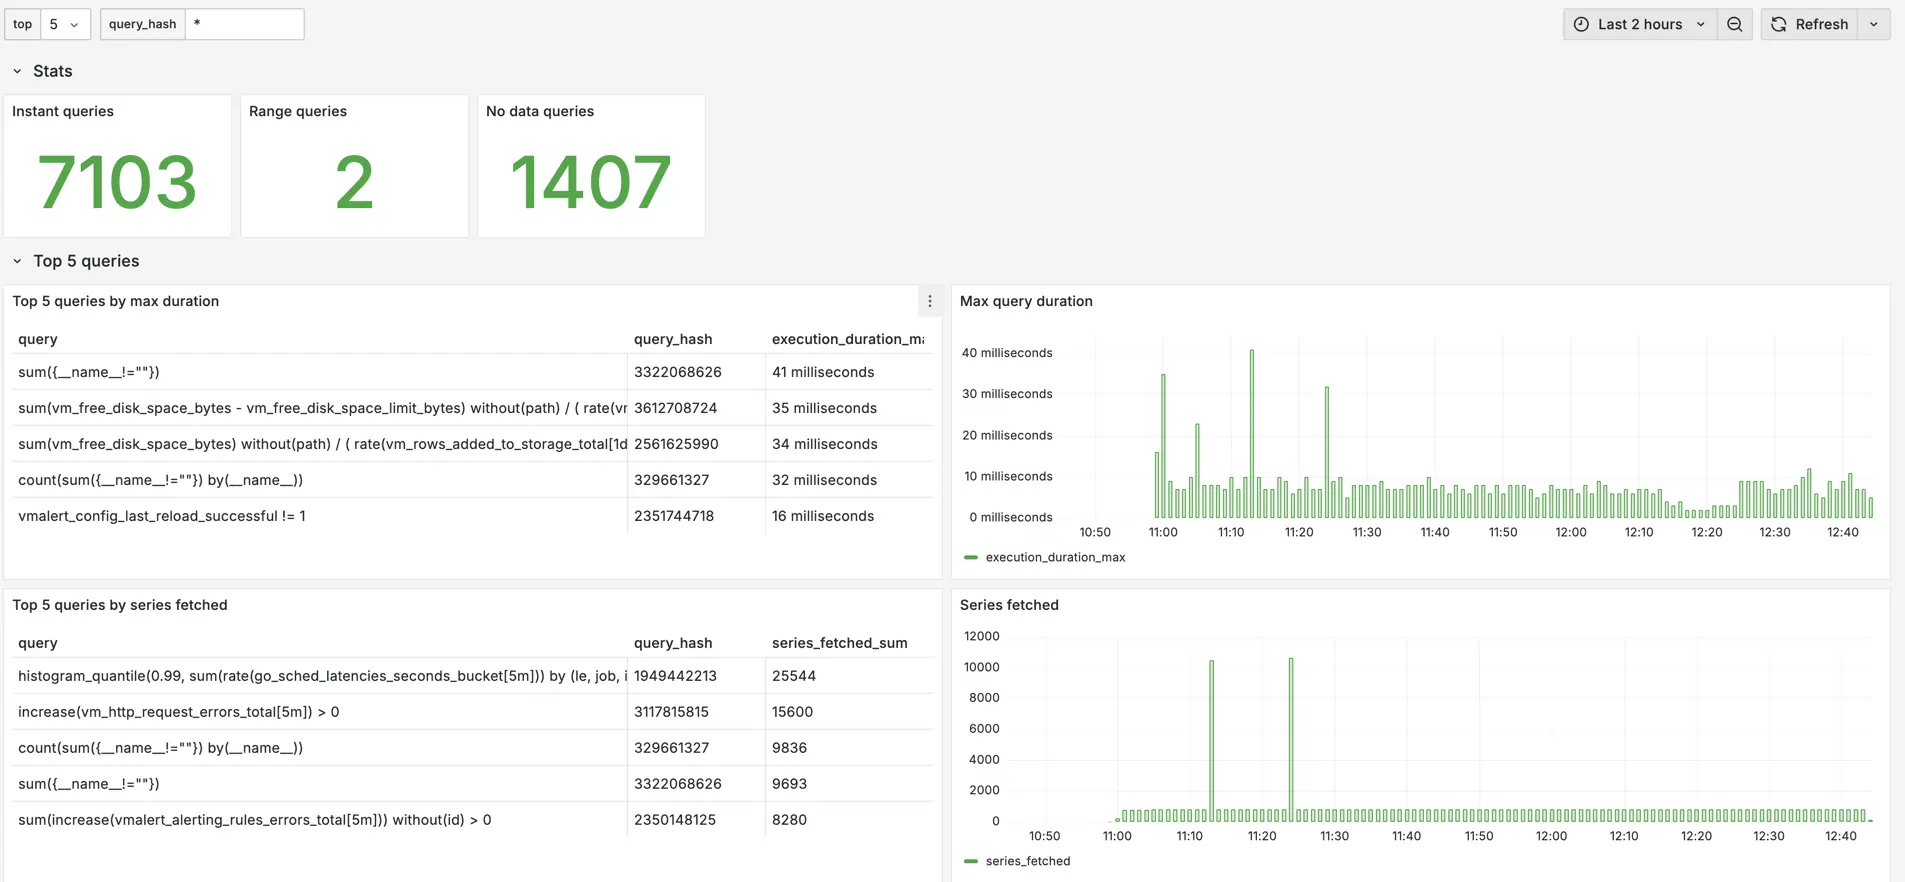
The example of Grafana datasource for VictoriaMetrics cluster is available at the query statistics dashboard .