Stream aggregation can be configured via the following command-line flags:
-streamAggr.configat single-node VictoriaMetrics and at vmagent .-remoteWrite.streamAggr.configat vmagent only. This flag can be specified individually per each-remoteWrite.url, so the aggregation happens independently per each remote storage destination. This allows writing different aggregates to different remote storage systems.
These flags must point to a file containing
stream aggregation config
.
The file may contain %{ENV_VAR} placeholders which are substituted by the corresponding ENV_VAR environment variable values.
By default, the following data is written to the storage when stream aggregation is enabled:
- the aggregated samples;
- the raw input samples, which didn’t match any
matchoption in the provided config .
This behaviour can be changed via the following command-line flags:
-streamAggr.keepInputat single-node VictoriaMetrics and vmagent . At vmagent-remoteWrite.streamAggr.keepInputflag can be specified individually per each-remoteWrite.url. If either of these flags is set, input samples that match any rule in the corresponding streamAggr configuration are preserved and written to storage.-streamAggr.dropInputat single-node VictoriaMetrics and vmagent . At vmagent-remoteWrite.streamAggr.dropInputflag can be specified individually per each-remoteWrite.url. If either of these flags is set, input samples that do not match any rule in the corresponding streamAggr configuration are dropped.
Stream aggregation config #
Below is the format for stream aggregation config file, which may be referred via -streamAggr.config command-line flag at
single-node VictoriaMetrics
and
vmagent
.
At
vmagent
-remoteWrite.streamAggr.config command-line flag can be
specified individually per each -remoteWrite.url:
  # name is an optional name of the given streaming aggregation config.
  #
  # If it is set, then it is used as `name` label in the exposed metrics
  # for the given aggregation config at /metrics page.
  # See https://docs.victoriametrics.com/victoriametrics/vmagent/#monitoring and https://docs.victoriametrics.com/victoriametrics/single-server-victoriametrics/#monitoring
- name: 'foobar'

  # match is an optional filter for incoming samples to aggregate.
  # It can contain arbitrary Prometheus series selector
  # according to https://docs.victoriametrics.com/victoriametrics/keyconcepts/#filtering .
  # If match isn't set, then all the incoming samples are aggregated.
  #
  # match also can contain a list of series selectors. Then the incoming samples are aggregated
  # if they match at least a single series selector.
  #
  match: 'http_request_duration_seconds_bucket{env=~"prod|staging"}'

  # interval is the interval for the aggregation.
  # The aggregated stats is sent to remote storage once per interval.
  #
  interval: 1m

  # dedup_interval is an optional interval for de-duplication of input samples before the aggregation.
  # Samples are de-duplicated on a per-series basis. See https://docs.victoriametrics.com/victoriametrics/keyconcepts/#time-series
  # and https://docs.victoriametrics.com/victoriametrics/single-server-victoriametrics/#deduplication
  # The deduplication is performed after input_relabel_configs relabeling is applied.
  # By default, the deduplication is disabled unless -remoteWrite.streamAggr.dedupInterval or -streamAggr.dedupInterval
  # command-line flags are set.
  #
  # dedup_interval: 30s

  # enable_windows is a boolean option to enable fixed aggregation windows.
  # See https://docs.victoriametrics.com/victoriametrics/stream-aggregation/#aggregation-windows
  #
  # enable_windows: true

  # staleness_interval is an optional interval for resetting the per-series state if no new samples
  # are received during this interval for the following outputs:
  # - histogram_bucket
  # - increase
  # - increase_prometheus
  # - rate_avg
  # - rate_sum
  # - total
  # - total_prometheus
  # See https://docs.victoriametrics.com/victoriametrics/stream-aggregation/#staleness for more details.
  #
  # staleness_interval: 2m

  # ignore_first_sample_interval specifies the interval after which the agent begins sending samples.
  # By default, it is set to the staleness interval, and it helps reduce the initial sample load after an agent restart.
  # This parameter is relevant only for the following outputs:
  # - total
  # - total_prometheus
  # - increase
  # - increase_prometheus
  # - histogram_bucket
  #
  # ignore_first_sample_interval: 2m

  # no_align_flush_to_interval disables aligning of flush times for the aggregated data to multiples of interval.
  # By default, flush times for the aggregated data is aligned to multiples of interval.
  # For example:
  # - if `interval: 1m` is set, then flushes happen at the end of every minute,
  # - if `interval: 1h` is set, then flushes happen at the end of every hour
  #
  # no_align_flush_to_interval: false

  # flush_on_shutdown instructs to flush aggregated data to the storage on the first and the last intervals
  # during vmagent starts, restarts or configuration reloads.
  # Incomplete aggregated data isn't flushed to the storage by default, since it is usually confusing.
  #
  # flush_on_shutdown: false

  # without is an optional list of labels, which must be removed from the output aggregation.
  # See https://docs.victoriametrics.com/victoriametrics/stream-aggregation/#aggregating-by-labels
  #
  # without: [instance]

  # by is an optional list of labels, which must be preserved in the output aggregation.
  # See https://docs.victoriametrics.com/victoriametrics/stream-aggregation/#aggregating-by-labels
  #
  # by: [job, vmrange]

  # outputs is the list of unique aggregations to perform on the input data.
  # See https://docs.victoriametrics.com/victoriametrics/stream-aggregation/#aggregation-outputs
  #
  outputs: [total]

  # keep_metric_names instructs keeping the original metric names for the aggregated samples.
  # This option can't be enabled together with `-streamAggr.keepInput` or `-remoteWrite.streamAggr.keepInput`.
  # This option can be set only if outputs list contains a single output.
  # By default, a special suffix is added to original metric names in the aggregated samples.
  # See https://docs.victoriametrics.com/victoriametrics/stream-aggregation/#output-metric-names
  #
  # keep_metric_names: false

  # ignore_old_samples instructs ignoring input samples with old timestamps outside the current aggregation interval.
  # See https://docs.victoriametrics.com/victoriametrics/stream-aggregation/#ignoring-old-samples
  # See also -remoteWrite.streamAggr.ignoreOldSamples and -streamAggr.ignoreOldSamples command-line flag.
  #
  # ignore_old_samples: false

  # ignore_first_intervals instructs ignoring the first N aggregation intervals after process start.
  # See https://docs.victoriametrics.com/victoriametrics/stream-aggregation/#ignore-aggregation-intervals-on-start
  # See also -remoteWrite.streamAggr.ignoreFirstIntervals and -streamAggr.ignoreFirstIntervals command-line flags.
  #
  # ignore_first_intervals: N

  # drop_input_labels instructs dropping the given labels from input samples.
  # The labels' dropping is performed before input_relabel_configs are applied.
  # This also means that the labels are dropped before de-duplication ( https://docs.victoriametrics.com/victoriametrics/stream-aggregation/#deduplication )
  # and stream aggregation.
  #
  # drop_input_labels: [replica, availability_zone]

  # input_relabel_configs is an optional relabeling rules,
  # which are applied to the incoming samples after they pass the match filter
  # and before being aggregated.
  # See https://docs.victoriametrics.com/victoriametrics/stream-aggregation/#relabeling
  #
  input_relabel_configs:
  - target_label: vmaggr
    replacement: before

  # output_relabel_configs is an optional relabeling rules,
  # which are applied to the aggregated output metrics.
  #
  output_relabel_configs:
  - target_label: vmaggr
    replacement: after
The file can contain multiple aggregation configs. The aggregation is performed independently per each specified config entry.
Configuration update #
vmagent
and
single-node VictoriaMetrics
support the following approaches for hot reloading stream aggregation configs from -remoteWrite.streamAggr.config and -streamAggr.config:
By sending
SIGHUPsignal tovmagentorvictoria-metricsprocess:kill -SIGHUP `pidof vmagent`By sending HTTP request to
/-/reloadendpoint (e.g.http://vmagent:8429/-/reloadorhttp://victoria-metrics:8428/-/reload).
Aggregation outputs #
The aggregations are calculated during the interval specified in the
config
and then sent to the storage once per interval. The aggregated samples are named according to
output metric naming
.
If by and without lists are specified in the
config
,
then the
aggregation by labels
is performed additionally to aggregation by interval.
Below are aggregation functions that can be put in the outputs list at
stream aggregation config
:
- avg
- count_samples
- count_series
- histogram_bucket
- increase
- increase_prometheus
- last
- max
- min
- rate_avg
- rate_sum
- stddev
- stdvar
- sum_samples
- total
- total_prometheus
- unique_samples
- quantiles
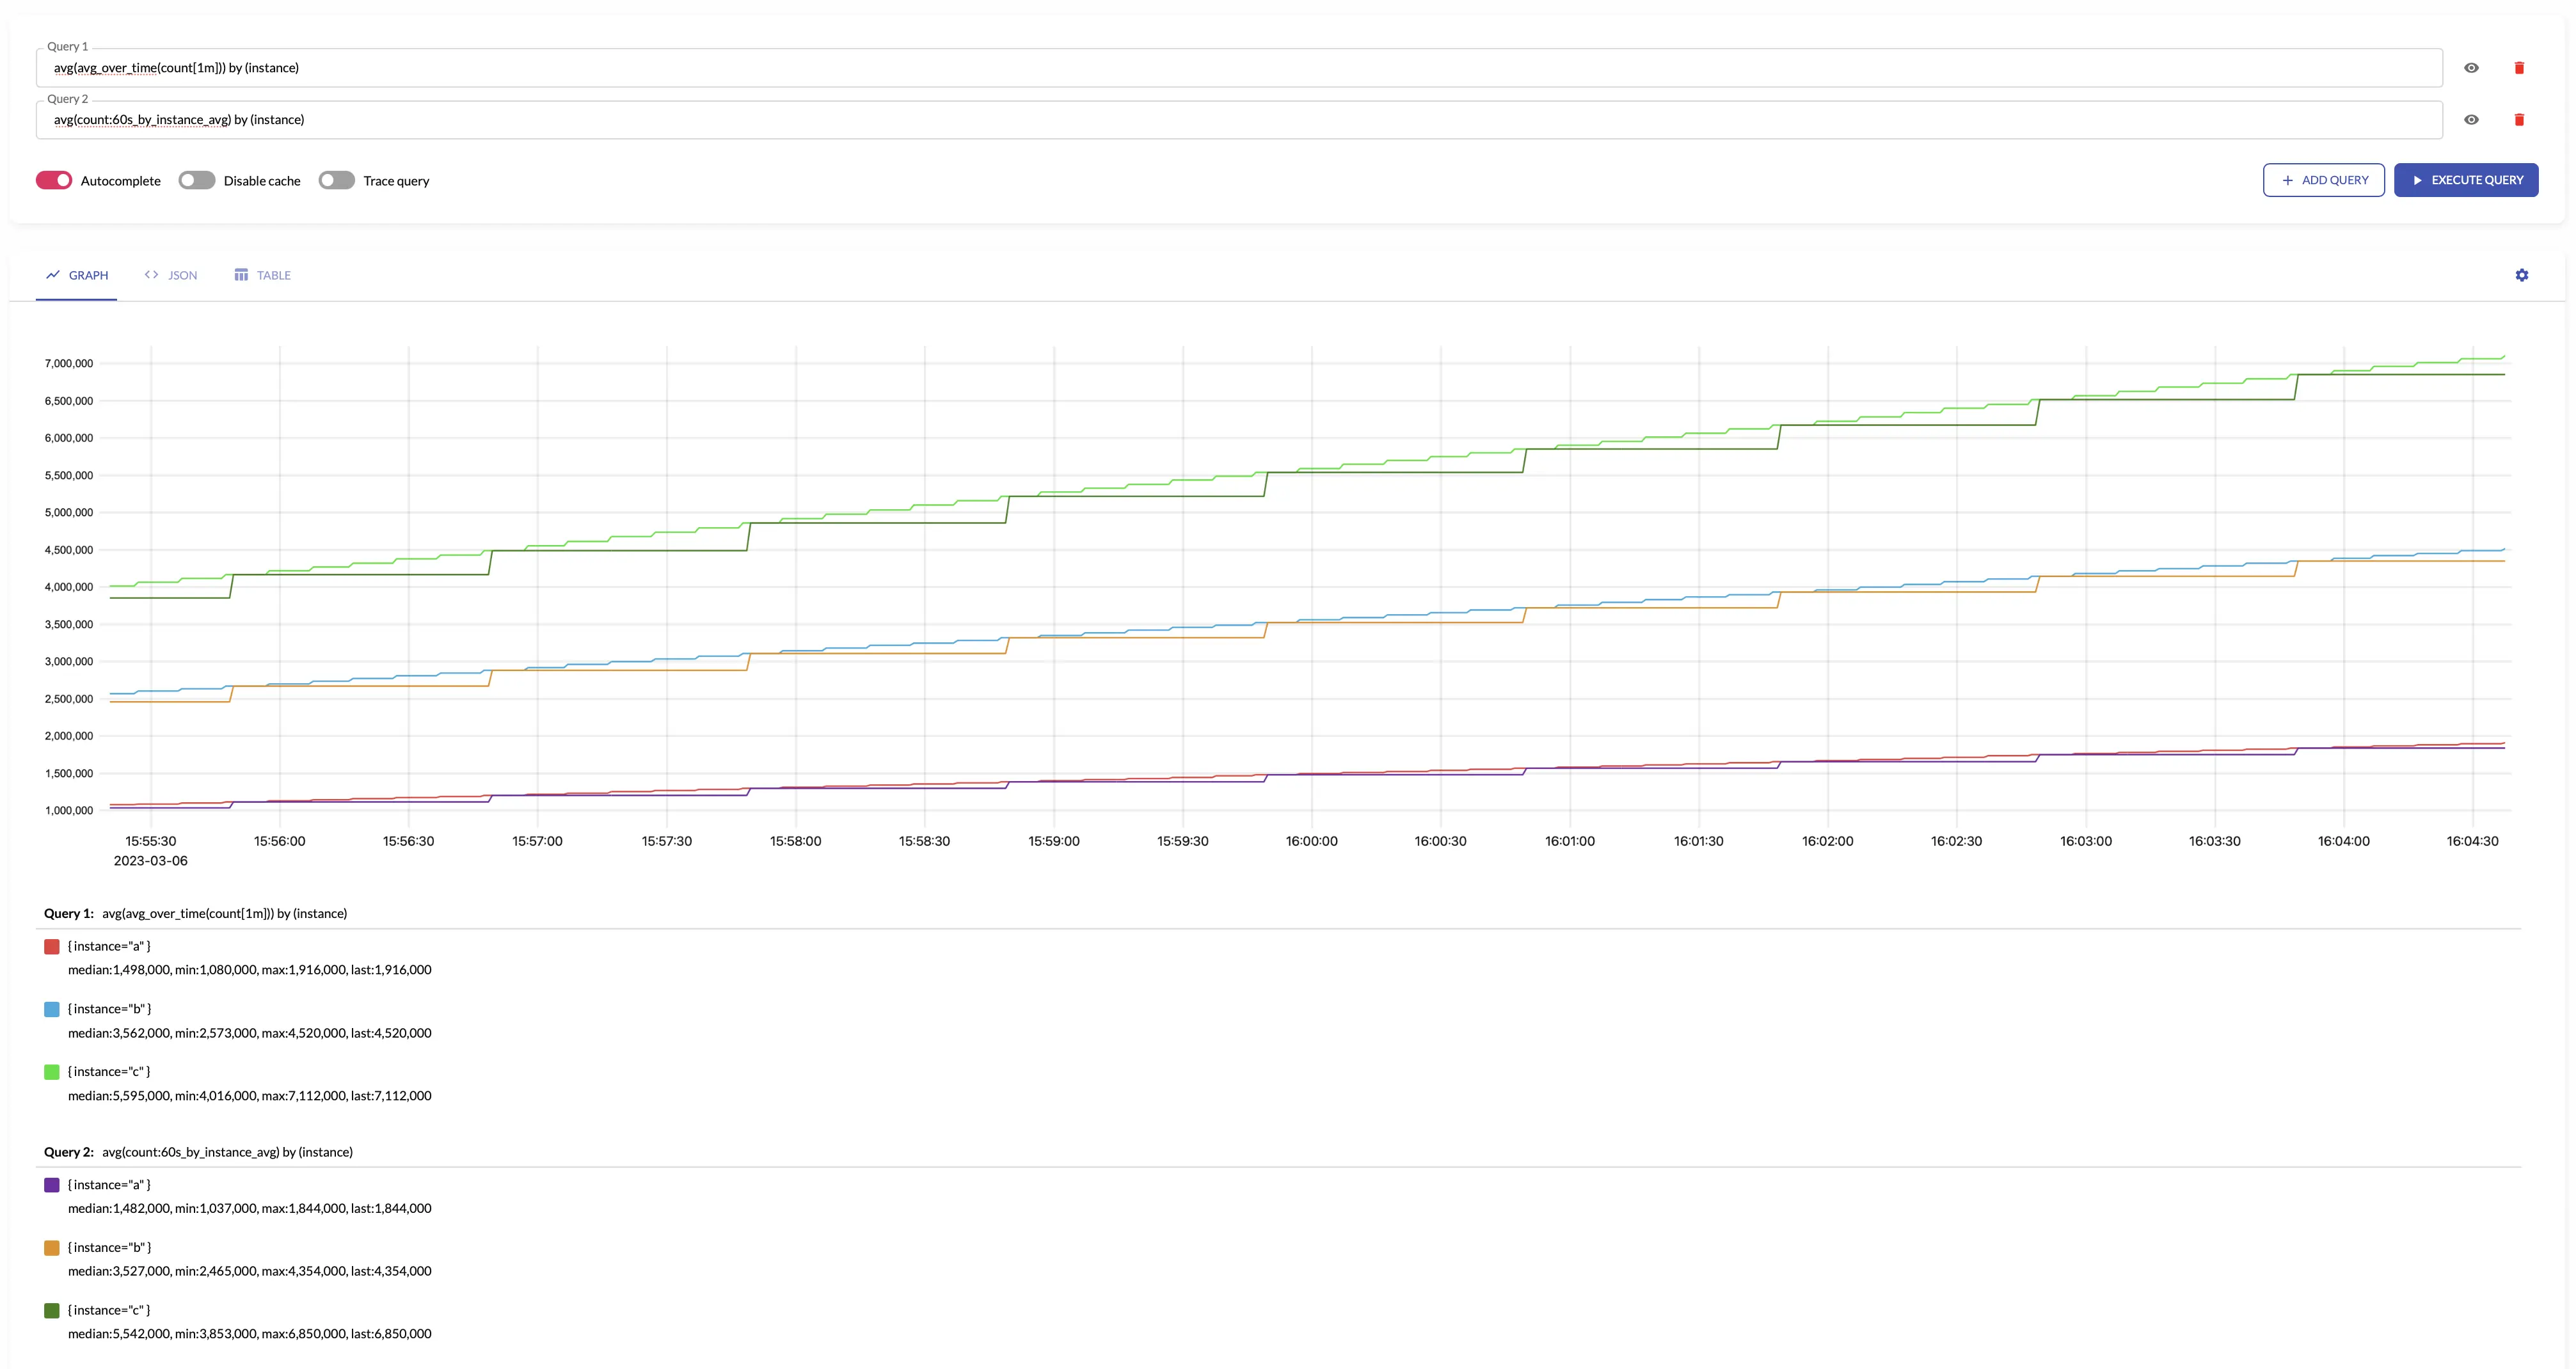
avg #
avg returns the average over input
sample values
.
avg makes sense only for aggregating
gauges
.
The results of avg is equal to the following
MetricsQL
query:
sum(sum_over_time(some_metric[interval])) / sum(count_over_time(some_metric[interval]))
For example, see below time series produced by config with aggregation interval 1m and by: ["instance"] and the regular query:
See also:
count_samples #
count_samples counts the number of input
samples
over the given interval.
The results of count_samples is equal to the following
MetricsQL
query:
sum(count_over_time(some_metric[interval]))
See also:
count_series #
count_series counts the number of unique
time series
over the given interval.
The results of count_series is equal to the following
MetricsQL
query:
count(last_over_time(some_metric[interval]))
See also:
histogram_bucket #
histogram_bucket returns VictoriaMetrics histogram buckets
for the input
sample values
over the given interval.
histogram_bucket makes sense only for aggregating
gauges
.
See how to aggregate regular histograms
here
.
The results of histogram_bucket is equal to the following
MetricsQL
query:
sum(histogram_over_time(some_histogram_bucket[interval])) by (vmrange)
Aggregating irregular and sporadic metrics (received from Lambdas or Cloud Functions ) can be controlled via staleness_interval option.
See also:
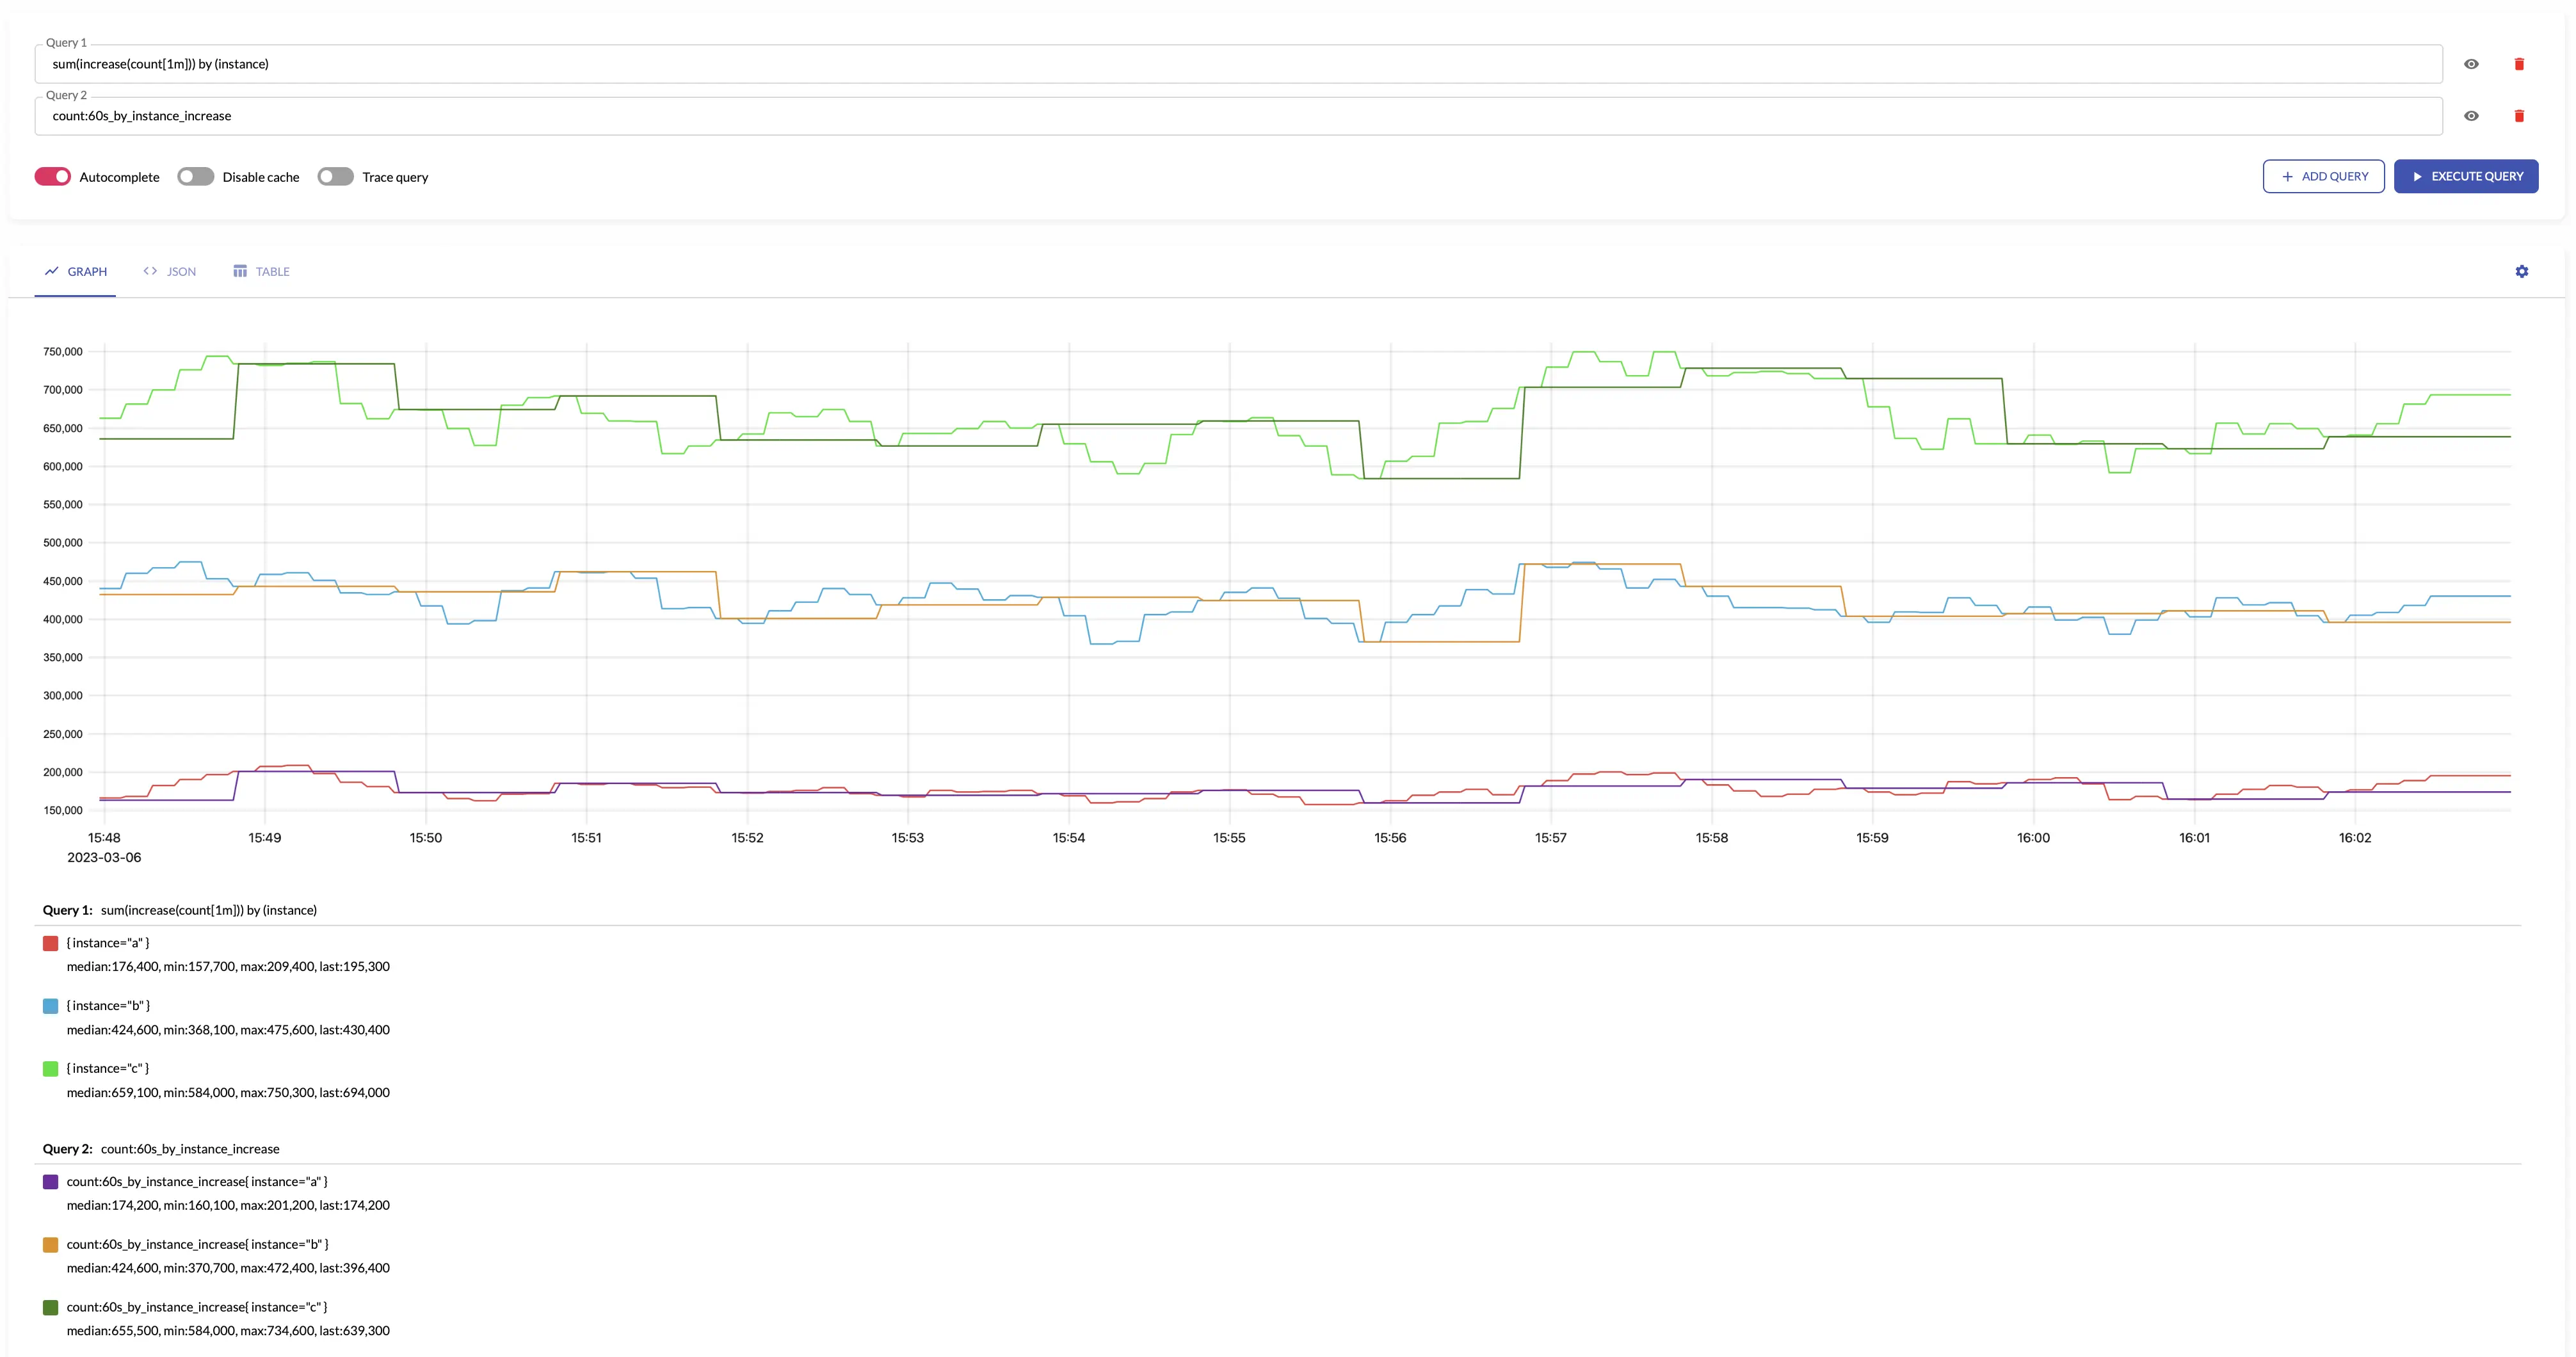
increase #
increase returns the increase of input
time series
over the given ‘interval’.
increase makes sense only for aggregating
counters
.
The results of increase is equal to the following
MetricsQL
query:
sum(increase_pure(some_counter[interval]))
increase assumes that all the counters start from 0. For example, if the first seen sample for new
time series
is 10, then increase assumes that the time series has been increased by 10. If you need ignoring the first sample for new time series,
then take a look at
increase_prometheus
.
For example, see below time series produced by config with aggregation interval 1m and by: ["instance"] and the regular query:
Aggregating irregular and sporadic metrics (received from Lambdas or Cloud Functions ) can be controlled via staleness_interval option.
See also:
increase_prometheus #
increase_prometheus returns the increase of input
time series
over the given interval.
increase_prometheus makes sense only for aggregating
counters
.
The results of increase_prometheus is equal to the following
MetricsQL
query:
sum(increase_prometheus(some_counter[interval]))
increase_prometheus skips the first seen sample value per each
time series
.
If you need taking into account the first sample per time series, then take a look at
increase
.
Aggregating irregular and sporadic metrics (received from Lambdas or Cloud Functions ) can be controlled via staleness_interval option.
See also:
last #
last returns the last input
sample value
over the given interval.
The results of last is roughly equal to the following
MetricsQL
query:
last_over_time(some_metric[interval])
See also:
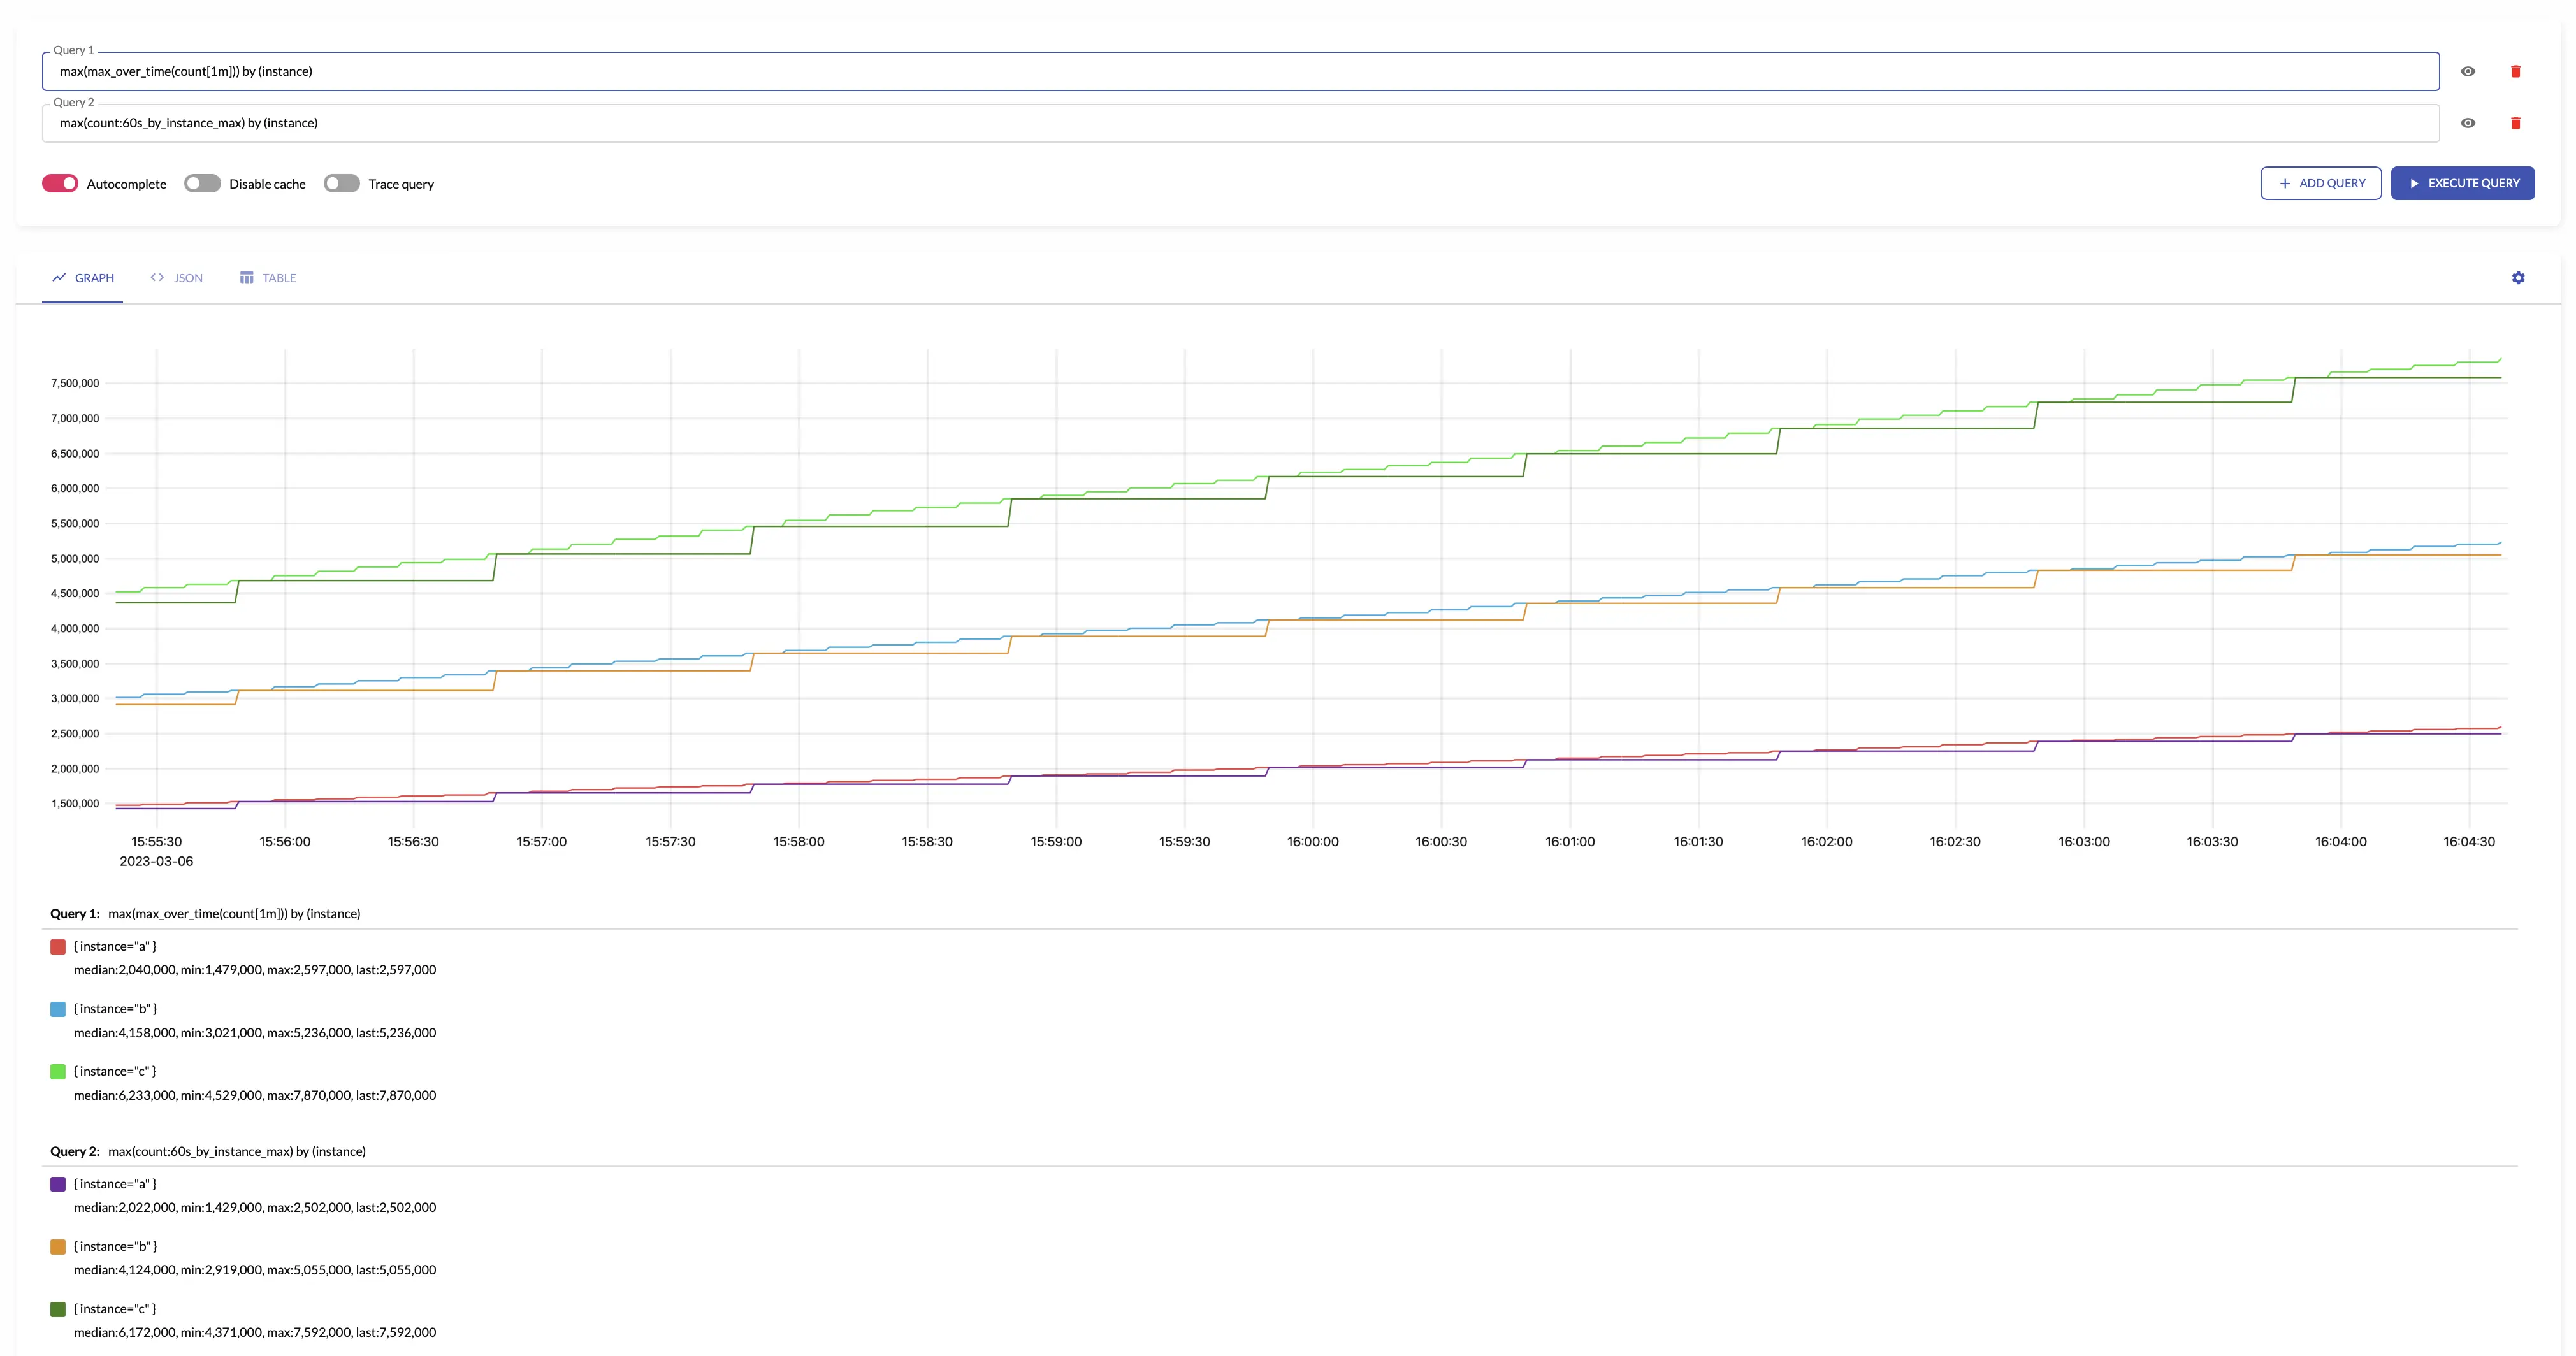
max #
max returns the maximum input
sample value
over the given interval.
The results of max is equal to the following
MetricsQL
query:
max(max_over_time(some_metric[interval]))
For example, see below time series produced by config with aggregation interval 1m and the regular query:
See also:
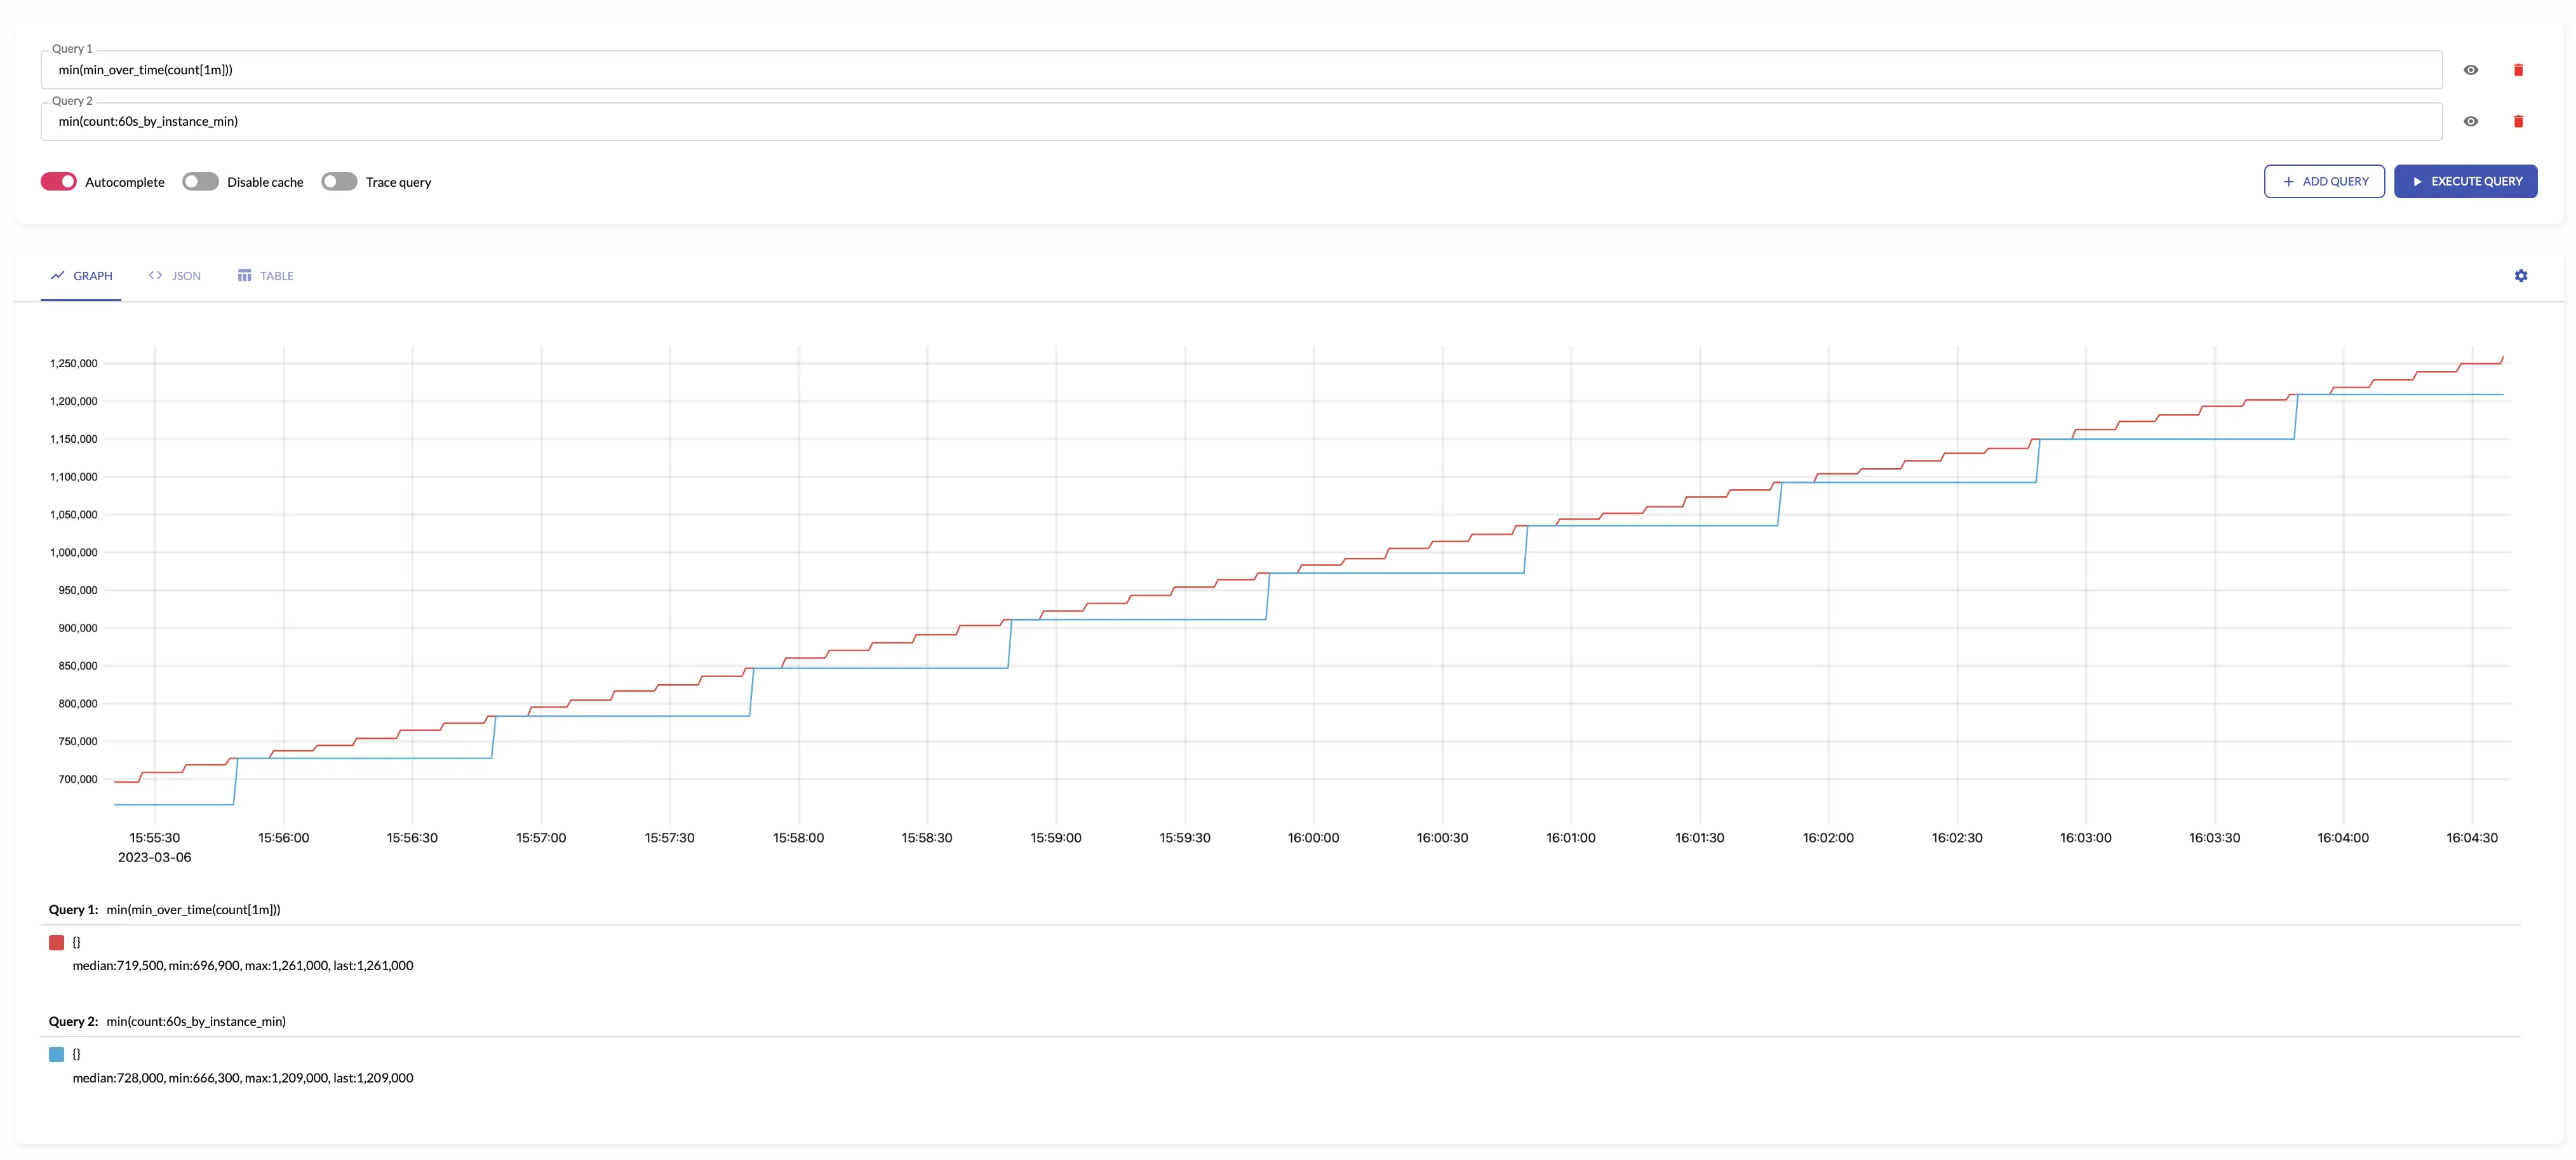
min #
min returns the minimum input
sample value
over the given interval.
The results of min is equal to the following
MetricsQL
query:
min(min_over_time(some_metric[interval]))
For example, see below time series produced by config with aggregation interval 1m and the regular query:
See also:
rate_avg #
rate_avg returns the average of average per-second increase rates across input
time series
over the given interval.
rate_avg makes sense only for aggregating
counters
.
The results of rate_avg are equal to the following
MetricsQL
query:
avg(rate(some_counter[interval]))
See also:
rate_sum #
rate_sum returns the sum of average per-second increase rates across input
time series
over the given interval.
rate_sum makes sense only for aggregating
counters
.
The results of rate_sum are equal to the following
MetricsQL
query:
sum(rate(some_counter[interval]))
See also:
stddev #
stddev returns standard deviation
for the input
sample values
over the given interval.
stddev makes sense only for aggregating
gauges
.
The results of stddev is roughly equal to the following
MetricsQL
query:
histogram_stddev(sum(histogram_over_time(some_metric[interval])) by (vmrange))
See also:
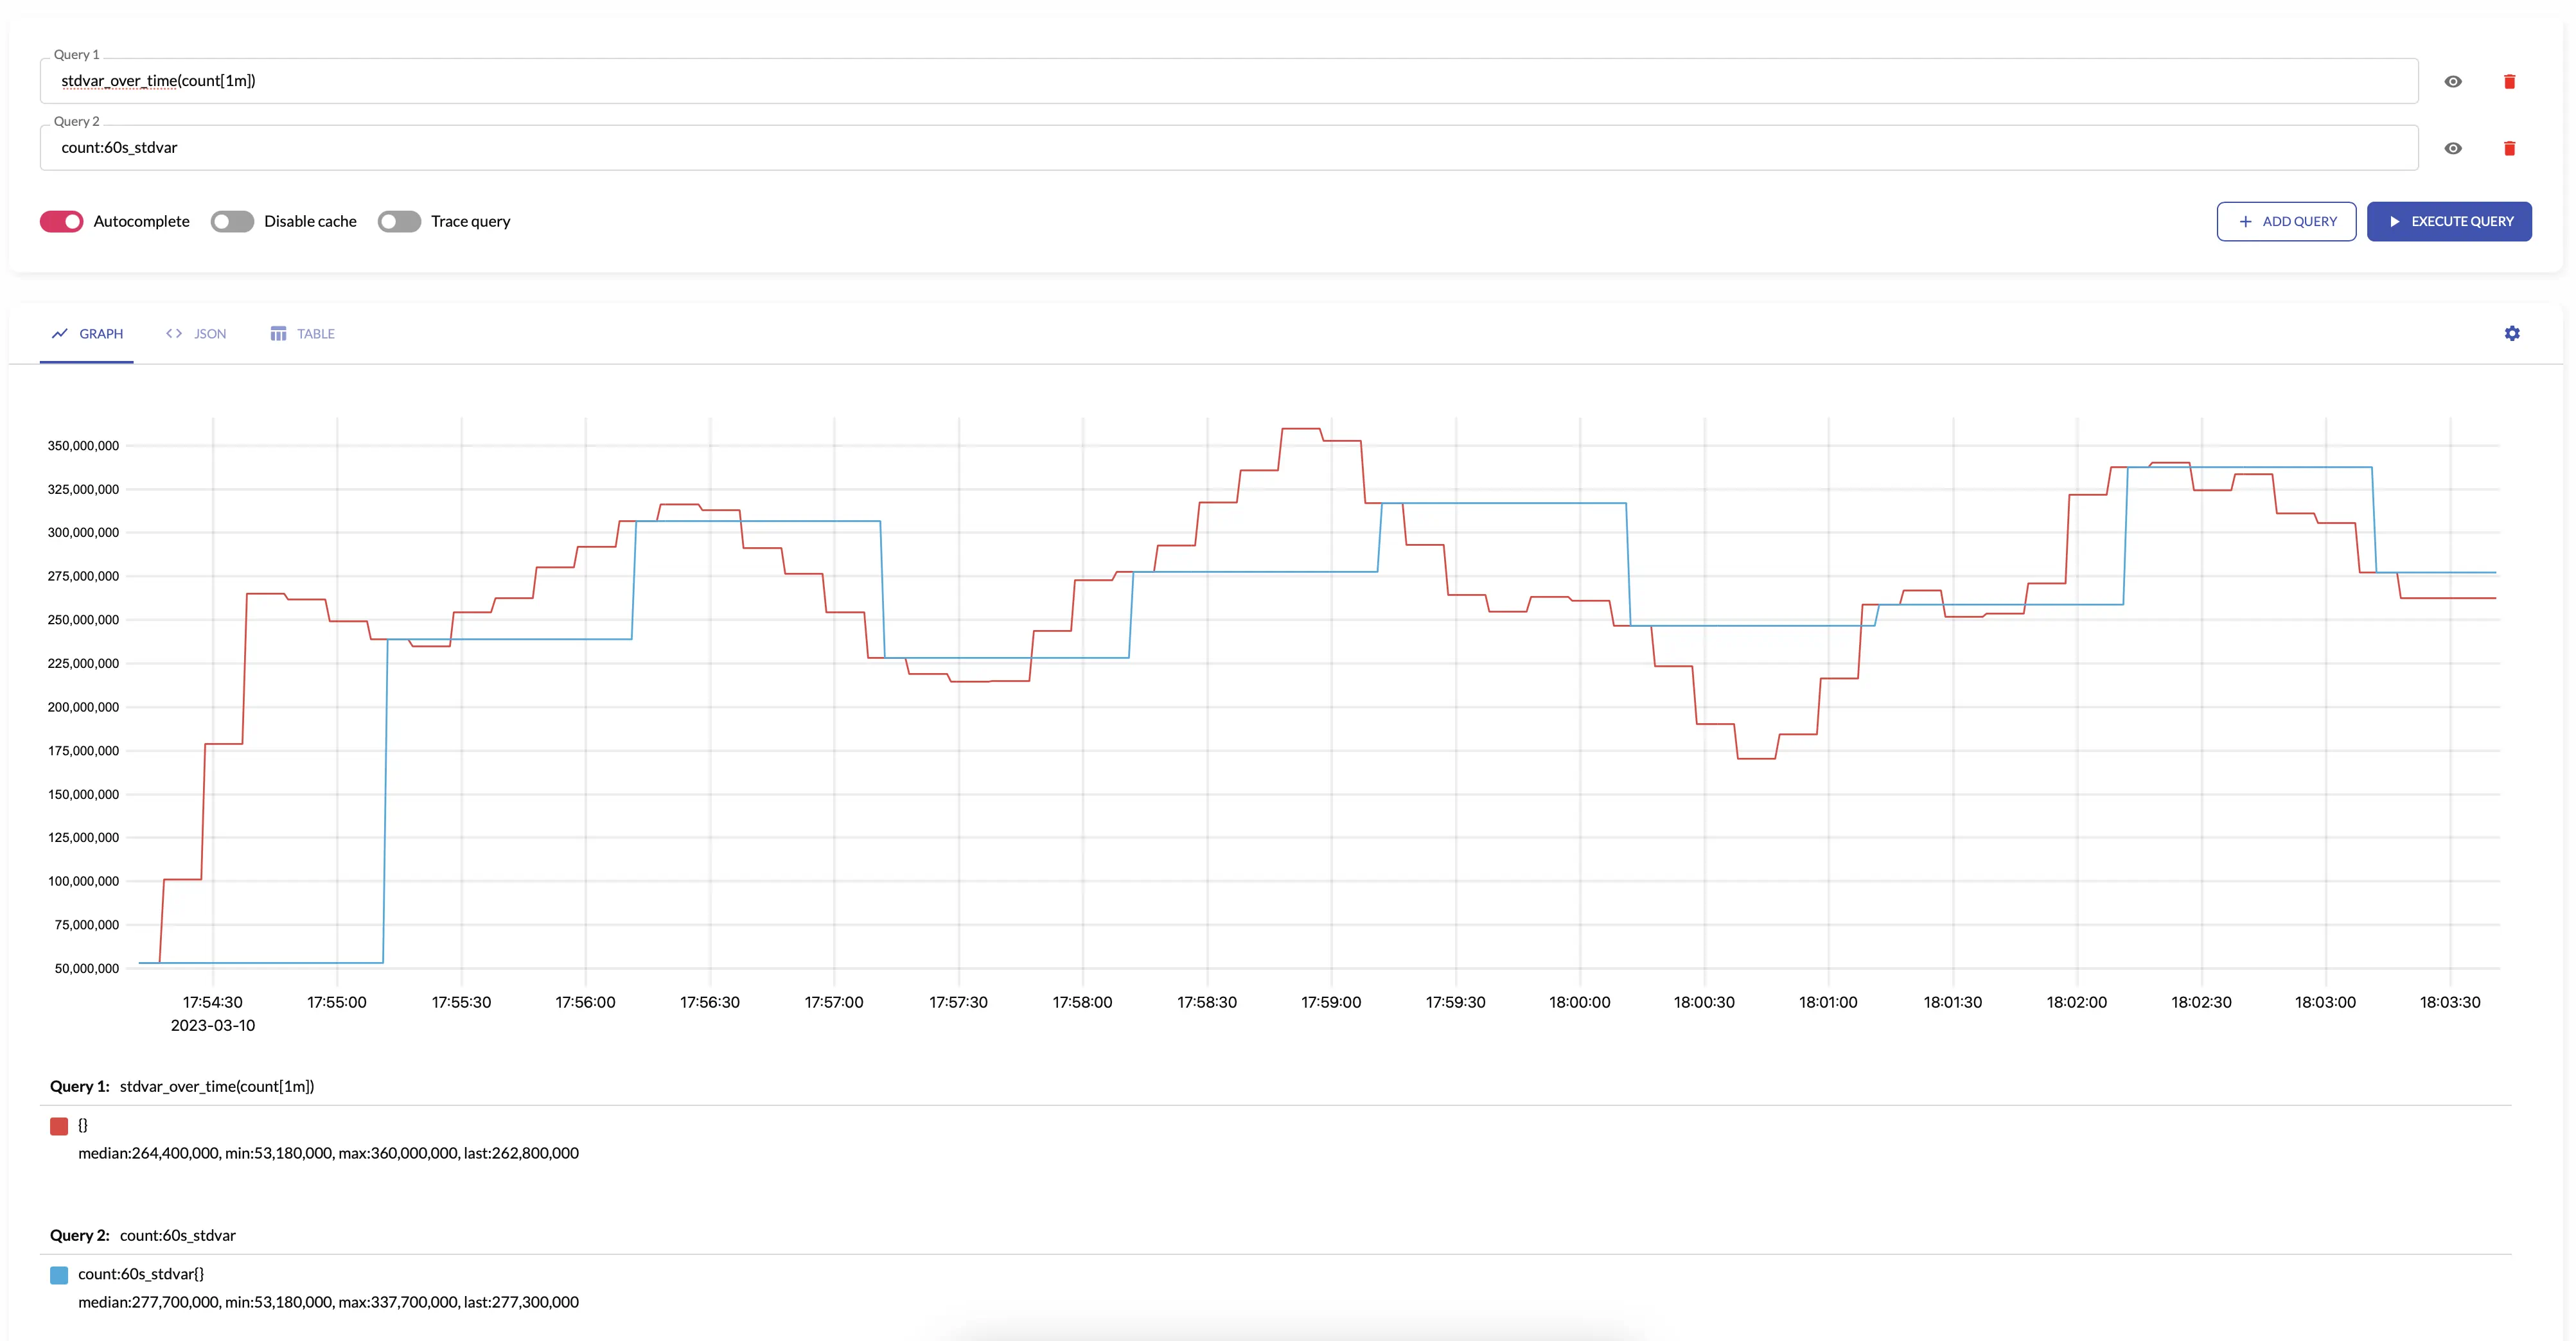
stdvar #
stdvar returns standard variance
for the input
sample values
over the given interval.
stdvar makes sense only for aggregating
gauges
.
The results of stdvar is roughly equal to the following
MetricsQL
query:
histogram_stdvar(sum(histogram_over_time(some_metric[interval])) by (vmrange))
For example, see below time series produced by config with aggregation interval 1m and the regular query:
See also:
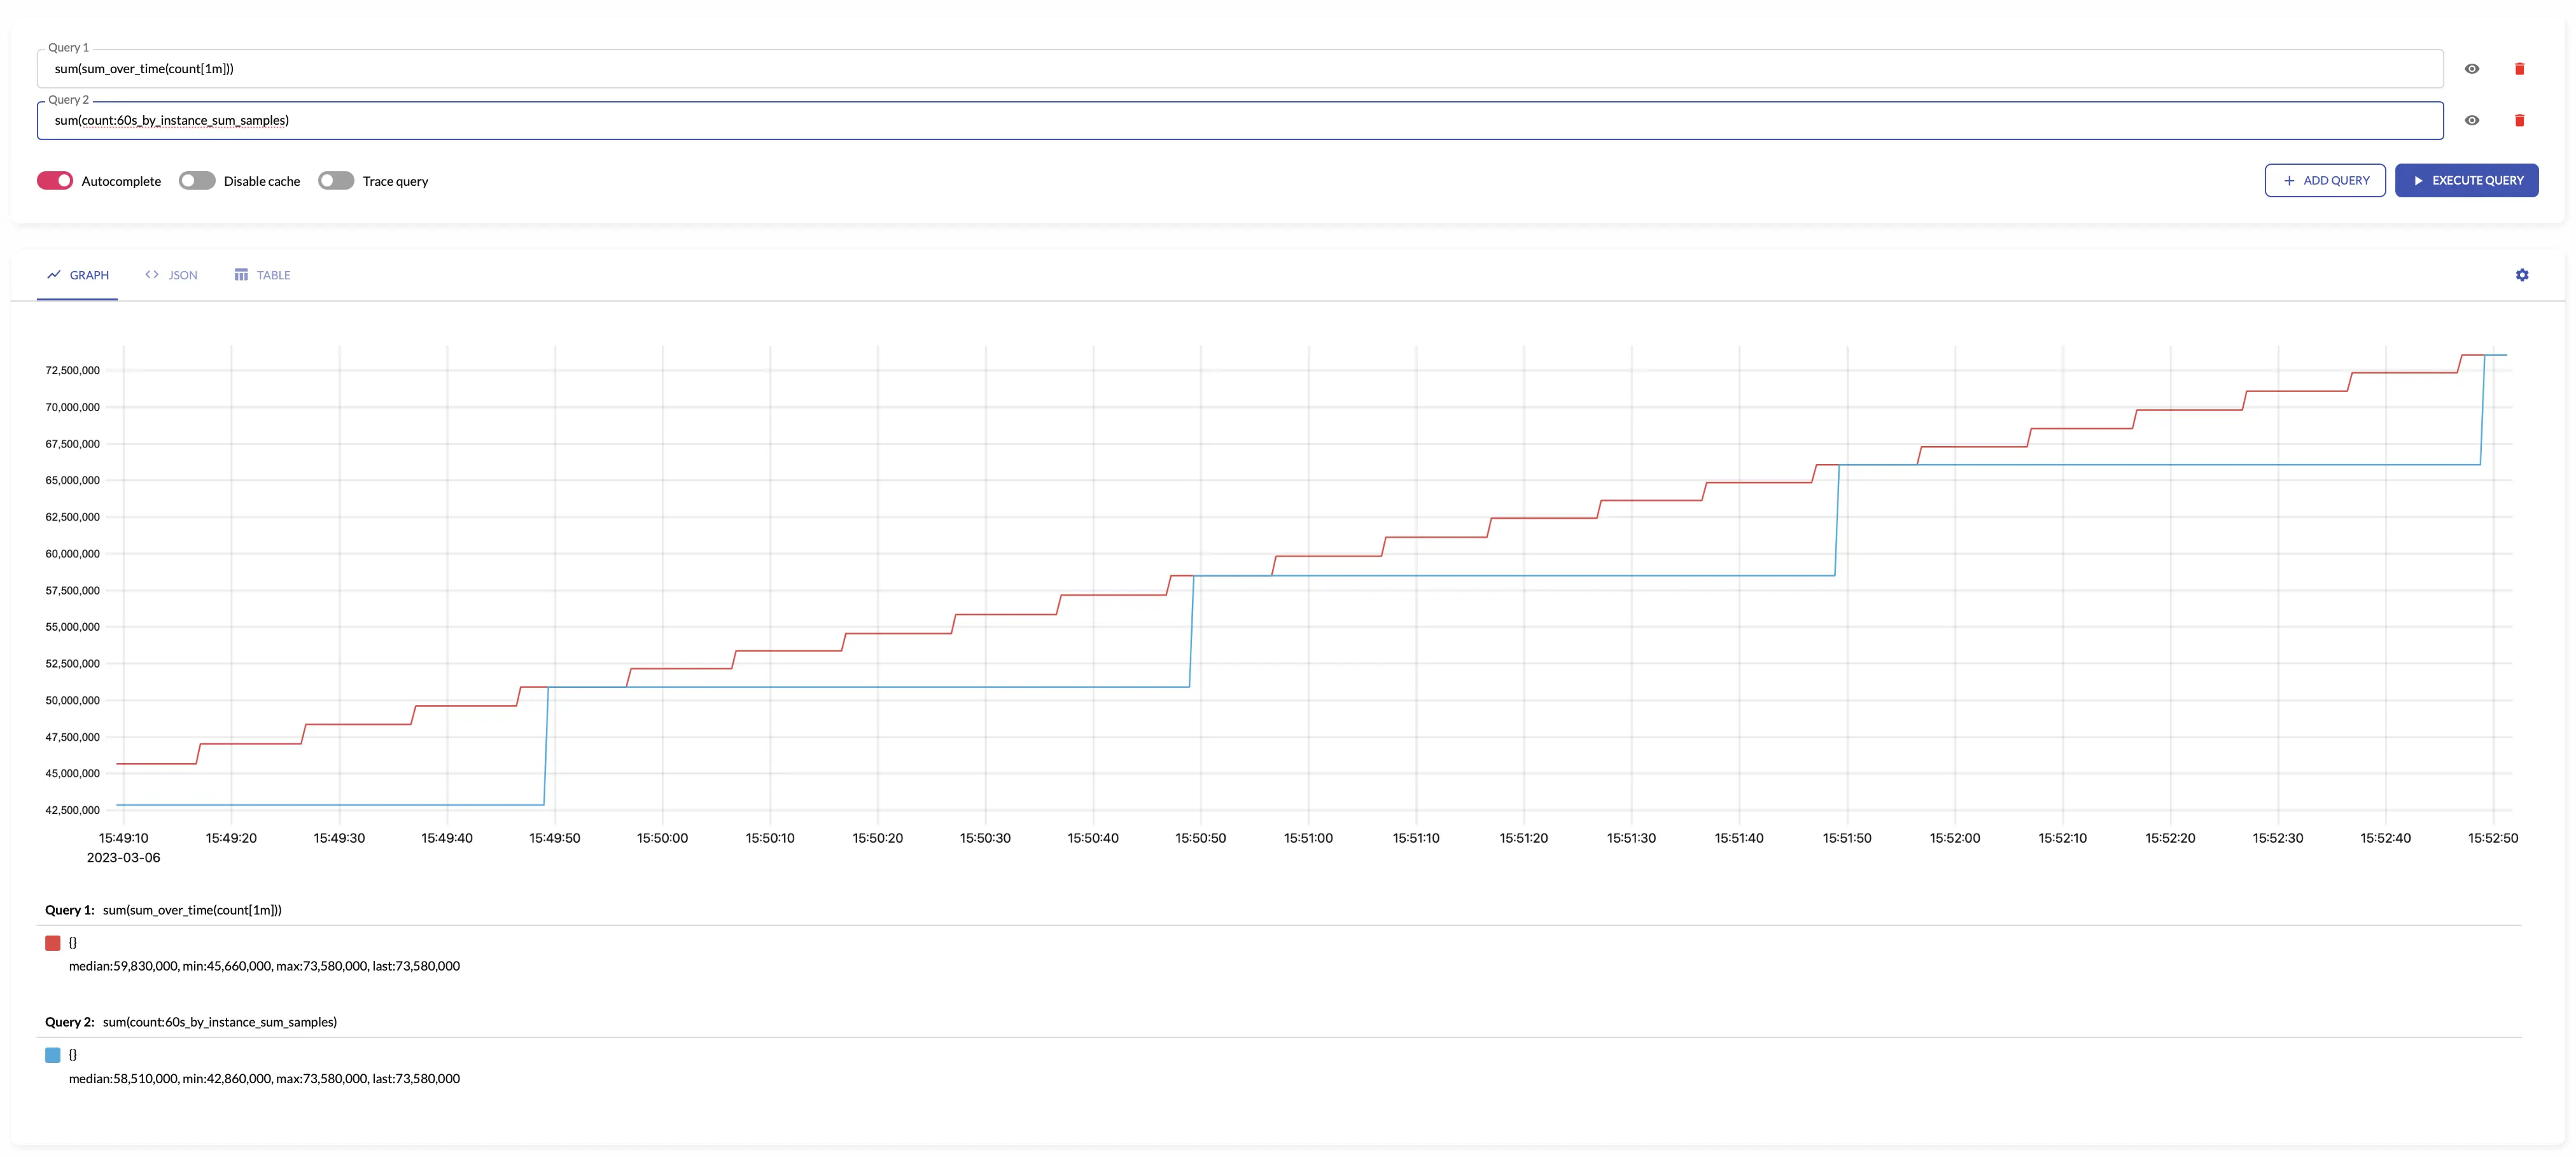
sum_samples #
sum_samples sums input
sample values
over the given interval.
sum_samples makes sense only for aggregating
gauges
.
The results of sum_samples is equal to the following
MetricsQL
query:
sum(sum_over_time(some_metric[interval]))
For example, see below time series produced by config with aggregation interval 1m and the regular query:
See also:
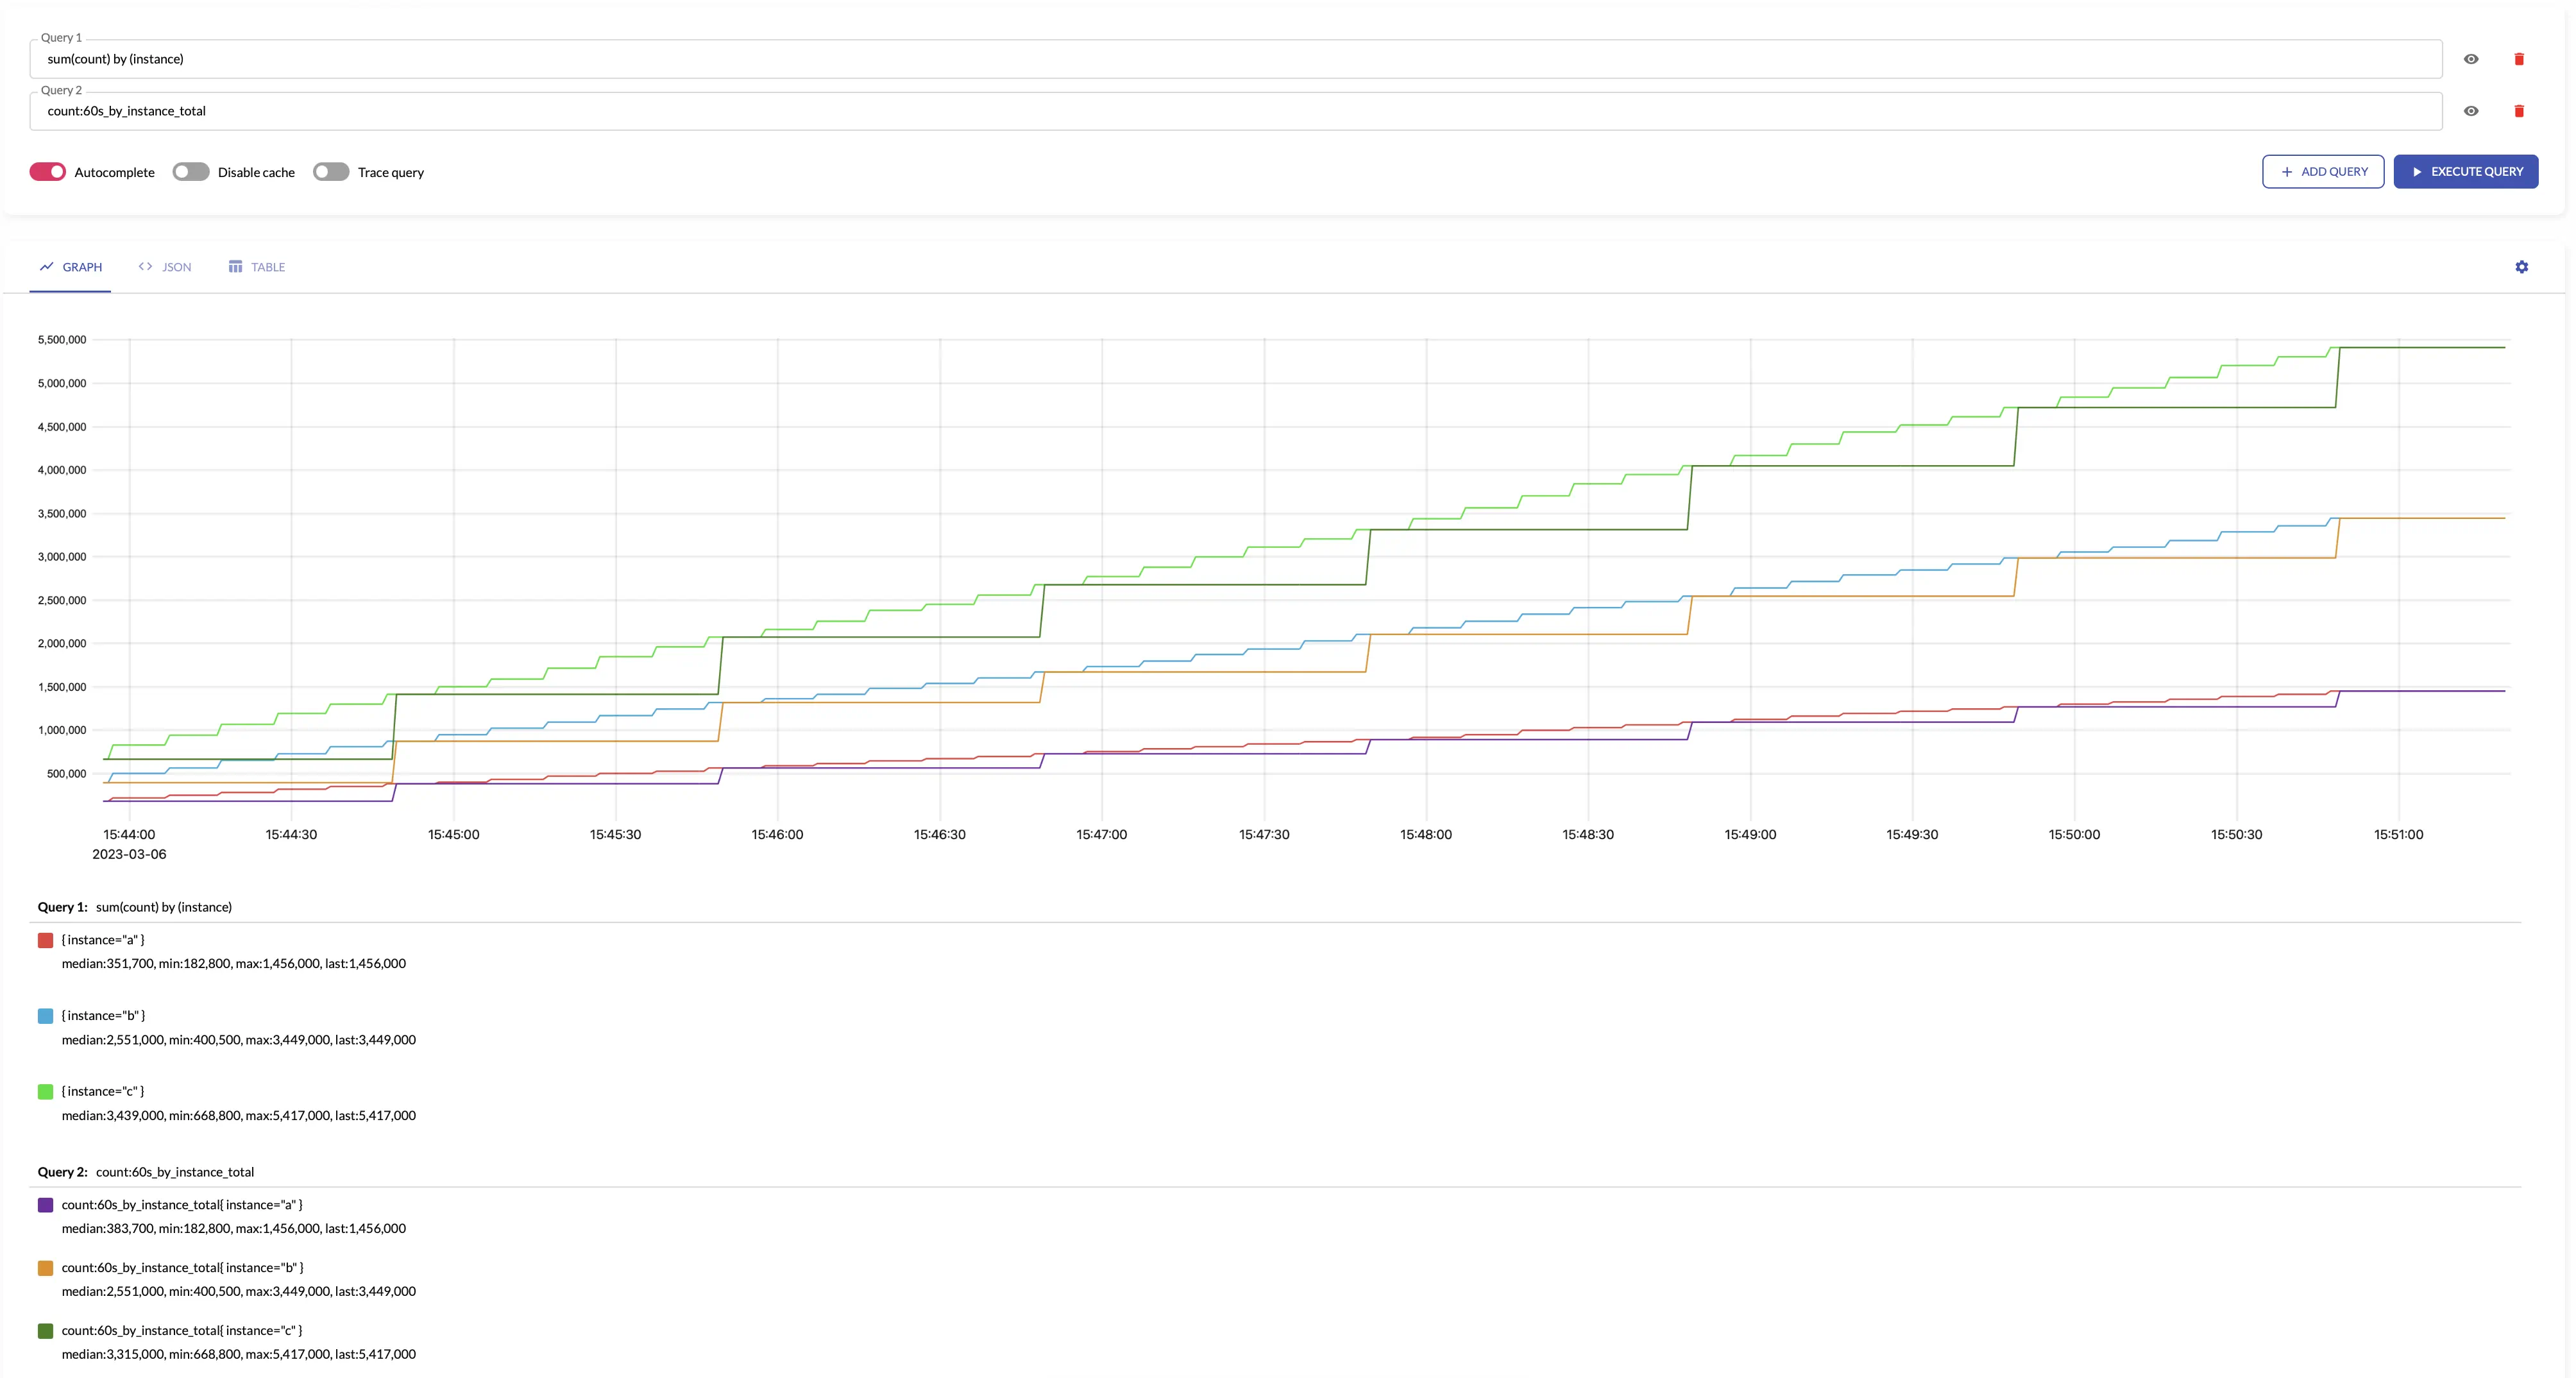
total #
total generates output
counter
by summing the input counters over the given interval.
total makes sense only for aggregating
counters
.
The results of total is roughly equal to the following
MetricsQL
query:
sum(running_sum(increase_pure(some_counter)))
total assumes that all the counters start from 0. For example, if the first seen sample for new
time series
is 10, then total assumes that the time series has been increased by 10. If you need ignoring the first sample for new time series,
then take a look at
total_prometheus
.
For example, see below time series produced by config with aggregation interval 1m and by: ["instance"] and the regular query:
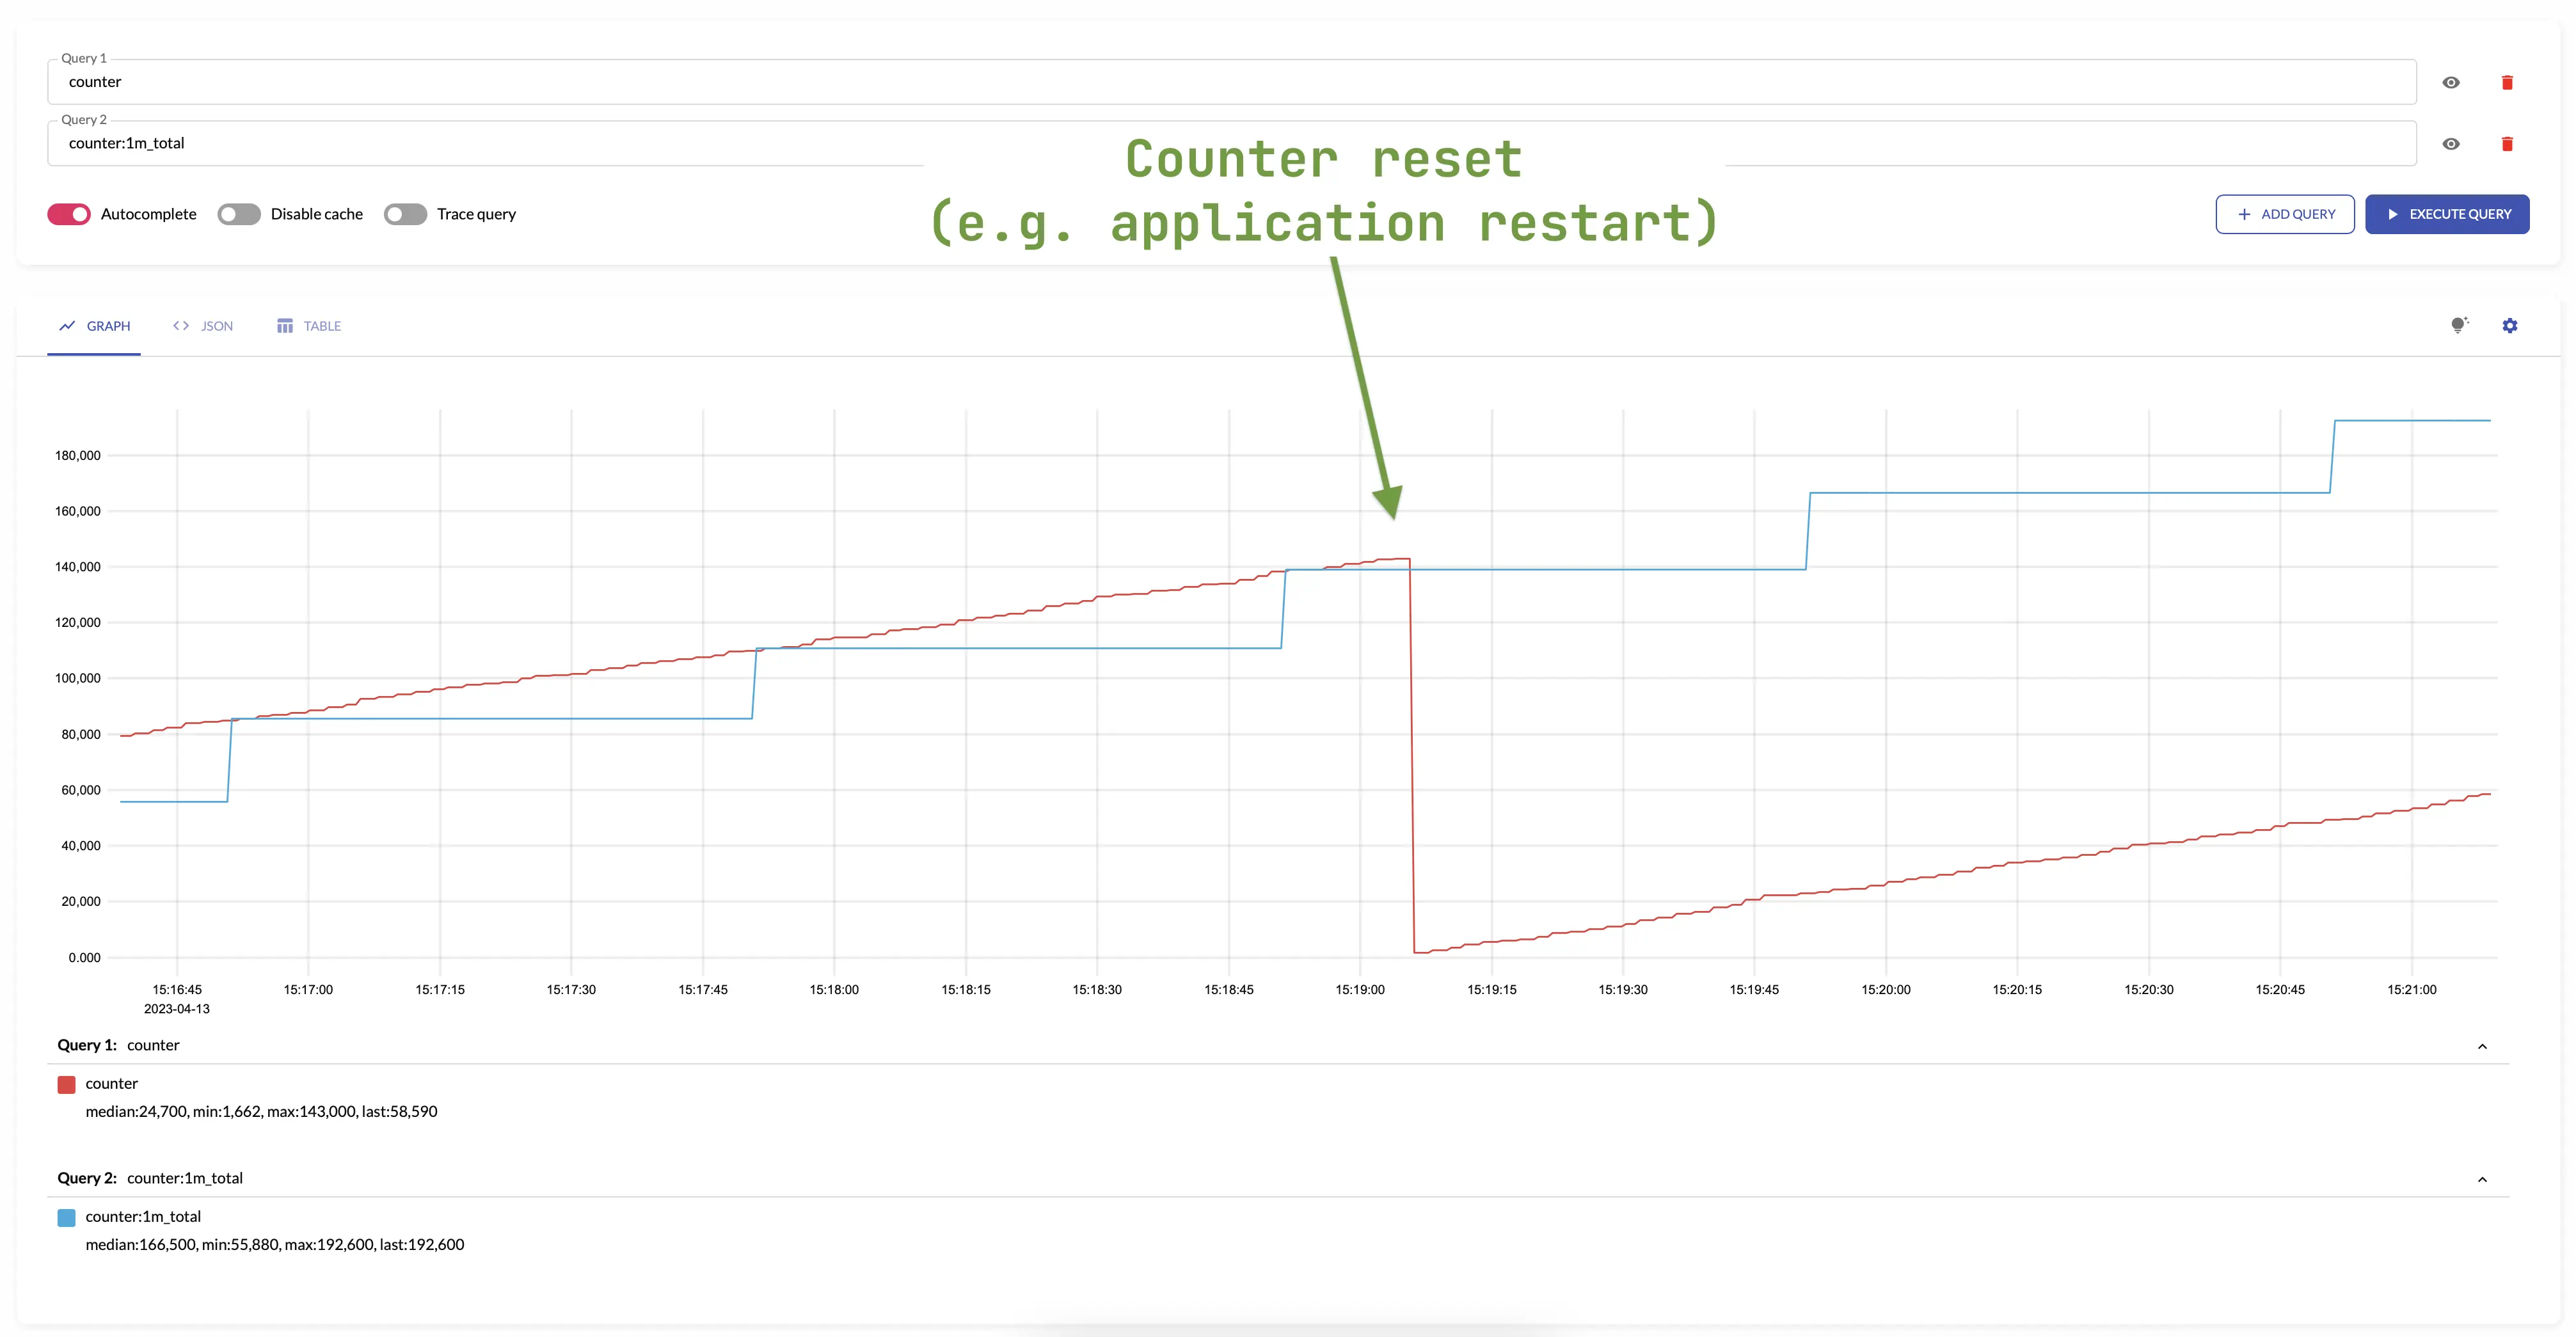
total is not affected by
counter resets
-
it continues to increase monotonically with respect to the previous value.
The counters are most often reset when the application is restarted.
For example:
The same behavior occurs when creating or deleting new series in an aggregation group -
total output increases monotonically considering the values of the series set.
An example of changing a set of series can be restarting a pod in the Kubernetes.
This changes pod name label, but the total accounts for such a scenario and doesn’t reset the state of aggregated metric.
Aggregating irregular and sporadic metrics (received from Lambdas or Cloud Functions ) can be controlled via staleness_interval option.
See also:
total_prometheus #
total_prometheus generates output
counter
by summing the input counters over the given interval.
total_prometheus makes sense only for aggregating
counters
.
The results of total_prometheus is roughly equal to the following
MetricsQL
query:
sum(running_sum(increase_prometheus(some_counter)))
total_prometheus skips the first seen sample value per each
time series
.
If you need taking into account the first sample per time series, then take a look at
total
.
total_prometheus is not affected by
counter resets
-
it continues to increase monotonically with respect to the previous value.
The counters are most often reset when the application is restarted.
Aggregating irregular and sporadic metrics (received from Lambdas or Cloud Functions ) can be controlled via staleness_interval option.
See also:
unique_samples #
unique_samples counts the number of unique sample values over the given interval.
unique_samples makes sense only for aggregating
gauges
.
The results of unique_samples is equal to the following
MetricsQL
query:
count(count_values_over_time(some_metric[interval]))
See also:
quantiles #
quantiles(phi1, ..., phiN) returns percentiles
for the given phi*
over the input
sample values
on the given interval.
phi must be in the range [0..1], where 0 means 0th percentile, while 1 means 100th percentile.
quantiles(...) makes sense only for aggregating
gauges
.
The results of quantiles(phi1, ..., phiN) is equal to the following
MetricsQL
query:
histogram_quantiles("quantile", phi1, ..., phiN, sum(histogram_over_time(some_metric[interval])) by (vmrange))
See also: