vmestimator measures metrics cardinality across arbitrary label dimensions in real time and exposes the results as metrics.
Why measure? #
Consider a setup where metrics are pushed or scraped from hundreds of targets.
One day, a team deploys a new version of their service with a trace_id or user_id label.
Overnight, that job’s cardinality
explodes from 500 to 500,000 time series.
Suddenly, Time Series DB that stores these metrics starts consuming 100x more memory and disk.
Ingestion slows down, storage struggles to keep up, and in the worst case becomes unavailable.
By the time someone gets paged, the damage is already done: indexes are bloated, caches are oversized, and observability across the entire system is affected.
vmestimator continuously tracks cardinality in real time and exposes the estimation results as metrics
.
This allows alerting on cardinality spikes within minutes and identifying the offending label directly from the alert.
Instead of discovering the problem after it impacts the infrastructure, it becomes possible to react before it turns into an outage.
vmestimator can measure cardinality across arbitrary label dimensions, enabling use cases such as per-tenant usage analysis,
long-term trend tracking, and capacity planning. See more use cases
.
Key features #
- real-time in-flight cardinality tracking without impacting the metrics source or storage
- no vendor-lock: works with any Prometheus-compatible database or agent
- configurable measurement windows, labels grouping
- low resource usage: can handle millions of samples/s and hundreds of millions unique time series on a single machine
- horizontally scalable
- goes with default alerting rules and Grafana dashboards
Design #
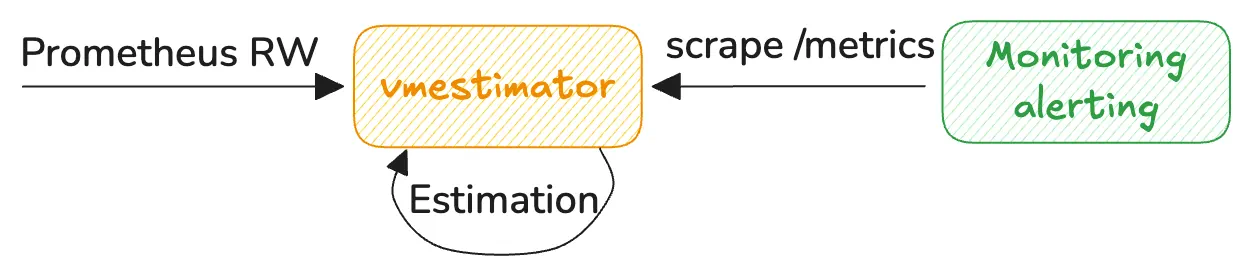
vmestimator accepts traffic for analysis via Prometheus remote write v1 protocol. It then computes the cardinality of
the ingested metrics according to the given configuration
and exposes cardinality metrics
in Prometheus exposition format on /metrics endpoint, so they can be scraped by any Prometheus-compatible collector.
vmestimator is heavily optimized for high-throughput processing. It approximately requires 1 CPU core for ingesting
around 800K metric samples/s and around 150MiB of memory per each stream
(tracking 3Mil unique time series via 2 streams is using 200MiB on the testing stand).
It is expected for one vmestimator instance to easily handle traffic for millions of samples/s and hundreds of millions unique time series. It is also possible
to scale vmestimator horizontally
.
We recommend deploying vmestimator close to the metrics source, ideally alongside vmagent instances that scrape or forward metrics.
Configure each vmagent to
replicate
all metrics into the vmestimator.
Run vmestimator:
/path/to/vmestimator -config=streams.yaml # -httpListenAddr=:8490
Run vmagent:
      /path/to/vmagent \
  -remoteWrite.url=http://127.0.0.1:8428/api/v1/write \ # main remote destination
  -remoteWrite.url=http://127.0.0.1:8490/cardinality/api/v1/write \ # replicate workload to vmestimator
  -remoteWrite.disableOnDiskQueue=false,true \ # disable queueing for vmestimator
  -remoteWrite.disableMetadata=false,true # disable metadata for vmestimator
To reduce overhead, persistent queueing and metadata ingestion can be disabled for the estimator remote write path.
It is safe to send metrics from multiple independent vmagent instances into a single vmestimator.
The next step is to expose cardinality estimates as metrics.
For this, vmagent should scrape the estimator /metrics endpoint and forward those metrics to a vmsingle instance (or another VictoriaMetrics storage).
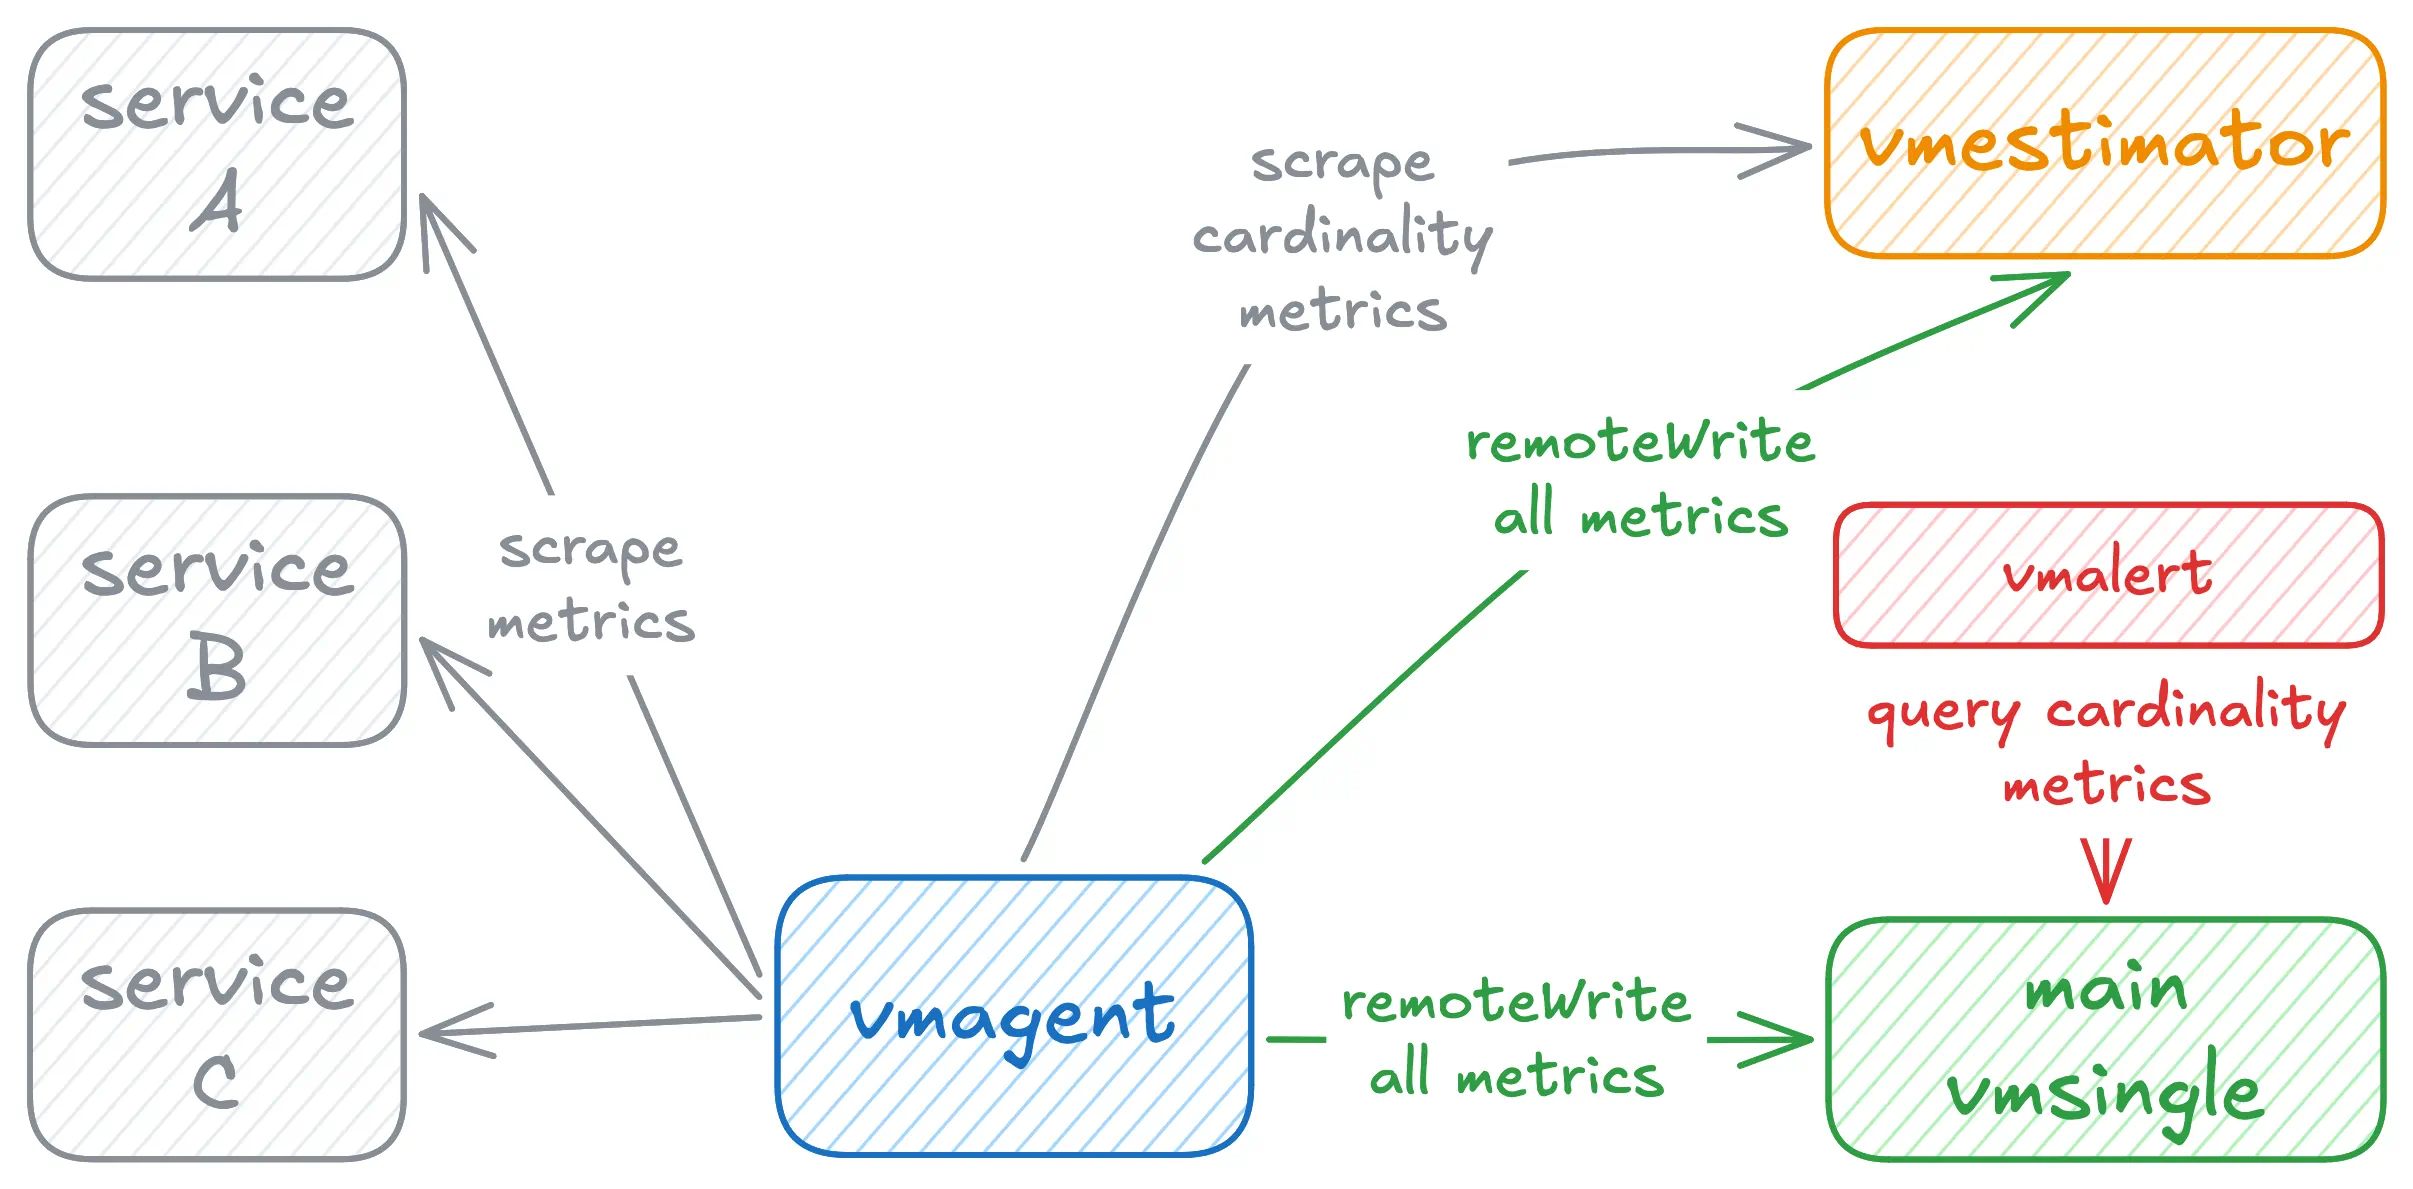
In this way, vmestimator is just an alternative pipeline for ingesting metrics and collecting computed cardinality estimates.
Overloading vmestimator won’t have any impact on the rest of the Observability pipeline.
This setup is straightforward and introduces minimal overhead. The main drawback is that cardinality data shares the same storage with production metrics. If that storage becomes unavailable, the visibility into cardinality is lost precisely when it may be most needed.
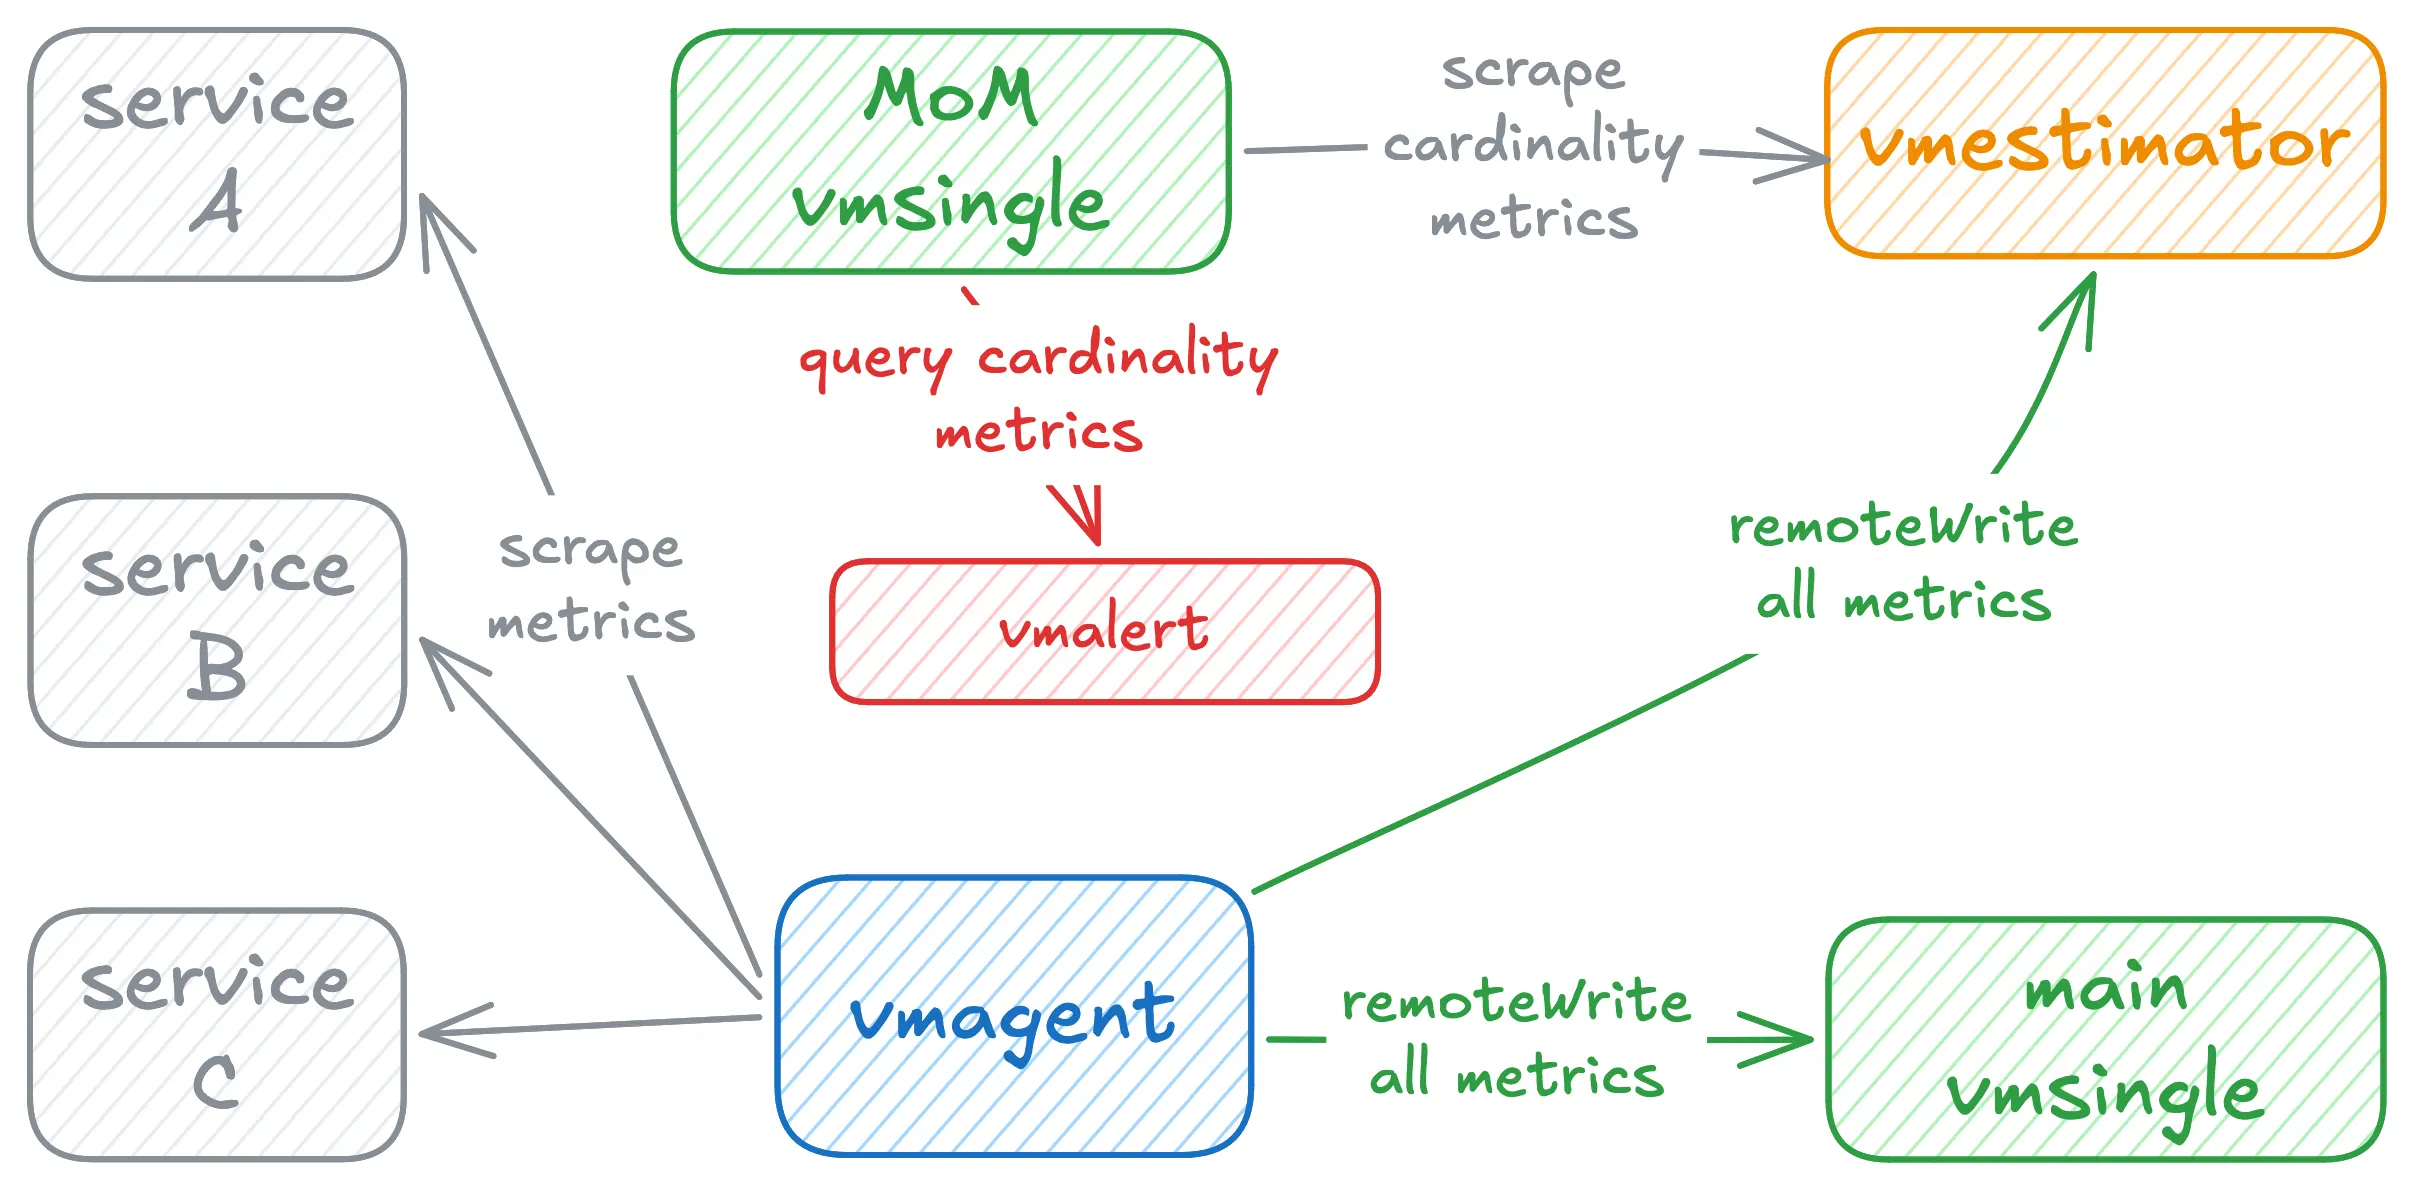
To mitigate this, we recommend running a separate vmsingle instance dedicated to scraping and storing VictoriaMetrics-related monitoring signals only.
This pattern is commonly referred to as a monitoring-of-monitoring (MoM) setup.
In this architecture, vmestimator metrics are isolated from production observability storage,
ensuring cardinality visibility remains available even during incidents affecting the primary monitoring system.
The resulting topology looks like this:
Install #
Create a streams.yaml from example config
.
Run the Docker image from Docker Hub
or Quay
, mounting your config file:
      docker run --rm \
  -p 8490:8490 \
  -v /path/to/streams.yaml:/streams.yaml \
  docker.io/victoriametrics/vmestimator:latest \
  -config=/streams.yaml
See Use Cases for more configuration examples and Command-line flags for all available options.
To build from sources, see How to build from sources .
Configuration #
To run vmestimator a streams.yaml config has to be provided (see example config
:
/path/to/vmestimator -config=streams.yaml # -httpListenAddr=:8490
Config reference:
      streams:
  -
    # The measurement window: how long unique series are retained before the HLL sketch resets.
    # Increases are always reflected immediately. Interval only controls how fast the estimate
    # drops after previously seen series disappear.
    #
    # Running two streams with different intervals (e.g. 5m and 1h) lets you derive churn rate
    # by comparing their estimates. See Use Cases -> Churn Rate
    #
    # default: 5m
    interval: <duration>

    # Optional. Label names used to split the cardinality estimate into per-combination groups.
    # Each distinct combination of values for these labels gets its own estimate metric.
    # Omit entirely for a single global estimate across all series.
    # Examples:
    #  - ["job"]
    #  - ["__name__"]
    #  - ["vm_account_id","vm_project_id"]
    #
    # default: none (single global estimate)
    group_by: '[<string>, ...]'

    # Optional. Maximum number of distinct groups (HLL sketches) to track.
    # Once the limit is reached, excess groups are counted in a single shared "rejected" sketch
    # rather than getting their own entry. Acts as a memory cap and a safeguard against OOM
    # when the group_by label values grow unboundedly.
    # Memory upper bound per stream:
    #   group_limit * 2^hll_precision bytes.
    #
    # default: 10000
    group_limit: <integer>

    # Optional. Number of shards used to reduce lock contention during parallel ingestion.
    # Slightly increases memory for global streams (no group_by); negligible otherwise.
    # Leave at the default unless you have profiled lock contention or have a specific reason to change it.
    #
    # default: min(64, 2*availableCPUs)
    buckets:  <integer>

    # Optional. HyperLogLog precision p, in range [4..18].
    # Determines the number of registers m = 2^p and the relative error 1.04 / sqrt(m):
    #   p=14 → m=16 384, error ~0.81%, memory ~16 KB per sketch  (default, suits most cases)
    #   p=18 → m=262 144, error ~0.20%, memory ~256 KB per sketch (billing-grade accuracy)
    #   p=10 → m=1 024,   error ~3.25%, memory ~1 KB per sketch   (thousands of groups, memory-tight)
    # See more in https://research.google.com/pubs/archive/40671.pdf
    #
    # default: 14
    hll_precision: <integer>

    # Optional. Whether to use the sparse HyperLogLog representation for low-cardinality groups.
    # Sparse mode uses far less memory until a group's cardinality reaches ~2^(p-1),
    # at which point it automatically promotes to the dense representation.
    # See more in # See more in https://research.google.com/pubs/archive/40671.pdf
    #
    # default: true
    hll_sparse: <bool>

    # Optional. Static labels attached to every output metric produced by this stream entry.
    # Useful when multiple vmestimator instances feed the same storage and you need
    # to distinguish their estimates in dashboards and alerts.
    labels:
      <labelname>: <labelvalue> ...
Cardinality Metrics #
Cardinality estimates are exposed as the cardinality_estimate metric.
All metrics include interval, group_by_keys, group_by_values, and any static labels defined in the stream config.
For global estimates (no group_by configured), group_by_keys is __global__ and group_by_values is omitted:
cardinality_estimate{interval="1h0m0s",group_by_keys="__global__"} 142300
For grouped estimates, one summary line shows the total number of distinct groups group_by_keys="__group__", followed by one line per distinct label value combination.
Each per-group line also includes individual by_{key}="{val}" labels:
      cardinality_estimate{interval="5m0s",group_by_keys="__group__",group_by_values="instance,job"} 2
cardinality_estimate{interval="5m0s",group_by_keys="instance,job",group_by_values="host1:9090,prometheus",by_instance="host1:9090",by_job="prometheus"} 312
cardinality_estimate{interval="5m0s",group_by_keys="instance,job",group_by_values="host2:9100,node",by_instance="host2:9100",by_job="node"} 87
Note: the total distinct group count in the summary line may exceed the number of per-group lines when group_limit is reached
and excess groups are counted in a single shared “rejected” sketch rather than getting their own entry.
By default, cardinality estimates are merged with the estimator’s operational metrics and exposed at /metrics.
This is controlled by the -cardinalityMetrics.exposeAt flag:
-cardinalityMetrics.exposeAt=/metrics(default): cardinality metrics merged with operational metrics at/metrics-cardinalityMetrics.exposeAt=/cardinality/metrics: cardinality metrics exposed at separate path-cardinalityMetrics.exposeAt=: cardinality metrics not exposed via HTTP
Computing cardinality estimates is expensive, so results are cached.
Cache duration is controlled by -cardinalityMetrics.cacheTTL (default: 30s).
Set to 0 to disable caching entirely.
Use Cases #
Basic #
Global cardinality:
      # streams.yaml

- interval: '5m'
Per metric name cardinality:
      # streams.yaml

- interval: '5m'
  group_by: ['__name__']
Per job label cardinality:
      # streams.yaml

- interval: '5m'
  group_by: ['job']
Per tenant cardinality:
      # streams.yaml

- interval: '5m'
  group_by: ['vm_account_id', 'vm_project_id']
Churn calculation #
Churn rate measures how quickly time series are created and disappear. High churn means many series appear briefly and are replaced by new ones. This puts pressure on storage, because each new series must be indexed regardless of how short its lifetime is.
To measure churn, configure two streams with the same group_by but different intervals. A short one (15m) and a long one (30m):
      # streams.yaml

- interval: '15m'
  group_by: ['job']

- interval: '30m'
  group_by: ['job']
When churn is low, both estimates are roughly equal.
When churn is high, the 30m estimate grows significantly larger than the 15m estimate, because the long window accumulates series that have already disappeared.
The following query computes the churn ratio per job:
      (
    sum(
        max(cardinality_estimate{group_by_keys="job",interval="30m0s"}) without (instance)
    ) by (group_by_keys,group_by_values)
    -
    sum(
        max(cardinality_estimate{group_by_keys="job",interval="15m0s"}) without (instance)
    ) by (group_by_keys,group_by_values)
)
/
sum(
    max(cardinality_estimate{group_by_keys="job",interval="30m0s"}) without (instance)
) by (group_by_keys,group_by_values) * 100
A result near 0 means the series set is stable. The same series were active throughout the entire hour.
A result near 1 means complete churn. Entirely different series appeared each 5-minute window.
Values in between indicate the fraction of maximum possible churn that is occurring.
This helps identify jobs that create the most indexing pressure on storage, even when their current active cardinality appears moderate.
Alerting #
Pre-built alert rules for cardinality monitoring are available in deployment/docker/rules/alerts-cardinality.yml .
They require two streams with the same group_by but different intervals to also support churn detection:
      # streams.yaml
# or use example config:
# https://github.com/VictoriaMetrics/vmestimator/blob/main/streams.yaml

- interval: '15m'
  group_by: ['job']

- interval: '30m'
  group_by: ['job']
The included alerts are:
JobTooHighCardinality — fires when any job exceeds 20,000 estimated active series over the last 30 minutes. The threshold is a starting point and should be calibrated to reflect the expected cardinality of your largest jobs.
JobTooHighChurnRate — fires when more than 10% of a job’s series churned between the 15m and 30m windows. Catches jobs that generate continuous indexing pressure even when their active series count looks moderate.
CardinalityGroupLimitNearlyReached — fires when the number of tracked groups exceeds 80% of the configured
group_limit. Acts as an early warning that some label value combinations may soon be dropped from individual tracking.CardinalityGroupLimitReached — fires when groups are actively rejected because
group_limitis full. At this point, some label combinations are being counted in a shared “rejected” sketch rather than tracked individually.
All alerts link to the Cardinality Explorer dashboard .
Alternative solutions #
PromQL #
Cardinality can be estimated with PromQL.
Global cardinality:
count({__name__=~".*"})
Top ten metric names by cardinality:
topk(10, count({__name__=~".*"}) by (__name__))
Top ten jobs by cardinality:
topk(10, count({__name__=~".*"}) by (job))
This approach works for small setups but does not scale well, because these queries scan the entire time series set. Most critically, if the storage is overloaded or unavailable, these queries could not be executed.
Cardinality Explorer #
VictoriaMetrics includes a built-in cardinality explorer . It provides per-metric detail beyond raw series counts: query frequency, last access time, day-over-day change, and share of total cardinality. It is well suited for in-depth, ad-hoc investigation. For example, finding metrics that are high-cardinality but rarely queried, so they can be dropped via relabeling or reduce cardinality with stream aggregation .
Both tools serve different purposes and work well together.
Use vmestimator for continuous monitoring, alerting, and cross-cluster cardinality tracking.
Use the cardinality explorer when you need to drill into a specific metric or label and understand what is driving its cardinality.
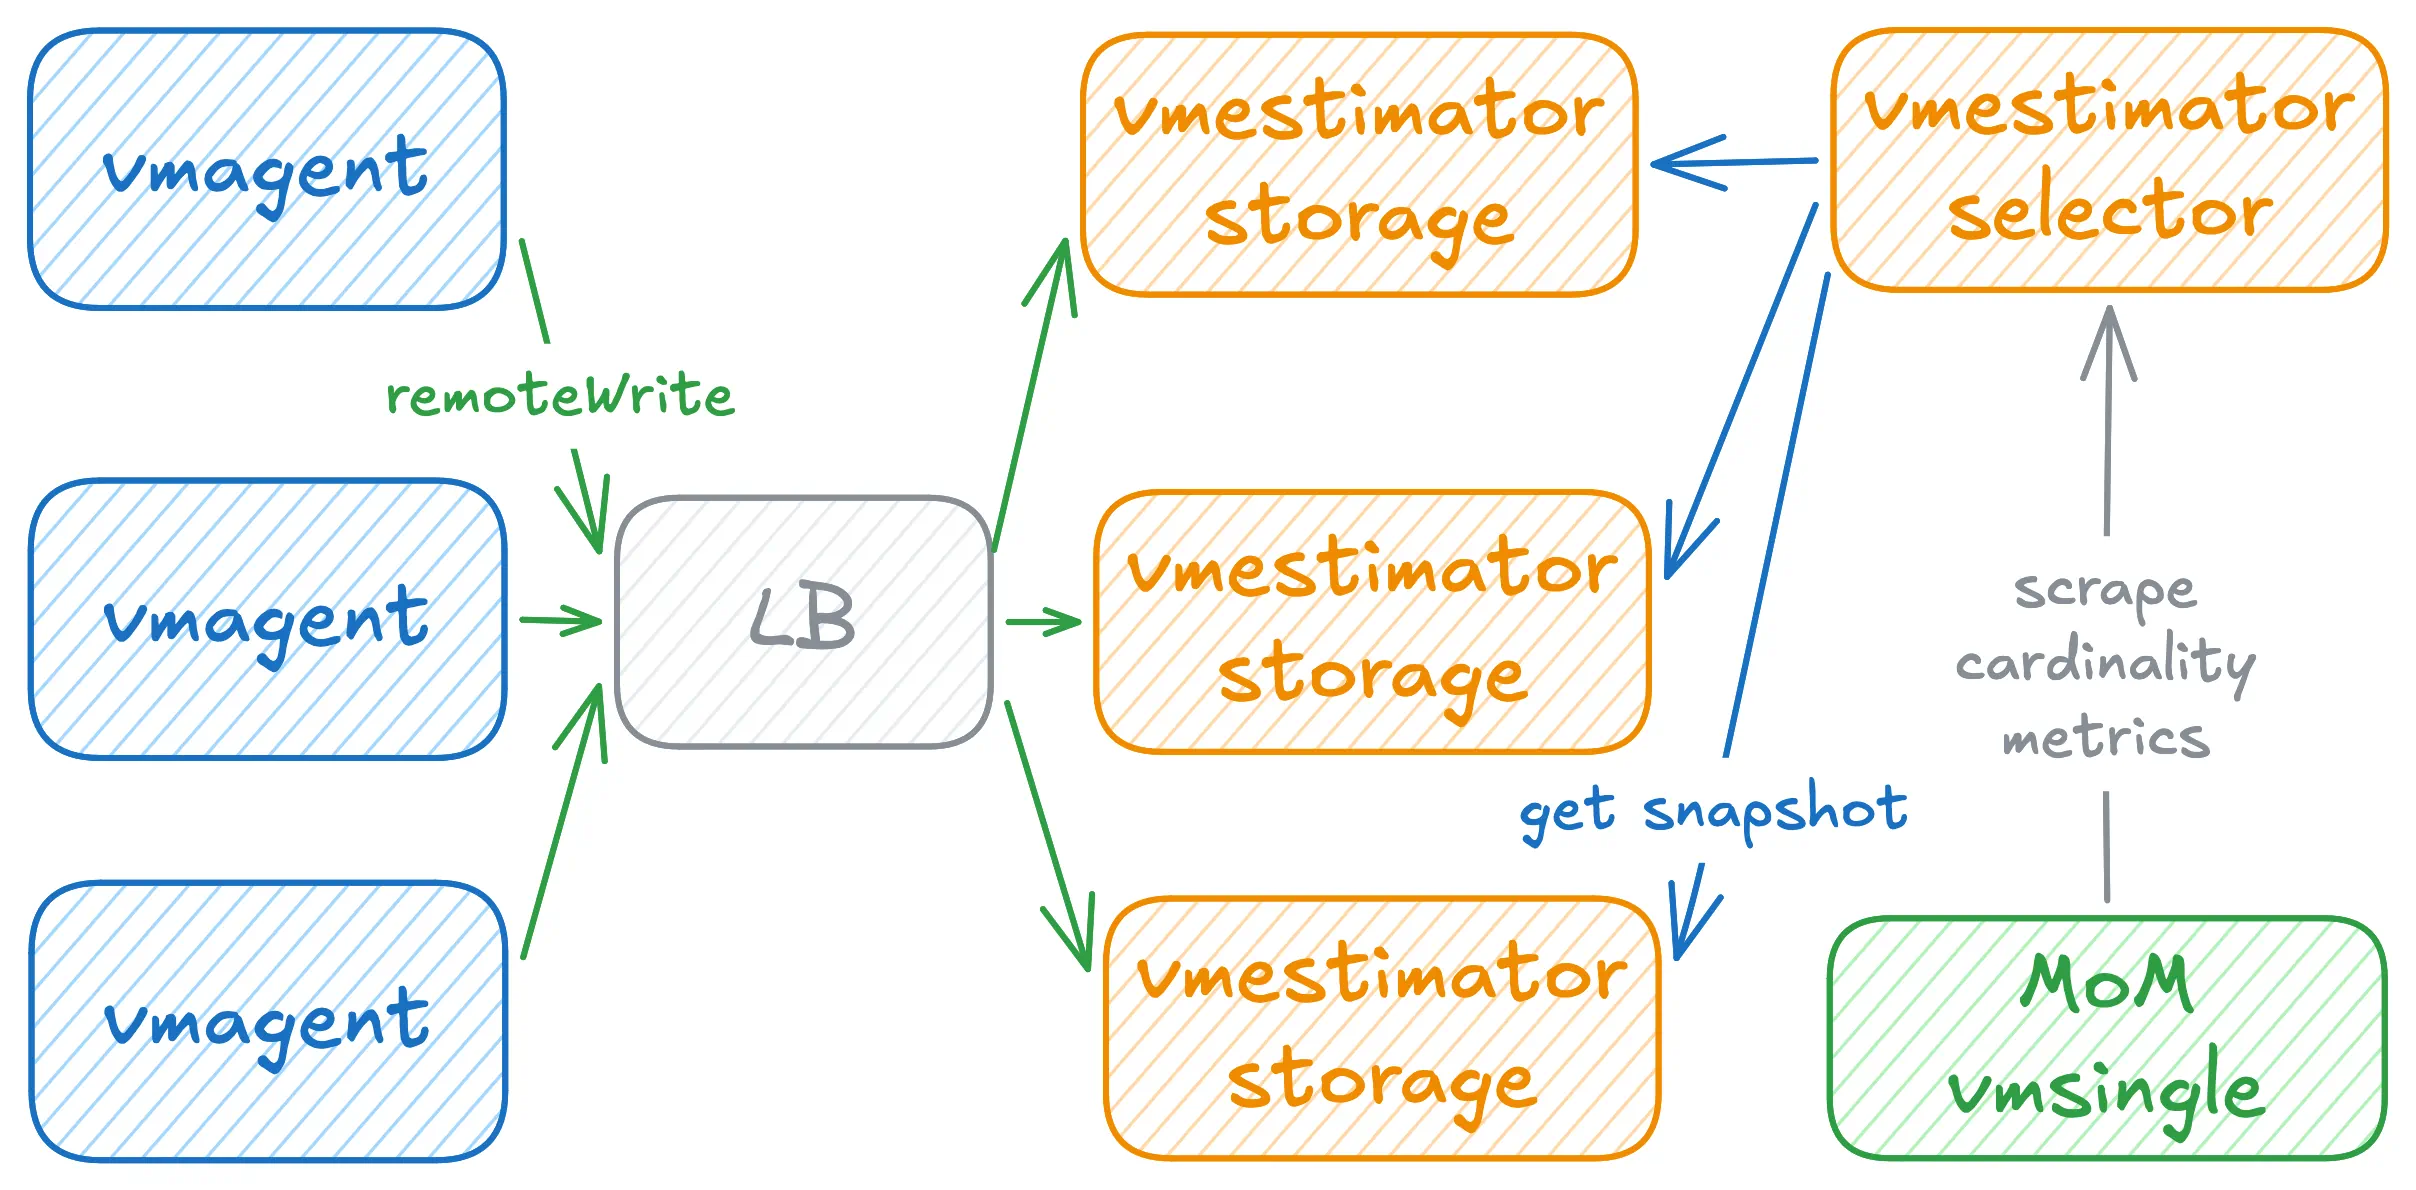
Cluster #
vmestimator supports a clustered deployment for high availability or when CPU on a single instance becomes a limiting factor.
Instances are split into two roles: storage nodes accept Prometheus remote write and maintain local HyperLogLog sketches; selector nodes query all storage nodes, merge their sketches, and expose a unified cardinality estimate. Cardinality estimate results should be scraped from selector nodes.
Storage nodes:
      vmestimator -config=streams.yaml -httpListenAddr=:8491 -cardinalityMetrics.exposeAt=/cardinality/metrics
vmestimator -config=streams.yaml -httpListenAddr=:8492 -cardinalityMetrics.exposeAt=/cardinality/metrics
vmestimator -config=streams.yaml -httpListenAddr=:8493 -cardinalityMetrics.exposeAt=/cardinality/metrics
Selector nodes:
      vmestimator -storageNode=http://vmestimator-storage-1:8491 \
            -storageNode=http://vmestimator-storage-2:8492 \
            -storageNode=http://vmestimator-storage-3:8493 \
            -httpListenAddr=:8490
Setting -cardinalityMetrics.exposeAt=/cardinality/metrics on storage nodes keeps per-node estimates off the default /metrics path. The /metrics endpoint then returns only operational metrics, while /cardinality/metrics exposes the node’s local estimate — useful for inspecting or debugging a specific node.
A selector with -storageNode flags and no -config runs without local estimators and only merges remote data.
When multiple selector nodes are scraped, each returns a fully merged estimate. Deduplicate at query time to avoid overcounting:
max(cardinality_estimate) without (instance)
Operational metrics #
When grouping is enabled, vmestimator exposes per-bucket operational metrics at /metrics:
vmestimator_estimator_group_size{group_by_keys, bucket}— number of active groups in this bucket after the last rotationvmestimator_estimator_group_rejected_size{group_by_keys}— estimated number of distinct group values rejected since the last rotation becausegroup_limitwas reachedvmestimator_estimator_group_limit{group_by_keys, bucket}— configuredgroup_limitfor this bucket
Additionally, every stream (including non-grouped ones) exposes:
vmestimator_estimator_insert_total{group_by_keys, interval}— total number of samples inserted into this stream’s estimator
Dashboards #
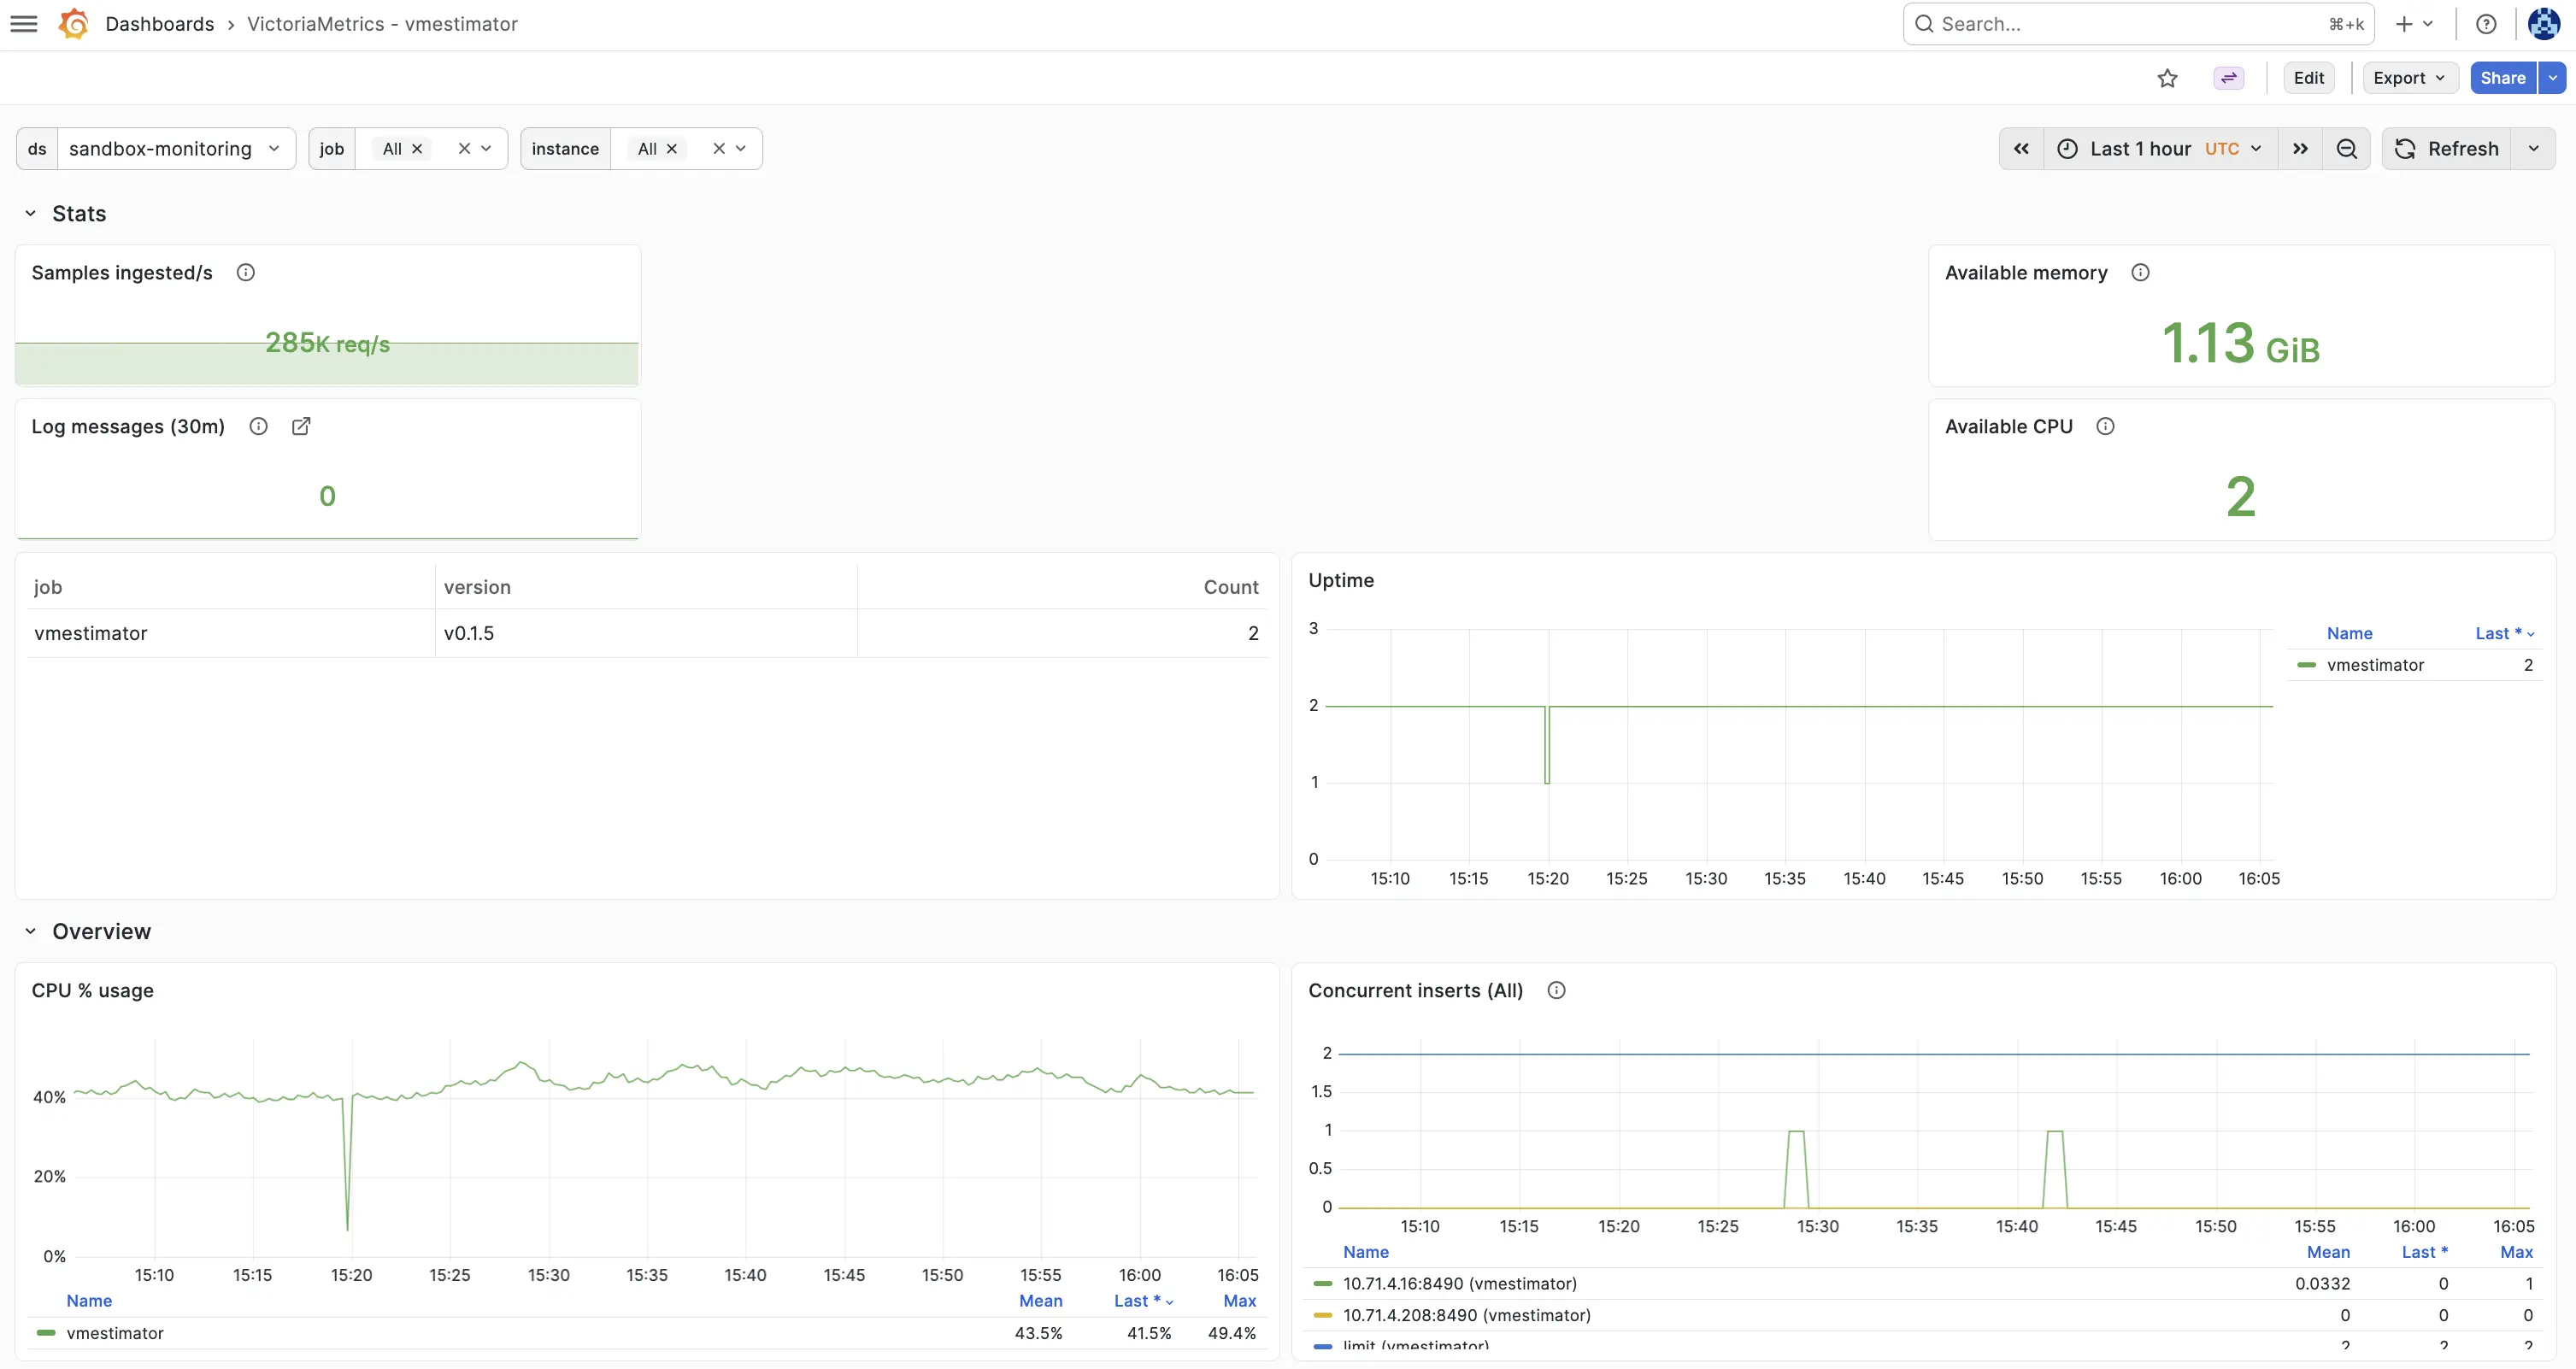
Two Grafana dashboards are available in the dashboards directory:
VictoriaMetrics - vmestimator — application health: CPU, memory, ingestion rates, concurrent inserts, and group key saturation.
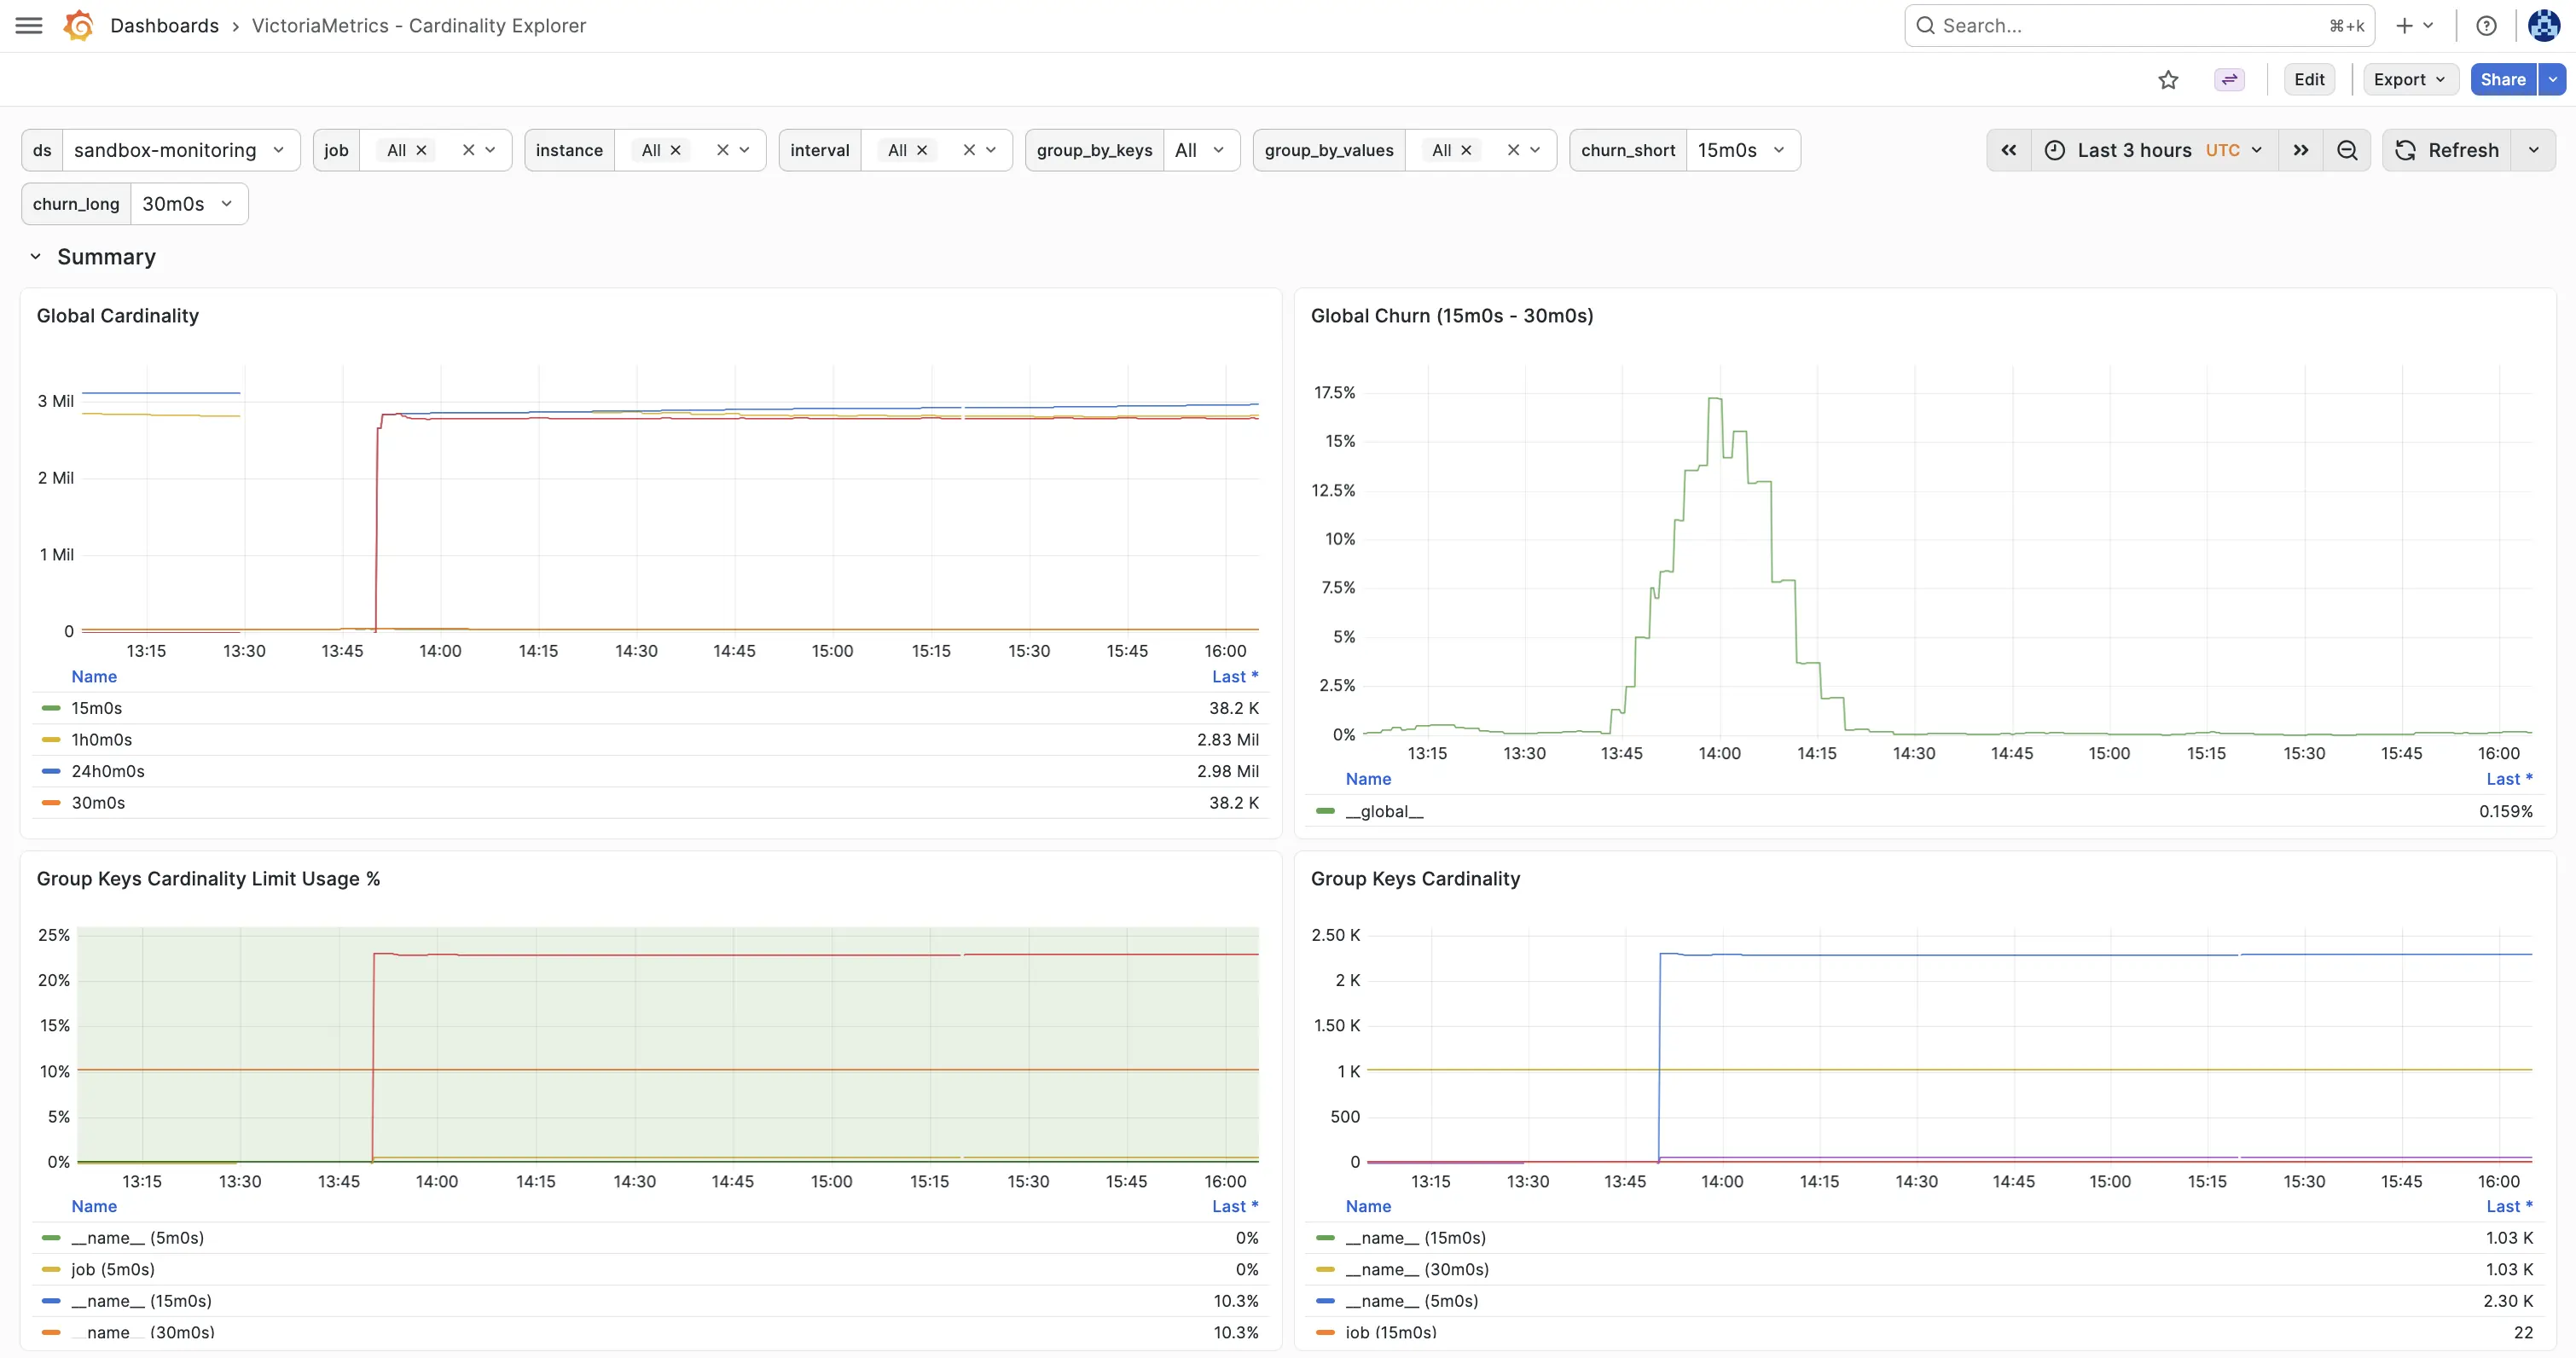
VictoriaMetrics - Cardinality Estimations — cardinality estimations: shows estimations, churn over configured label dimensions.
How to build from sources #
It is recommended to use the docker images .
Development build:
- Install Go .
- Run
make vmestimatorfrom the root folder of the repository . It buildsvmestimatorbinary and places it into thebinfolder.
Production build:
- Install docker .
- Run
make vmestimator-prodfrom the root folder of the repository . It buildsvmestimator-prodbinary and puts it into thebinfolder.
Building docker images:
Run make package-vmestimator. It builds victoriametrics/vmestimator:<PKG_TAG> docker image locally.
<PKG_TAG> is auto-generated image tag, which depends on source code in the repository.
The <PKG_TAG> may be manually set via PKG_TAG=foobar make package-vmestimator.
The base docker image is alpine
but it is possible to use any other base image by setting it via <ROOT_IMAGE> environment variable.
For example, the following command builds the image on top of scratch
image:
ROOT_IMAGE=scratch make package-vmrestore
You can build and publish to your own registry and namespace:
DOCKER_REGISTRIES=ghcr.io DOCKER_NAMESPACE=foo make publish-vmagent
Command-line flags #
Run vmestimate -help in order to see all the available options:
      Usage of ./bin/vmestimator:
  -cardinalityMetrics.cacheTTL duration
        Duration for caching cardinality metrics response (default 30s)
  -cardinalityMetrics.exposeAt string
        HTTP path for exposing cardinality metrics. If set to the default /metrics, cardinality metrics are merged with regular metrics and exposed together. If set to a different path, only cardinality metrics are exposed at that endpoint. If set to an empty value, cardinality metrics are not exposed via HTTP at all. (default "/metrics")
  -config string
        Path to YAML configuration file. Must be set unless -storageNode is specified. See https://github.com/VictoriaMetrics/cestimator/blob/main/streams.yaml for config example
  -enableTCP6
        Whether to enable IPv6 for listening and dialing. By default, only IPv4 TCP and UDP are used
  -envflag.enable
        Whether to enable reading flags from environment variables in addition to the command line. Command line flag values have priority over values from environment vars. Flags are read only from the command line if this flag isn't set. See https://docs.victoriametrics.com/victoriametrics/single-server-victoriametrics/#environment-variables for more details
  -envflag.prefix string
        Prefix for environment variables if -envflag.enable is set
  -filestream.disableFadvise
        Whether to disable fadvise() syscall when reading large data files. The fadvise() syscall prevents from eviction of recently accessed data from OS page cache during background merges and backups. In some rare cases it is better to disable the syscall if it uses too much CPU
  -flagsAuthKey value
        Auth key for /flags endpoint. It must be passed via authKey query arg. It overrides -httpAuth.*
        Flag value can be read from the given file when using -flagsAuthKey=file:///abs/path/to/file or -flagsAuthKey=file://./relative/path/to/file.
        Flag value can be read from the given http/https url when using -flagsAuthKey=http://host/path or -flagsAuthKey=https://host/path
  -fs.maxConcurrency int
        The maximum number of concurrent goroutines to work with files; smaller values may help reducing Go scheduling latency on systems with small number of CPU cores; higher values may help reducing data ingestion latency on systems with high-latency storage such as NFS or Ceph (default 160)
  -http.connTimeout duration
        Incoming connections to -httpListenAddr are closed after the configured timeout. This may help evenly spreading load among a cluster of services behind TCP-level load balancer. Zero value disables closing of incoming connections (default 2m0s)
  -http.disableCORS
        Disable CORS for all origins (*)
  -http.disableKeepAlive
        Whether to disable HTTP keep-alive for incoming connections at -httpListenAddr
  -http.disableResponseCompression
        Disable compression of HTTP responses to save CPU resources. By default, compression is enabled to save network bandwidth
  -http.header.csp string
        Value for 'Content-Security-Policy' header, recommended: "default-src 'self'"
  -http.header.disableServerHostname
        Whether to disable 'X-Server-Hostname' header in HTTP responses
  -http.header.frameOptions string
        Value for 'X-Frame-Options' header
  -http.header.hsts string
        Value for 'Strict-Transport-Security' header, recommended: 'max-age=31536000; includeSubDomains'
  -http.idleConnTimeout duration
        Timeout for incoming idle http connections (default 1m0s)
  -http.maxGracefulShutdownDuration duration
        The maximum duration for a graceful shutdown of the HTTP server. A highly loaded server may require increased value for a graceful shutdown (default 7s)
  -http.pathPrefix string
        An optional prefix to add to all the paths handled by http server. For example, if '-http.pathPrefix=/foo/bar' is set, then all the http requests will be handled on '/foo/bar/*' paths. This may be useful for proxied requests. See https://www.robustperception.io/using-external-urls-and-proxies-with-prometheus
  -http.shutdownDelay duration
        Optional delay before http server shutdown. During this delay, the server returns non-OK responses from /health page, so load balancers can route new requests to other servers
  -httpAuth.password value
        Password for HTTP server's Basic Auth. The authentication is disabled if -httpAuth.username is empty
        Flag value can be read from the given file when using -httpAuth.password=file:///abs/path/to/file or -httpAuth.password=file://./relative/path/to/file.
        Flag value can be read from the given http/https url when using -httpAuth.password=http://host/path or -httpAuth.password=https://host/path
  -httpAuth.username string
        Username for HTTP server's Basic Auth. The authentication is disabled if empty. See also -httpAuth.password
  -httpListenAddr array
        TCP address to listen for incoming HTTP requests
        Supports an array of values separated by comma or specified via multiple flags.
        Each array item can contain comma inside single-quoted or double-quoted string, {}, [] and () braces.
  -insert.maxQueueDuration duration
        The maximum duration to wait in the queue when -maxConcurrentInserts concurrent insert requests are executed (default 1m0s)
  -internStringCacheExpireDuration duration
        The expiry duration for caches for interned strings. See https://en.wikipedia.org/wiki/String_interning . See also -internStringMaxLen and -internStringDisableCache (default 6m0s)
  -internStringDisableCache
        Whether to disable caches for interned strings. This may reduce memory usage at the cost of higher CPU usage. See https://en.wikipedia.org/wiki/String_interning . See also -internStringCacheExpireDuration and -internStringMaxLen
  -internStringMaxLen int
        The maximum length for strings to intern. A lower limit may save memory at the cost of higher CPU usage. See https://en.wikipedia.org/wiki/String_interning . See also -internStringDisableCache and -internStringCacheExpireDuration (default 500)
  -loggerDisableTimestamps
        Whether to disable writing timestamps in logs
  -loggerErrorsPerSecondLimit int
        Per-second limit on the number of ERROR messages. If more than the given number of errors are emitted per second, the remaining errors are suppressed. Zero values disable the rate limit
  -loggerFormat string
        Format for logs. Possible values: default, json (default "default")
  -loggerJSONFields string
        Allows renaming fields in JSON formatted logs. Example: "ts:timestamp,msg:message" renames "ts" to "timestamp" and "msg" to "message". Supported fields: ts, level, caller, msg
  -loggerLevel string
        Minimum level of errors to log. Possible values: INFO, WARN, ERROR, FATAL, PANIC (default "INFO")
  -loggerMaxArgLen int
        The maximum length of a single logged argument. Longer arguments are replaced with 'arg_start..arg_end', where 'arg_start' and 'arg_end' is prefix and suffix of the arg with the length not exceeding -loggerMaxArgLen / 2 (default 5000)
  -loggerOutput string
        Output for the logs. Supported values: stderr, stdout (default "stderr")
  -loggerTimezone string
        Timezone to use for timestamps in logs. Timezone must be a valid IANA Time Zone. For example: America/New_York, Europe/Berlin, Etc/GMT+3 or Local (default "UTC")
  -loggerWarnsPerSecondLimit int
        Per-second limit on the number of WARN messages. If more than the given number of warns are emitted per second, then the remaining warns are suppressed. Zero values disable the rate limit
  -maxConcurrentInserts int
        The maximum number of concurrent insert requests. Set higher value when clients send data over slow networks. Default value depends on the number of available CPU cores. It should work fine in most cases since it minimizes resource usage. See also -insert.maxQueueDuration (default 20)
  -maxInsertRequestSize size
        The maximum size in bytes of a single Prometheus remote_write API request
        Supports the following optional suffixes for size values: KB, MB, GB, TB, KiB, MiB, GiB, TiB (default 33554432)
  -memory.allowedBytes size
        Allowed size of system memory VictoriaMetrics caches may occupy. This option overrides -memory.allowedPercent if set to a non-zero value. Too low a value may increase the cache miss rate usually resulting in higher CPU and disk IO usage. Too high a value may evict too much data from the OS page cache resulting in higher disk IO usage. The process may behave unexpectedly if this flag is set too small (e.g., 1 byte).
        Supports the following optional suffixes for size values: KB, MB, GB, TB, KiB, MiB, GiB, TiB (default 0)
  -memory.allowedPercent float
        Allowed percent of system memory VictoriaMetrics caches may occupy. See also -memory.allowedBytes. Too low a value may increase cache miss rate usually resulting in higher CPU and disk IO usage. Too high a value may evict too much data from the OS page cache which will result in higher disk IO usage (default 60)
  -metrics.exposeMetadata
        Whether to expose TYPE and HELP metadata at the /metrics page, which is exposed at -httpListenAddr . The metadata may be needed when the /metrics page is consumed by systems, which require this information. For example, Managed Prometheus in Google Cloud - https://cloud.google.com/stackdriver/docs/managed-prometheus/troubleshooting#missing-metric-type
  -metricsAuthKey value
        Auth key for /metrics endpoint. It must be passed via authKey query arg. It overrides -httpAuth.*
        Flag value can be read from the given file when using -metricsAuthKey=file:///abs/path/to/file or -metricsAuthKey=file://./relative/path/to/file.
        Flag value can be read from the given http/https url when using -metricsAuthKey=http://host/path or -metricsAuthKey=https://host/path
  -pprofAuthKey value
        Auth key for /debug/pprof/* endpoints. It must be passed via authKey query arg. It overrides -httpAuth.*
        Flag value can be read from the given file when using -pprofAuthKey=file:///abs/path/to/file or -pprofAuthKey=file://./relative/path/to/file.
        Flag value can be read from the given http/https url when using -pprofAuthKey=http://host/path or -pprofAuthKey=https://host/path
  -pushmetrics.disableCompression
        Whether to disable request body compression when pushing metrics to every -pushmetrics.url
  -pushmetrics.extraLabel array
        Optional labels to add to metrics pushed to every -pushmetrics.url . For example, -pushmetrics.extraLabel='instance="foo"' adds instance="foo" label to all the metrics pushed to every -pushmetrics.url
        Supports an array of values separated by comma or specified via multiple flags.
        Each array item can contain comma inside single-quoted or double-quoted string, {}, [] and () braces.
  -pushmetrics.header array
        Optional HTTP request header to send to every -pushmetrics.url . For example, -pushmetrics.header='Authorization: Basic foobar' adds 'Authorization: Basic foobar' header to every request to every -pushmetrics.url
        Supports an array of values separated by comma or specified via multiple flags.
        Each array item can contain comma inside single-quoted or double-quoted string, {}, [] and () braces.
  -pushmetrics.interval duration
        Interval for pushing metrics to every -pushmetrics.url (default 10s)
  -pushmetrics.url array
        Optional URL to push metrics exposed at /metrics page. See https://docs.victoriametrics.com/victoriametrics/single-server-victoriametrics/#push-metrics . By default, metrics exposed at /metrics page aren't pushed to any remote storage
        Supports an array of values separated by comma or specified via multiple flags.
        Each array item can contain comma inside single-quoted or double-quoted string, {}, [] and () braces.
  -secret.flags array
        Comma-separated list of flag names with secret values. Values for these flags are hidden in logs and on /metrics page
        Supports an array of values separated by comma or specified via multiple flags.
        Each array item can contain comma inside single-quoted or double-quoted string, {}, [] and () braces.
  -storageNode array
        HTTP URLs of remote vmestimator nodes to query for cardinality snapshots, e.g. http://vmestimator-2:8490
        Supports an array of values separated by comma or specified via multiple flags.
        Each array item can contain comma inside single-quoted or double-quoted string, {}, [] and () braces.
  -tls array
        Whether to enable TLS for incoming HTTP requests at the given -httpListenAddr (aka https). -tlsCertFile and -tlsKeyFile must be set if -tls is set. See also -mtls
        Supports array of values separated by comma or specified via multiple flags.
        Empty values are set to false.
  -tlsCertFile array
        Path to file with TLS certificate for the corresponding -httpListenAddr if -tls is set. Prefer ECDSA certs instead of RSA certs as RSA certs are slower. The provided certificate file is automatically re-read every second, so it can be dynamically updated. See also -tlsAutocertHosts
        Supports an array of values separated by comma or specified via multiple flags.
        Each array item can contain comma inside single-quoted or double-quoted string, {}, [] and () braces.
  -tlsCipherSuites array
        Optional list of TLS cipher suites for incoming requests over HTTPS if -tls is set. See the list of supported cipher suites at https://pkg.go.dev/crypto/tls#pkg-constants
        Supports an array of values separated by comma or specified via multiple flags.
        Each array item can contain comma inside single-quoted or double-quoted string, {}, [] and () braces.
  -tlsKeyFile array
        Path to file with TLS key for the corresponding -httpListenAddr if -tls is set. The provided key file is automatically re-read every second, so it can be dynamically updated. See also -tlsAutocertHosts
        Supports an array of values separated by comma or specified via multiple flags.
        Each array item can contain comma inside single-quoted or double-quoted string, {}, [] and () braces.
  -tlsMinVersion array
        Optional minimum TLS version to use for the corresponding -httpListenAddr if -tls is set. Supported values: TLS10, TLS11, TLS12, TLS13
        Supports an array of values separated by comma or specified via multiple flags.
        Each array item can contain comma inside single-quoted or double-quoted string, {}, [] and () braces.
  -version
        Show VictoriaMetrics version