VictoriaStack is an open source observability stack for metrics, logs, and traces.
| Signal | Product | Query language | Scalability |
|---|---|---|---|
| Metrics | VictoriaMetrics | MetricsQL (PromQL-compatible) | Billions of active time series , Millions of samples ingested per second |
| Logs | VictoriaLogs | LogsQL | Hundreds of TBs a day, with avg post-compression ratio of x15 |
| Traces | VictoriaTraces | LogsQL , Jaeger API , Tempo API | Billions of spans per day with avg post-compression ratio of x15 |
Each database is a separate application, specialized for its own signal. All three share the same design philosophy, operational model, and ecosystem.
All three databases are open-source and free to use, Apache-2.0 licensed:
- VictoriaMetrics GitHub: https://github.com/VictoriaMetrics/VictoriaMetrics
- VictoriaLogs GitHub: https://github.com/VictoriaMetrics/VictoriaLogs
- VictoriaTraces GitHub: https://github.com/VictoriaMetrics/VictoriaTraces
Why VictoriaStack? #
VictoriaStack is built on three core principles: simplicity, reliability, and efficiency. It is easy to run and maintain. It fits well in home labs and scales reliably to large production environments, and each database is battle-tested in production.
The stack focuses on what matters most for each signal. VictoriaMetrics is optimized for time series workloads, while VictoriaLogs and VictoriaTraces are optimized for wide events (logs and traces). Separate storage backends keep each database simple, efficient, independent, and fine-tuned for its signal. No schema or index design is required: push the data and VictoriaStack takes care of the rest.
VictoriaStack accepts the most popular ingestion protocols :
- Metrics: OpenTelemetry, Prometheus Remote Write, InfluxDB line, Graphite, DataDog, OpenTSDB.
- Logs: OpenTelemetry, Elasticsearch bulk, Loki JSON, syslog, journald, DataDog.
- Traces: OpenTelemetry.
VictoriaMetrics serves a Prometheus-compatible API, and VictoriaTraces serves Jaeger- and Tempo-compatible APIs. Existing Grafana dashboards, alerting rules, and recording rules keep working if you switch to VictoriaStack.
The stack supports multitenancy, alerting, out-of-order backfilling, efficient compression, and sane defaults that simplify maintenance and scaling.
Choose VictoriaStack to own your observability and build a reliable, cost-efficient multitenant platform ready for future growth.
Features #
| Feature | Details |
|---|---|
| Full-stack observability | • Metrics via VictoriaMetrics • Logs via VictoriaLogs • Traces via VictoriaTraces • Designed to be operated as one stack |
| Apache-2.0 License | VictoriaMetrics , VictoriaLogs , VictoriaTraces |
| OpenTelemetry-native ingestion | •
Supports OTLP
for ingesting metrics, logs and traces • Integrates with OpenTelemetry Collector |
| Prometheus ecosystem compatibility | •
Compatibility with Prometheus read APIs • Compatibility with PromQL • Compatibility with service discovery and scraping configuration • Existing Prometheus exporters, Grafana dashboards, alerting and recording rules can be reused • Seamless migration from Prometheus Operator |
| Resource efficiency | • Lower CPU/RAM requirements and higher compression ratios compared to alternative stacks • Optimized for storage with high-latency I/O and low IOPS (HDDs and network storage in the cloud) |
| Simple operational model | • Lower number of moving parts compared to alternative stacks • No external dependencies for caches or databases • No schema or index design required |
| Scalability | •
Scales
vertically by adding more CPU/RAM/disk, scales horizontally with cluster deployment • Fits well in home labs and large production environments |
| High-cardinality telemetry | • VictoriaMetrics has
lower resource usage
for high-cardinality metrics compared to alternative solutions • VictoriaLogs and VictoriaTraces can efficiently handle high-cardinality fields such as trace_id, user_id, IP addresses, etc. |
| Powerful query languages | •
MetricsQL
for metrics is backward compatible with PromQL and additionally extends it with new functions and simplifications • LogsQL for logs supports full-text search, analytics, pattern extraction and query-time transformations |
| Unified alerting | •
evaluate alerting/recording rules
against VictoriaMetrics, VictoriaLogs and VictoriaTraces • integration with Alertmanager for notification dispatching |
| Multitenancy | Native support for multitenancy |
| AI/MCP integration | •
MCP servers
for VictoriaMetrics, VictoriaLogs, VictoriaTraces and vmanomaly • Agentic skills • AI observability |
| Enterprise-grade support | •
Long Term Support (LTS)
releases • Architectural guidance • Solution engineering • Anomaly Detection |
Architecture #
VictoriaStack runs the three databases as independent installations, with vmauth as a single entrypoint that routes and load balances requests:
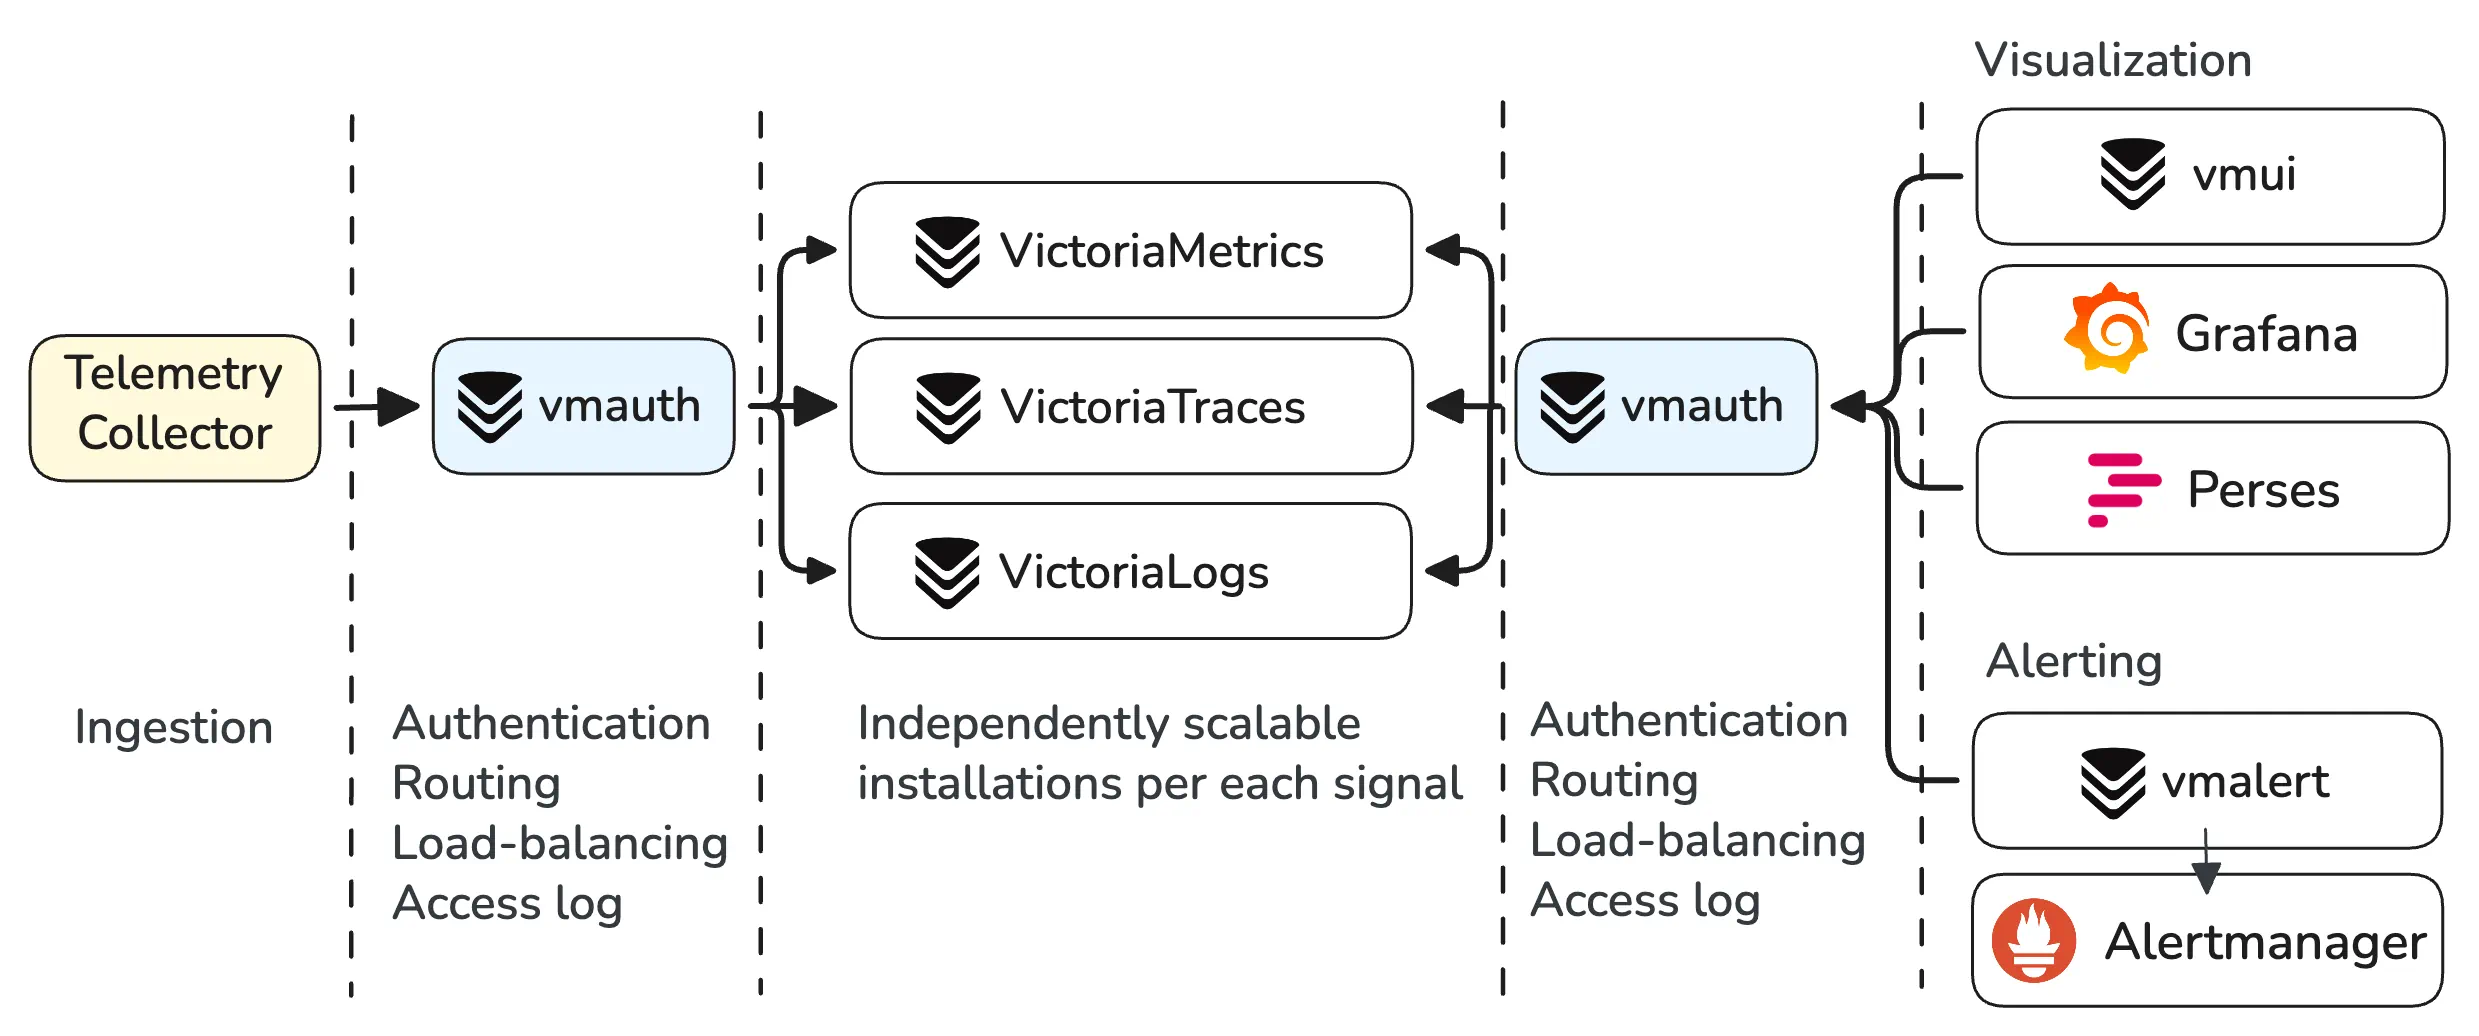
All three databases share the same component model. Each of them runs either as a single binary or as a cluster of three component types:
flowchart LR

    Sources["Telemetry"]

    Sources --> VI

    subgraph Victoria* Cluster

        subgraph Ingestion
            direction TB
            VI["insert × N"]
        end

        subgraph Storage
            direction TB
            VS["storage × M"]
        end

        subgraph Query
            direction TB
            VQ["select × K"]
        end

    end

    VI -->|"shard <br>among storages"| VS
    VS -->|"read <br>from storages"| VQ

    Clients["Grafana / VMUI"]

VQ --> Clients- stateless insert: processes incoming data and shards it among storages;
- stateful storage: efficiently stores and manages data;
- stateless select: processes incoming read queries and returns results.
insert and select components need to know only about storages. They don’t know about each other, and storages don’t know about inserts, selects, or other storages. This design allows flexible topologies with sub-clusters, where inserts or selects connect to all or to a subset of storages.
Cluster architecture doesn’t require any additional services: no extra caches, databases, or compactors. For stateless components we recommend vmauth as a load balancer , or any other load balancer of your choice.
What’s in the stack #
| What | How |
|---|---|
| Deployment | Kubernetes Operator , Helm charts , Binaries |
| Ingestion integrations | OpenTelemetry , Vector, Grafana Alloy, 10+ additional integrations |
| Native ingestion | High throughput, reliable on-disk buffering, replication, traffic compression via vmagent for metrics, vlagent for logs, vtagent for traces. |
| Access control | vmauth for user’s authentication , requests routing , per-tenant access . |
| Visualization | Grafana and Perses for unified observability and dashboarding. Built-in vmui for ad-hoc exploration. |
| Alerting | vmalert integrated with Alertmanager for rules evaluation and dispatching notifications |
| Anomaly detection | vmanomaly learns expected data behavior and writes a unified anomaly score to VictoriaMetrics for contextual alerting and investigation. |
| Extended support via Enterprise | Long Term Support(LTS) releases , consulting, architectural guidance, solutions engineering. |
Navigate documentation for available components using left navigation menu. Begin with Quick Start to begin using VictoriaStack.
Get help #
- Ask questions in the community Slack or Telegram . See the full list of channels .
- Report bugs and request features in GitHub issues: VictoriaMetrics , VictoriaLogs , VictoriaTraces . Found a problem on this page? Open an issue .
- For commercial support and enterprise features , contact info@victoriametrics.com .