VictoriaMetrics, VictoriaLogs, and VictoriaTraces components must run inside a protected trusted network. The databases don’t authenticate requests and don’t limit access to the stored data: every client that reaches them can read and write everything.
For internet-facing deployments, put vmauth or another authentication proxy in front of the databases:
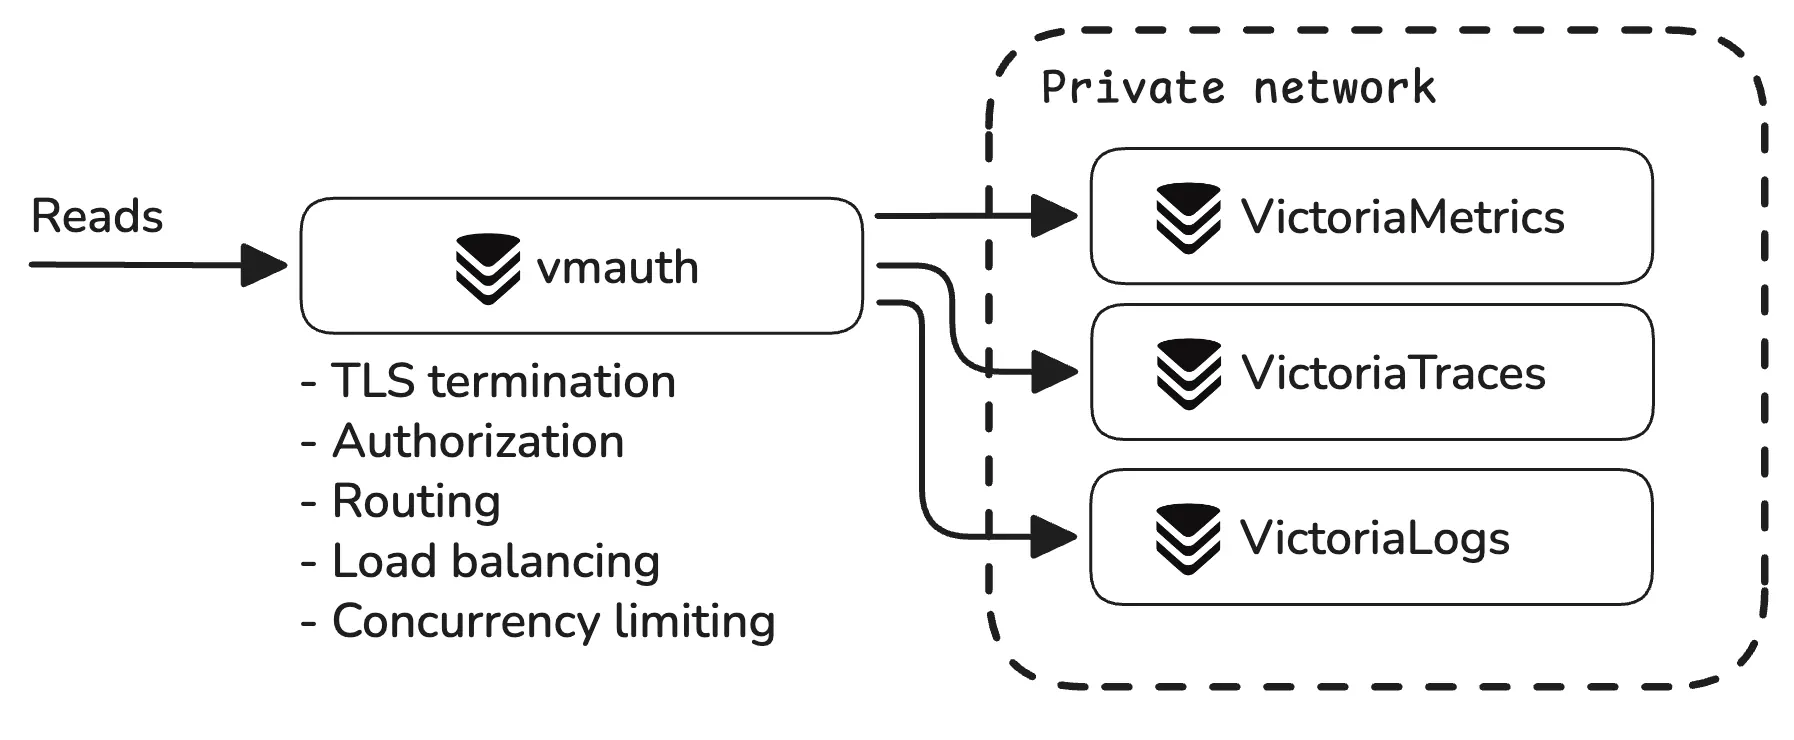
vmauth can perform the following actions:
- Requests authorization : Basic Auth, Bearer Token, JWT, etc.
- Single sign-on (SSO)
- Requests routing : by tenant, path, host, header, query args, etc.
- Load balancing
- TLS termination
- Access logging
- Automatic issuing of TLS certificates , mTLS protection and mTLS routing , IP filtering in the Enterprise version
The sections below cover the common setups: routing requests to the databases, authenticating users, giving every user its own tenant, and restricting the endpoints they can reach.
Routing and load balancing #
The following vmauth configuration acts as a router in front of VictoriaStack components:
      # unauthorized_user doesn't expect any credentials to be provided
unauthorized_user:
  url_map:
    - src_paths: [ "/metrics/.*" ]
      url_prefix: "http://victoriametrics:8428/"
      drop_src_path_prefix_parts: 1 # drops the /metrics prefix before forwarding the request

    - src_paths: [ "/logs/.*" ]
      url_prefix: "http://victorialogs:9428/"
      drop_src_path_prefix_parts: 1

    - src_paths: [ "/traces/.*" ]
      url_prefix: "http://victoriatraces:10428/"
      drop_src_path_prefix_parts: 1
With the configuration above, each service can be accessed via the vmauth endpoint using its own URL:
https://vmauth/metrics/...- to access VictoriaMetricshttps://vmauth/logs/...- to access VictoriaLogshttps://vmauth/traces/...- to access VictoriaTraces
A clustered installation runs several replicas of every component. List all of them in url_prefix, and vmauth spreads
the requests among the replicas with a least-loaded round-robin policy:
      unauthorized_user:
  url_map:
    - src_paths: [ "/metrics/select/.*" ]
      url_prefix:
        - "http://vmselect-1:8481/"
        - "http://vmselect-2:8481/"
      drop_src_path_prefix_parts: 1 # drops the /metrics prefix before forwarding the request
      retry_status_codes: [ 500, 502 ]
vmauth detects temporarily unavailable backends and spreads requests among the remaining ones, so replicas can be
restarted or upgraded without removing them from the config. With retry_status_codes it also retries the listed
responses on another backend.
In Kubernetes, requests sent to a Service are balanced per connection, not per request. Observability clients keep long-lived connections, so a few of them can pin most of the load to a couple of replicas while the rest stay idle. Route the traffic through vmauth instead and let it balance the requests, see Service discovery .
Service discovery #
In Kubernetes and other dynamic environments the replicas usually hide behind a service name, and their addresses change
as replicas come and go. A hostname in url_prefix gives vmauth one address, so the load isn’t spread among the replicas
behind it.
Set
discover_backend_ips
to make
vmauth resolve the hostname and balance requests among the discovered IPs:
      unauthorized_user:
  url_prefix: "http://vmselect-service:8481/"
  discover_backend_ips: true
The config then needs no updates when replicas are added, removed, or restarted. The option can be set per user, per
url_map entry, or globally with the -discoverBackendIPs command-line flag.
Discovering the addresses behind a service name is what makes vmauth balance better than k8s service : it sees every replica and picks the least loaded one for every request, instead of pinning a whole connection to whichever replica the service happened to choose.
When the backends listen on different ports, resolve them via
a
DNS SRV
record, which carries the ports along
with the hostnames. Prefix the hostname with srv+:
      unauthorized_user:
  url_prefix: "http://srv+vmselect/select/prometheus"
  discover_backend_ips: true
On its own, the srv+ prefix makes vmauth pick a random resolved address for every new connection. Together with
discover_backend_ips it balances the requests among all the addresses in the record.
Authentication #
The following vmauth configuration allows access to metrics and logs backends only to users with admin credentials:
      users:
  - username: admin
    password: "***"
    url_map:
      - src_paths: [ "/metrics/.*" ]
        url_prefix: "http://victoriametrics:8428/"
        drop_src_path_prefix_parts: 1 # drops the /metrics prefix before forwarding the request

      - src_paths: [ "/logs/.*" ]
        url_prefix: "http://victorialogs:9428/"
        drop_src_path_prefix_parts: 1
See advanced authorization examples via Headers, Bearer and JWT tokens or how to Setup multitenant access with Grafana & OIDC .
Multitenancy #
All three databases identify a
tenant
by the AccountID and
ProjectID HTTP headers. vmauth sets these headers per user, so the credentials decide to which tenant to route the requests:
      users:
  - username: team-dev
    password: "***"
    url_map:
      - src_paths: [ "/logs/.*" ]
        url_prefix: "http://victorialogs:9428/"
        drop_src_path_prefix_parts: 1 # drops the /logs prefix before forwarding the request
        headers:
          - "AccountID: 2"
          - "ProjectID: 4"

  - username: team-prod
    password: "***"
    url_map:
      - src_paths: [ "/logs/.*" ]
        url_prefix: "http://victorialogs:9428/"
        drop_src_path_prefix_parts: 1
        headers:
          - "AccountID: 1"
          - "ProjectID: 1"
      - src_paths: [ "/traces/.*" ]
        url_prefix: "http://victoriatraces:10428/"
        drop_src_path_prefix_parts: 1
        headers:
          - "AccountID: 1"
          - "ProjectID: 1"
In the configuration above:
- user
team-devcan access logs only from tenantAccountID: 2; ProjectID: 4 - user
team-prodcan access logs and traces only from tenantAccountID: 1; ProjectID: 1
Since tenant IDs are numeric, configuration like above shows how a string username maps to a numeric tenant.
See Multitenancy for the tenant model itself, and the per-tenant authorization docs for more vmauth examples.
Enforcing filters #
Tenants isolate whole datasets from each other. To limit what a user sees inside a single tenant, configure vmauth to enforce query filters to every proxied request. The database applies them to the query it receives, and the user cannot drop or override them.
For metrics,
extra_label
adds a label filter to every query:
      users:
  - username: team-dev
    password: "***"
    url_map:
      - src_paths: [ "/metrics/.*" ]
        url_prefix: "http://victoriametrics:8428/?extra_label=team=dev"
        drop_src_path_prefix_parts: 1
Queries from team-dev return only the series that carry the team="dev" label, whatever the user query is.
For logs,
extra_stream_filters
restricts the
log streams
a user can read:
      users:
  - username: frontend-logs-viewer
    password: "***"
    url_map:
      - src_paths: [ "/logs/select/.*" ]
        # the value is the percent-encoded LogsQL filter `_stream:{service=frontend}`
        url_prefix: "http://victorialogs:9428/?extra_stream_filters=_stream%3A%7Bservice%3Dfrontend%7D"
        drop_src_path_prefix_parts: 1
The extra_filters arg works the same way for any other LogsQL filter. For example,
?extra_filters=password:'' requires the password field to be empty or missing, which hides log entries where a
secret has leaked.
Endpoints filtering #
The src_paths in
vmauth config
can be further
modified to allow access only to specific paths:
        - src_paths:
      - "/metrics/api/v1/query"
      - "/metrics/api/v1/query_range"
      - "/metrics/api/v1/series"
      - "/metrics/api/v1/labels"
      - "/metrics/api/v1/label/.+/values"
    url_prefix: "http://victoriametrics:8428/"
    drop_src_path_prefix_parts: 1
With this configuration, authorized users can query metrics and use Grafana as usual, but they cannot ingest data or
access
sensitive endpoints
, like /api/v1/admin/tsdb/delete_series.
Access logs #
vmauth can log the requests it proxies, which answers who queried what and when. Enable access logs per user:
      # log all requests with missing or invalid credentials
unauthorized_user:
  access_log: {}

users:
  - username: team-prod
    password: "***"
    # log all requests of this user
    access_log:
      filters:
        # except requests with HTTP status codes below
        skip_status_codes: [200, 202]
    url_map:
    - src_paths: [ "/metrics/.*" ]
      url_prefix: "http://victoriametrics:8428/"
      drop_src_path_prefix_parts: 1
Access logs can be turned on and off per user with a config reload .
Sensitive endpoints #
VictoriaStack components, including vmauth, expose sensitive endpoints for config hot reloading, metrics scraping, profiling, etc. It is recommended to protect these endpoints from public or unauthorized access. Follow per-component recommendations below: