If you’re looking for a visual impression of the VictoriaStack, visit Playgrounds page and try publicly running installations of VictoriaMetrics, VictoriaLogs and VictoriaTraces fed with OpenTelemetry Astronomy Shop demo data.
You can deploy VictoriaStack as binaries on bare metal, as docker containers, or in Kubernetes via Helm charts and the operator. See the deployment docs for details.
The sections below deploy VictoriaStack with Docker Compose, the easiest way to run and experiment with it locally.
You will need Docker
with Compose v2
and git.
Single-node version #
The simplest setup runs VictoriaMetrics, VictoriaLogs, and VictoriaTraces as single-node deployments. Start it locally with the otel-single-node.yml Docker Compose file:
      git clone https://github.com/VictoriaMetrics/VictoriaStack.git && cd VictoriaStack
make otel-single-up
Note: this Docker Compose environment is simplified for demonstration purposes. It is not intended for production use.
The command starts:
- a minimized version of OpenTelemetry Demo with an OpenTelemetry collector;
- single-node VictoriaMetrics, VictoriaLogs, and VictoriaTraces for storing and querying signals;
- vmalert for evaluating alerting and recording rules;
- Grafana for visualizing signals;
- vmauth as a single entrypoint that authorizes and routes requests to the appropriate component.
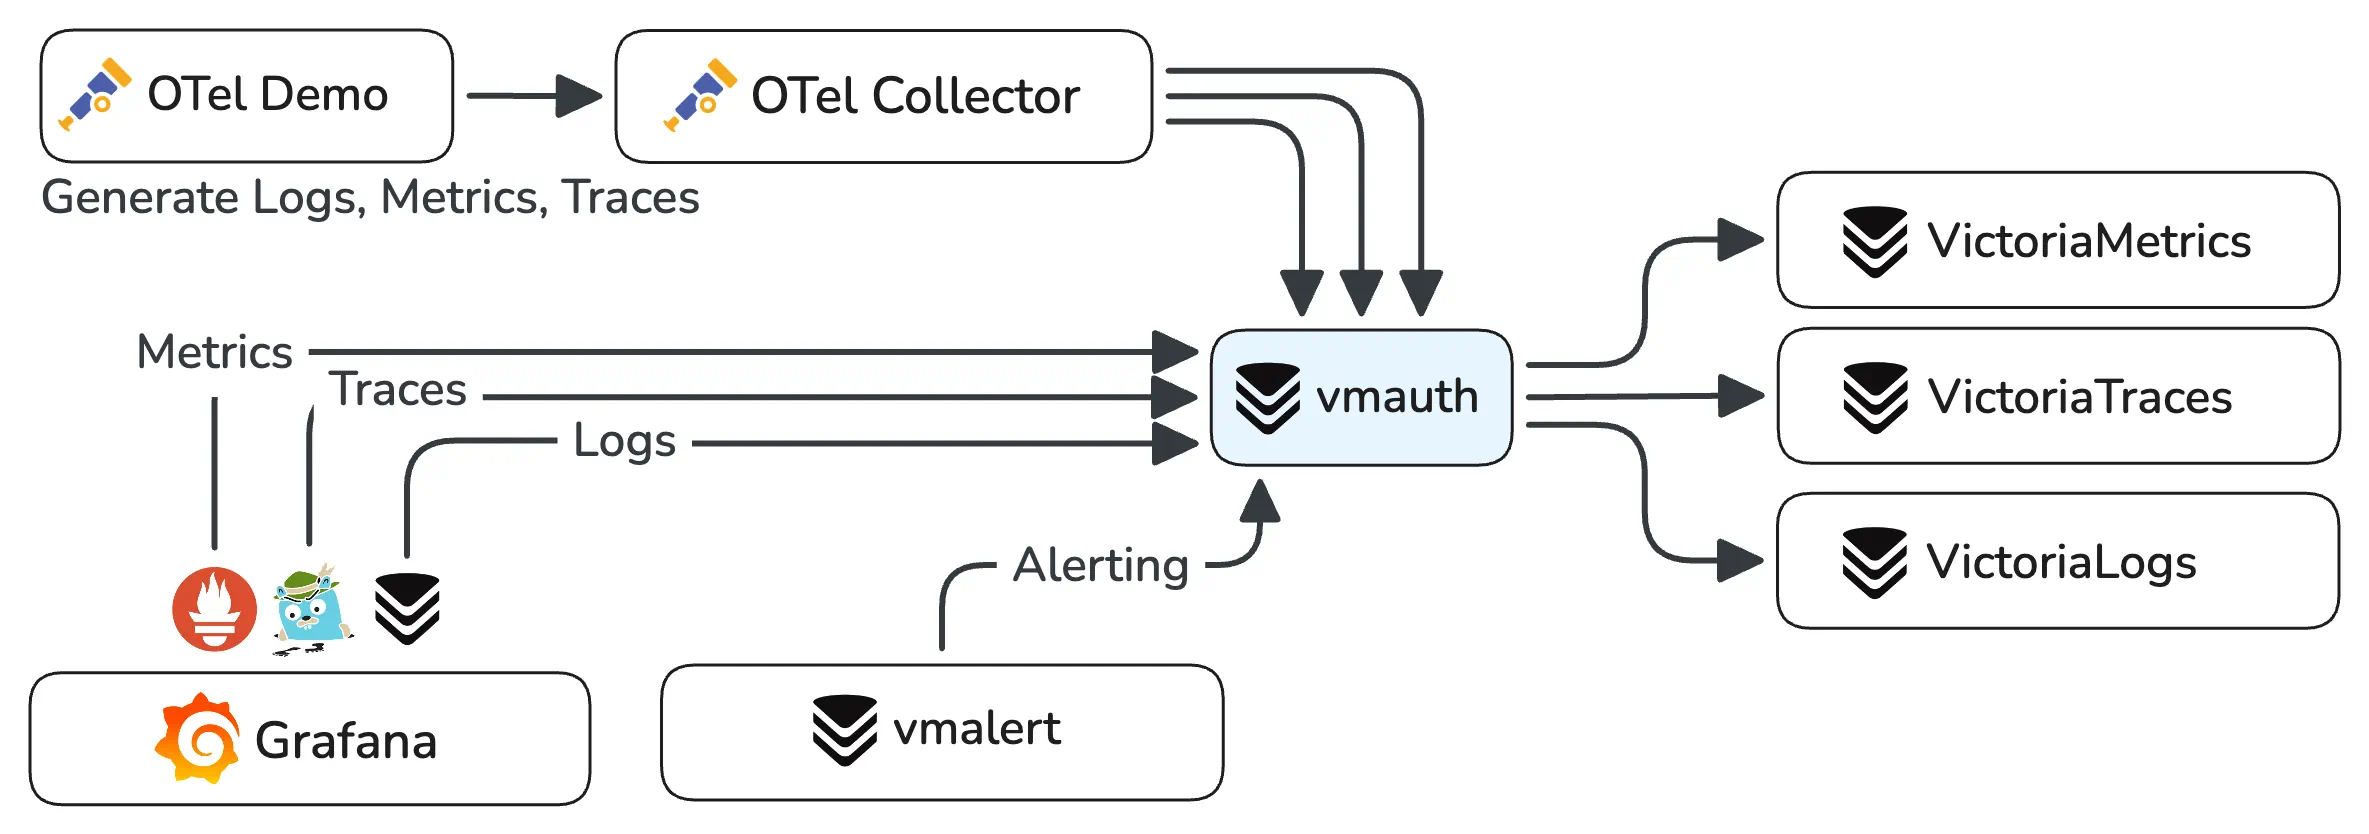
The OpenTelemetry demo will keep pushing telemetry signals to the stack through the OpenTelemetry collector, and vmalert will keep evaluating rules. To stop the stack, run:
make otel-single-down
The single-node version is the simplest way to start experimenting and to learn how the components fit together. To scale the stack horizontally, see the clustered version .
After the demo has been running for a few minutes, the links in the chapters below become available. If demo is failing, check how to get help .
VictoriaMetrics UI #
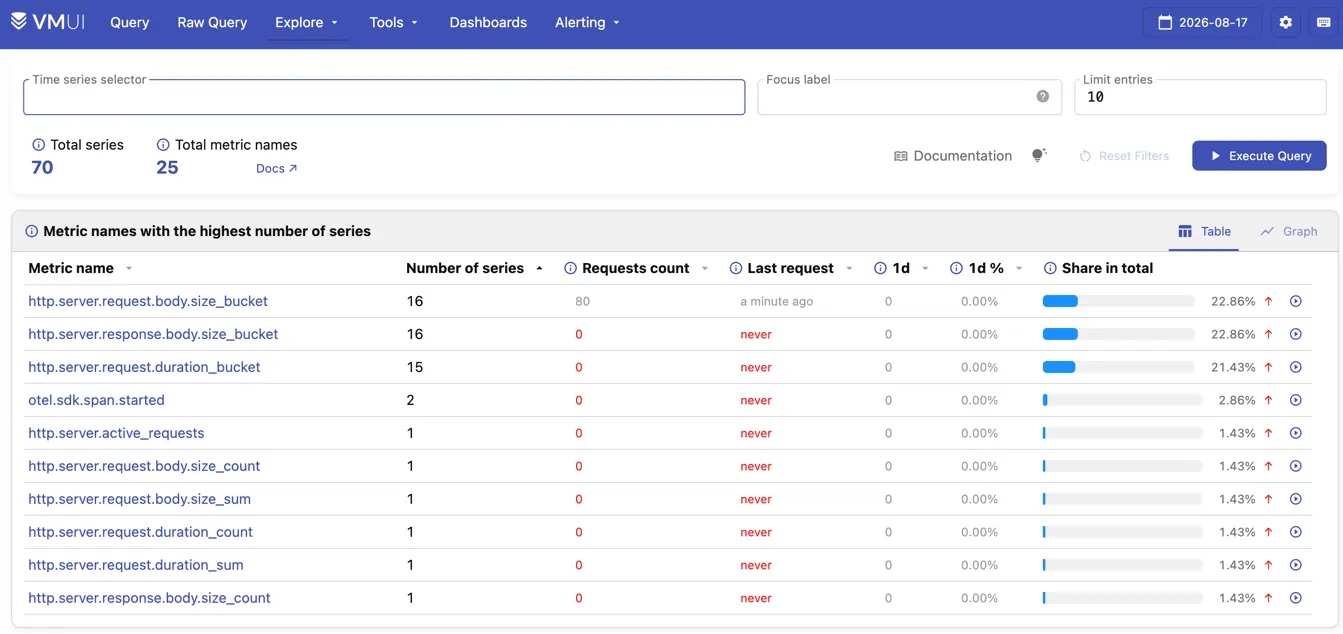
Visit VictoriaMetrics UI - http://localhost:8427/metrics/select/vmui
to explore the stored metrics or run a query to plot charts
:
VictoriaLogs UI #
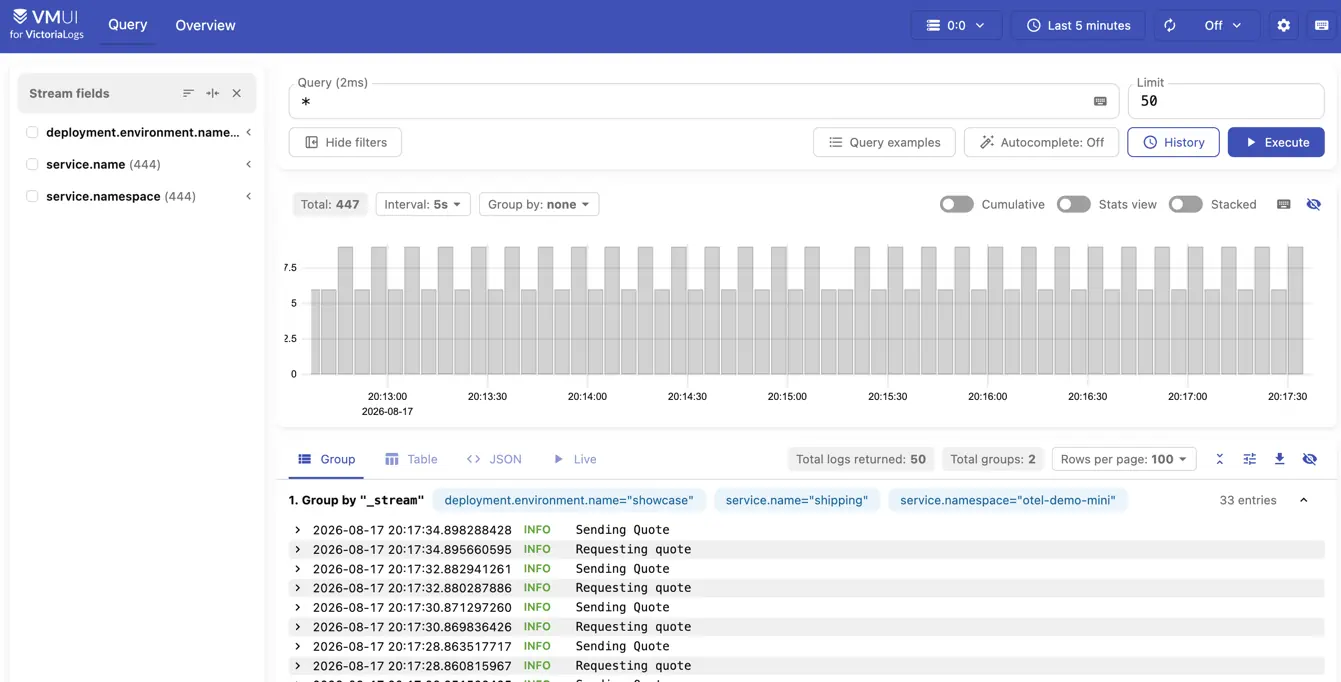
Visit VictoriaLogs UI - http://localhost:8427/logs/select/vmui
to see
recently ingested logs or run a query to plot charts
:
VictoriaTraces UI #
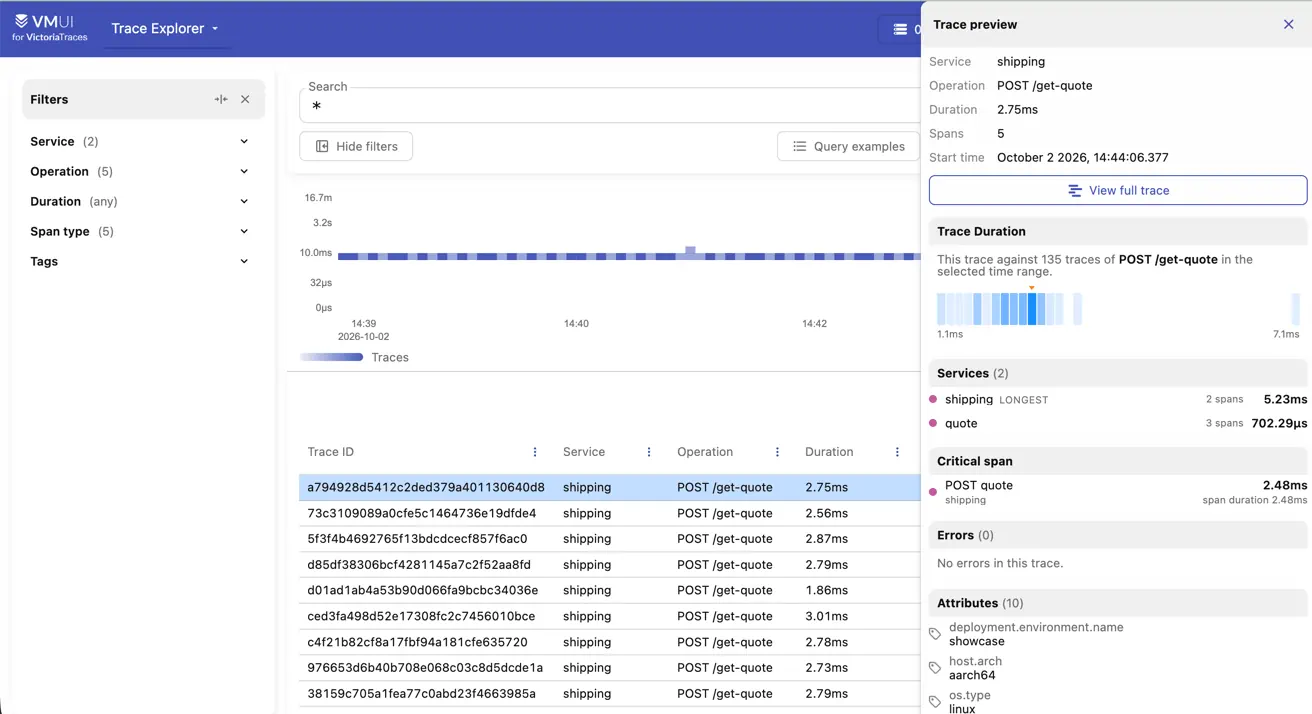
Visit VictoriaTraces UI - http://localhost:8427/traces/select/vmui
to see recent traces:
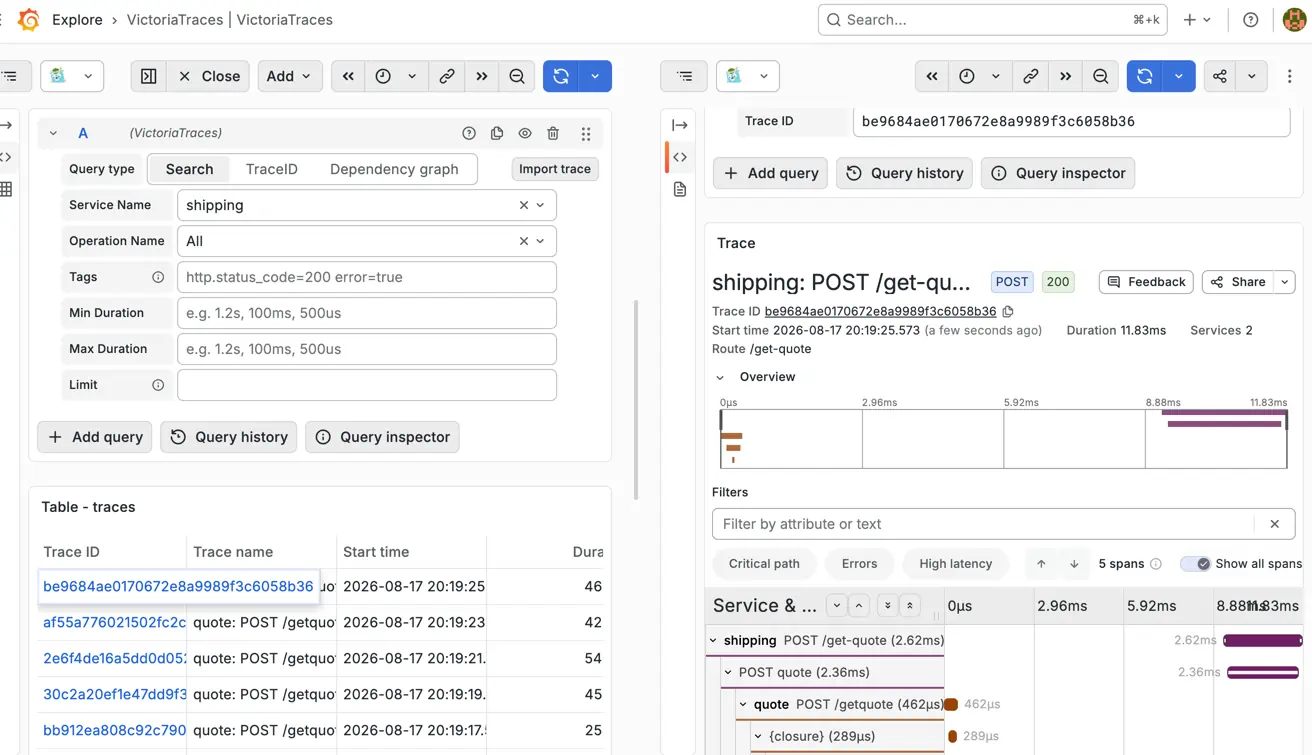
Or explore traces in Grafana’s Explore via Jaeger
or Tempo
(login with admin:admin):
Grafana #
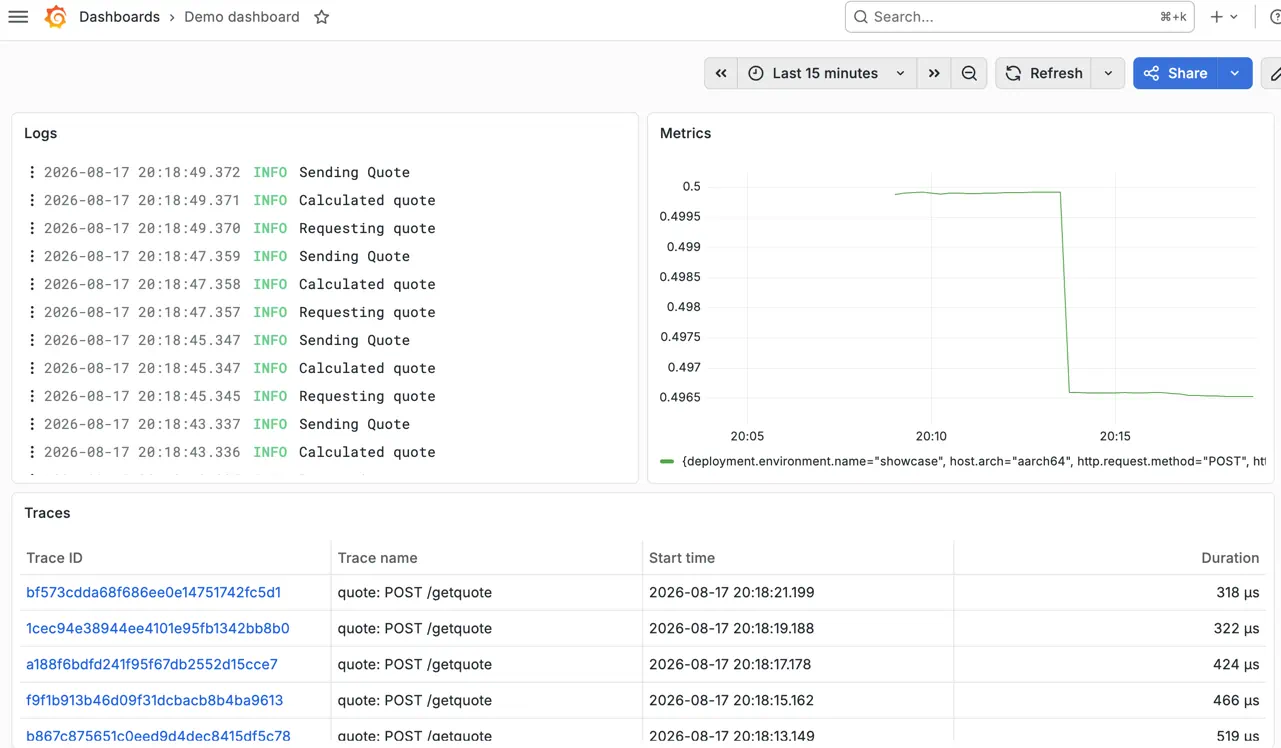
Visit Grafana - http://localhost:3000
with preconfigured datasources
and a simple demo dashboard (login with admin:admin):
Alerting UI #
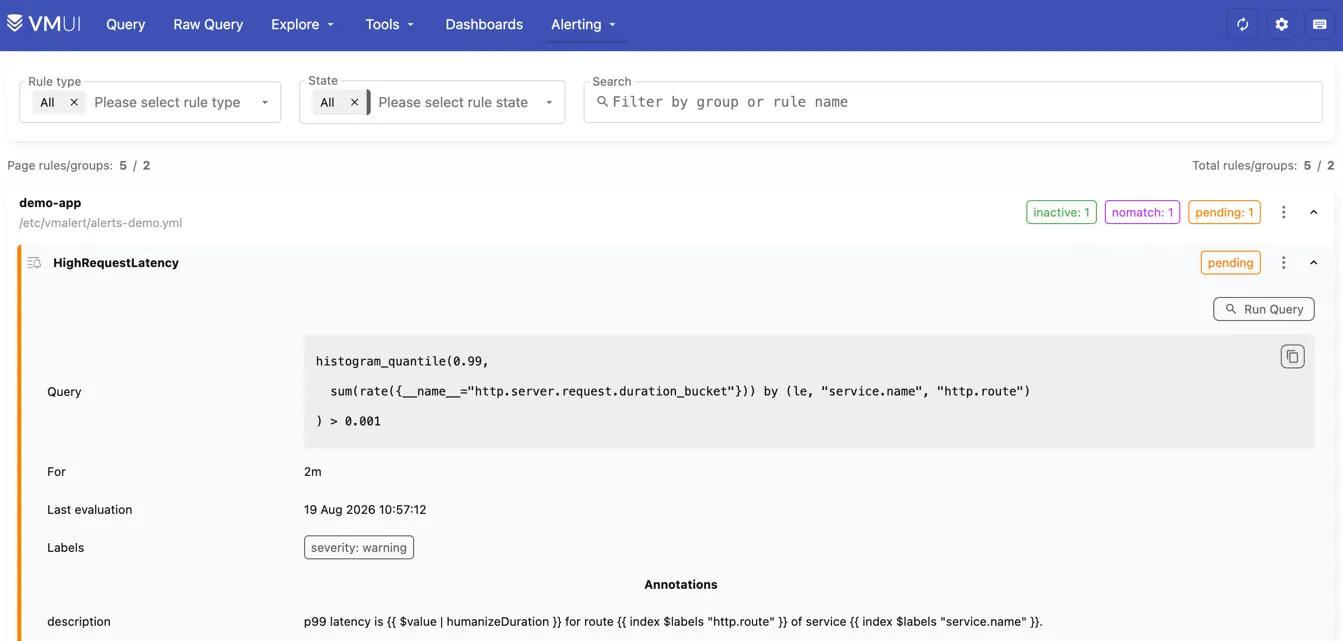
The demo will spawn two vmalert instances:
To run alerting rules alerts-demo.yml on metrics generated by OpenTelemetry demo and stored in VictoriaMetrics. Check rules state at VictoriaMetrics alerting UI or in Grafana alerting .
To run recording rules logs-to-metrics.yml converting logs from VictoriaLogs to metrics and writing them to VictoriaMetrics. Check results by querying service_name:logs_count:1m or severity_text:quotes_count:1m metric names in VictoriaMetrics UI.
Clustered version #
Run the stack locally with otel-cluster.yml Docker Compose file:
      git clone https://github.com/VictoriaMetrics/VictoriaStack.git && cd VictoriaStack
make otel-cluster-up
It runs the same setup as the single-node version , but each database runs as a cluster of three independently scalable components: insert, select, and storage. In this topology, vmauth also balances requests among insert and select components.
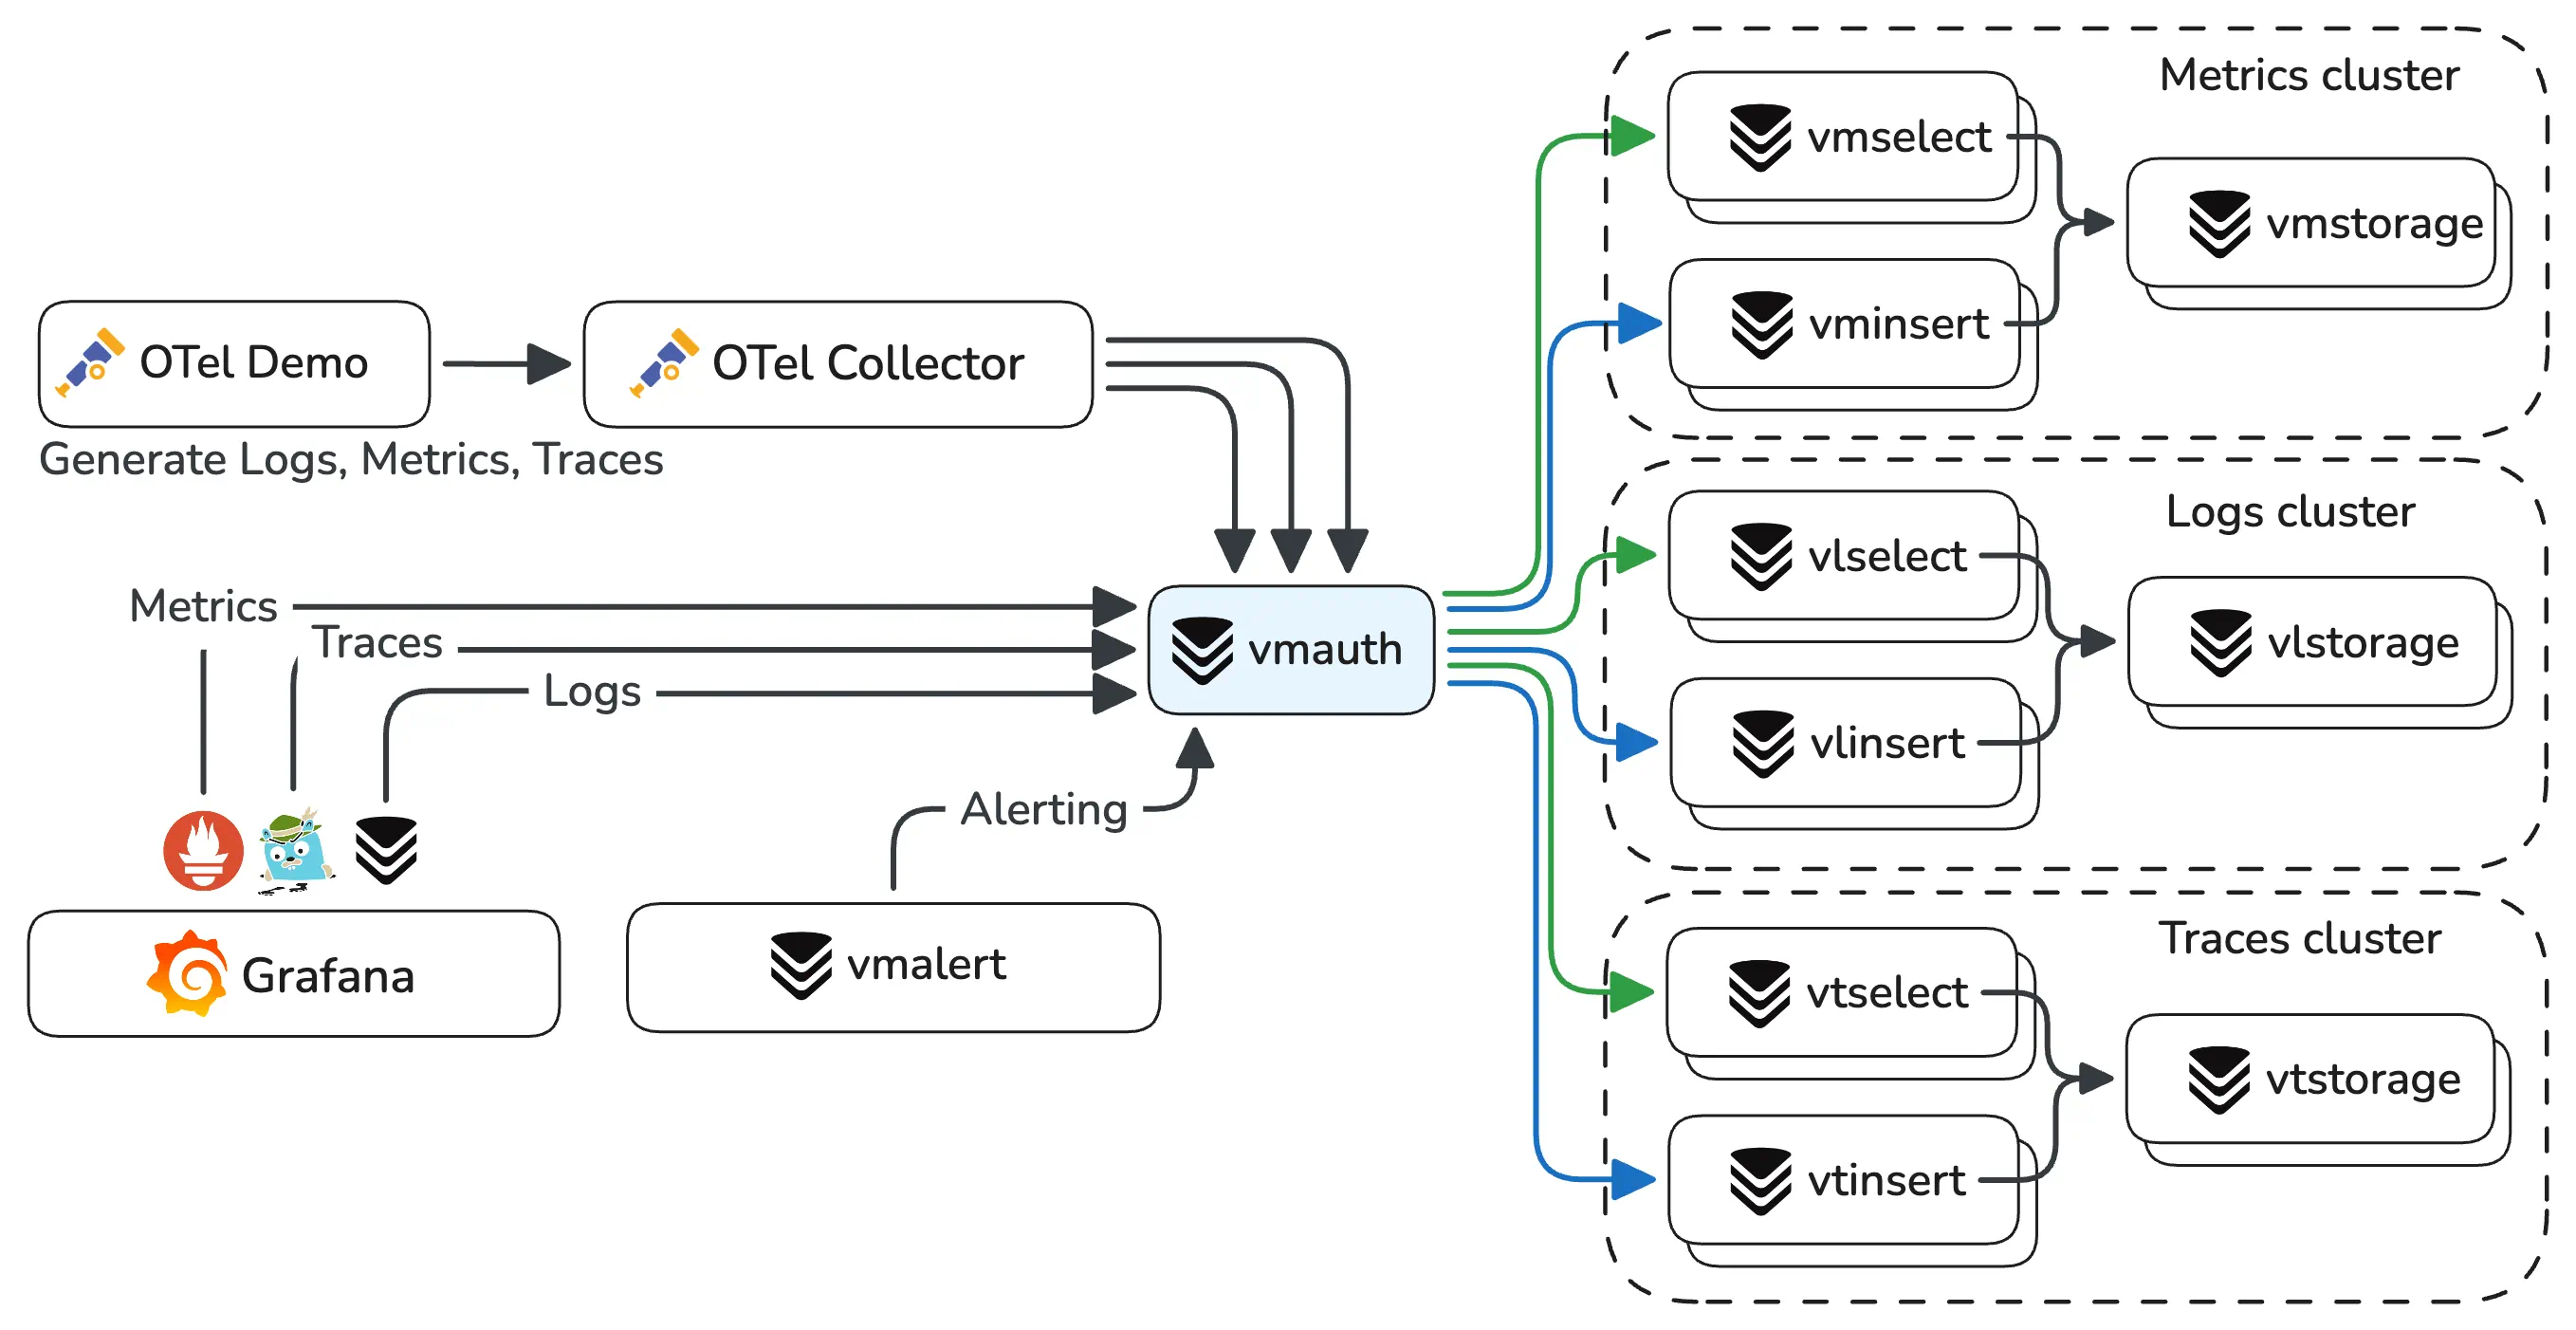
vmauth routes the requests, so the UI links stay the same as in the single-node version .
The generator keeps pushing telemetry signals to the stack through the OpenTelemetry collector, and vmalert keeps evaluating alerting rules. To stop the stack, run:
make otel-cluster-down
Scalability #
VictoriaMetrics, VictoriaLogs, and VictoriaTraces are highly scalable and simple to operate:
- one VictoriaMetrics cluster can handle thousands of tenants, billions of time series, millions of samples per second, thousands of read requests per second;
- one VictoriaLogs cluster can handle thousands of tenants, hundreds of terabytes of logs per day, thousands of read requests per second;
- one VictoriaTraces cluster can handle thousands of tenants, billions of spans per day.
inserts, selects and storages can be scaled independently:
- add more insert replicas to increase ingestion throughput;
- add more select replicas to increase query throughput;
- add more storage shards to increase overall performance and overcome hardware limits like CPU, memory, IO, or filesystem capacity.
Components insert and select are stateless and can be scaled in response to demand. The storage component is stateful and represents a storage shard. It is recommended carefully choosing the number of storage shards, as scaling down is a complex operation.
Retention and storage #
All three databases store data on the local filesystem and delete it automatically once it falls outside the configured retention:
| Database | Default retention | How to configure |
|---|---|---|
| VictoriaMetrics | 1 month | -retentionPeriod (1d, 10y) |
| VictoriaLogs | 7 days | -retentionPeriod (1d, 10y), or a disk limit via -retention.maxDiskSpaceUsageBytes, -retention.maxDiskUsagePercent |
| VictoriaTraces | 7 days | -retentionPeriod (1d, 10y), or a disk limit via -retention.maxDiskSpaceUsageBytes, -retention.maxDiskUsagePercent |
Disk usage depends on your data and on how well it compresses. Estimate it with the capacity planning docs for VictoriaMetrics and VictoriaLogs .
VictoriaStack has no object storage tiering: databases keep all data on local disks, and S3 or GCS is used for backups only. Support for historical data in object storage is in progress, see this issue .
To store metrics longer Enterprise adds downsampling and per-tenant retention filters .
Next steps #
The examples above run on generated telemetry. To build an installation of your own, go through the following steps:
- Choose deployment type : Kubernetes operator, Helm charts, or binaries.
- Ingest your own data : point the telemetry agents you already run at VictoriaStack, or use vmagent and vlagent for higher throughput and reliable delivery.
- Query it back : MetricsQL for metrics, LogsQL for logs and traces.
- Build dashboards : Grafana or Perses for dashboarding, vmui for ad-hoc exploration.
- Set up alerting : vmalert for rules evaluation, Alertmanager for notifications.
- Protect the installation : vmauth for authentication, request routing, and TLS termination.
- Separate data between tenants : one installation can serve thousands of isolated tenants.