VictoriaStack has no unified interface of its own that covers all three signals, but it is in-progress. For now, we recommend using Grafana : it connects to all three databases as datasources, so metrics, logs, and traces end up on the same dashboards and can be correlated with each other. Perses is an alternative visualization UI that can be used with VictoriaStack as well.
Every database also goes with a built-in UI called vmui . It is available out of the box and is great for ad-hoc data exploration, but it doesn’t allow building dashboards, correlating different signal types, or managing access.
| Grafana or Perses | vmui | |
|---|---|---|
| What it is for | dashboards and cross-signal investigations | ad-hoc exploration and troubleshooting of a single signal |
| Signals in one place | all three | each database has its own vmui for a specific signal |
| Setup | install and configure the datasources | none, it ships with the database |
| Dashboards | yes | no |
| Correlation between signals | yes | no |
Grafana #
Grafana connects to all three databases through datasource plugins:
- VictoriaMetrics via Prometheus or VictoriaMetrics datasource plugins.
- VictoriaLogs via VictoriaLogs datasource plugin .
- VictoriaTraces via Jaeger or Tempo datasource plugins.
See an example of provisioning Grafana with corresponding datasources:
      apiVersion: 1
datasources:
  - name: VictoriaMetrics
    type: prometheus
    url: http://vmstack:8427/metrics/select/prometheus/

  - name: VictoriaLogs
    type: victoriametrics-logs-datasource
    url: http://vmstack:8427/logs/

  - name: VictoriaTraces
    type: jaeger
    url: http://vmstack:8427/traces/select/jaeger/
See practical Grafana provisioning examples for VictoriaStack. The QuickStart runs Grafana with these datasources and a demo dashboard already provisioned.
With the datasources in place, Grafana covers everything a team does with the stack day to day: the query builders in the plugins provide a queryless experience for exploring every signal, dashboards and alerting views live in one place, and a single investigation can move between metrics, logs, and traces. For the query languages behind these interfaces, see Querying .
Perses #
Perses is a lightweight, Kubernetes-native dashboarding tool that keeps dashboards as code. Like Grafana, it integrates with VictoriaStack via datasource plugins:
- VictoriaMetrics integrates via Prometheus datasource plugin .
- VictoriaLogs integrates via VictoriaLogs datasource plugin .
- VictoriaTraces integrates via Jaeger or Tempo datasource plugins.
Perses covers dashboards, while cross-signal correlations functionality is more mature in Grafana so far.
Correlations #
Signals can be correlated when they share common attributes that identify the same system or event: a trace ID present in a log entry to correlate traces and logs, or the same service name present in all three signals to correlate all of them. Correlation is the reason to put all three databases into one UI, and Grafana is the recommended place for it thanks to its correlations and derived fields features.
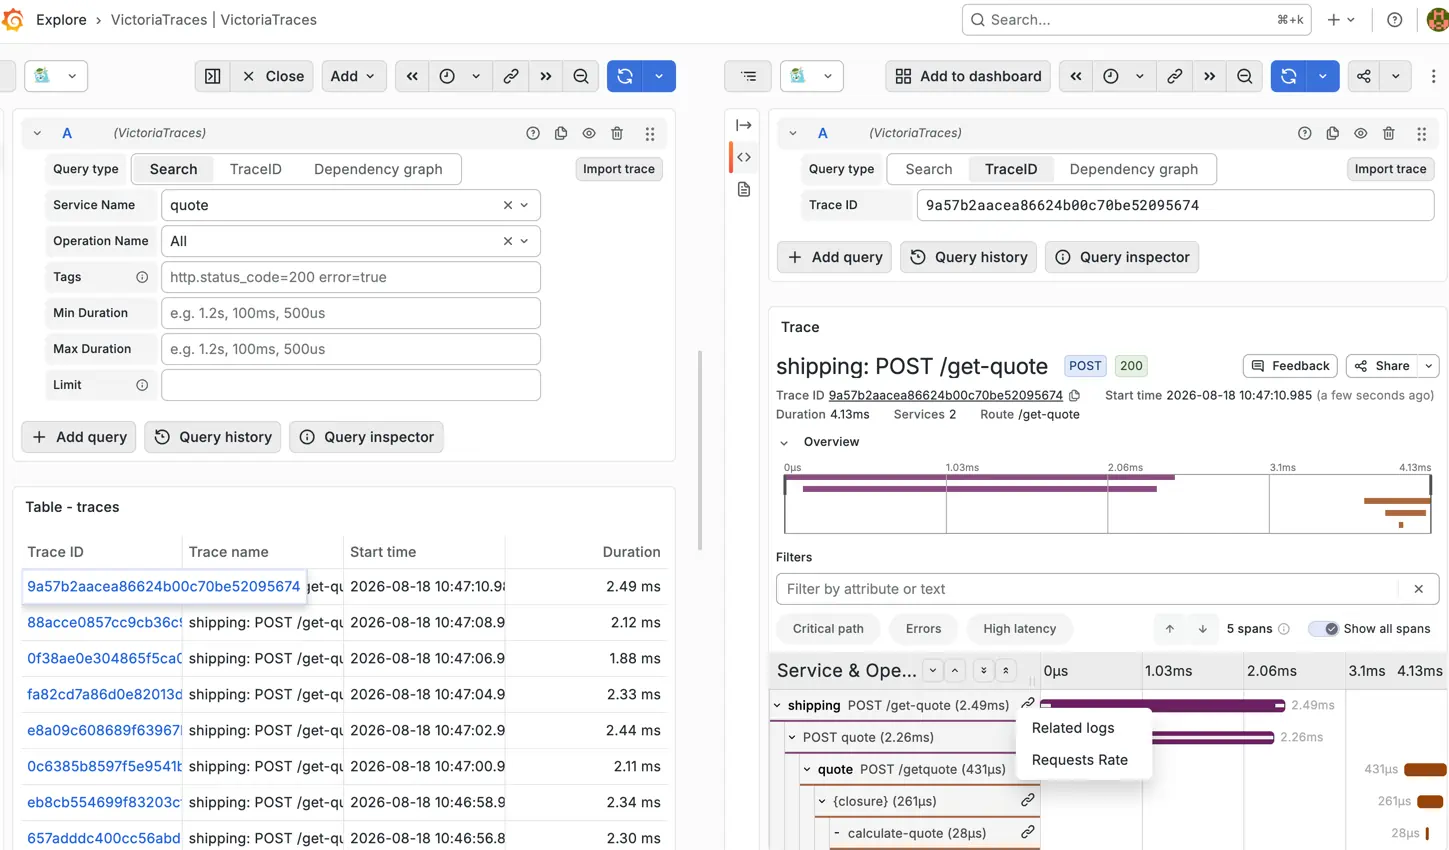
Depending on the Grafana datasource plugin, there could be multiple correlations available:
- Trace to logs, log to trace, log to metrics - see correlations via VictoriaLogs plugin .
- Trace to metrics, metric to logs, metric to traces - see correlations via VictoriaMetrics plugin . The Prometheus datasource also supports metric to logs and metric to traces correlations.
- Plugins Tempo, Jaeger, and Zipkin can correlate with logs or metrics using Trace to logs and Trace to metrics feature.
See examples of correlation settings configured for each datasource plugin in the VictoriaStack provisioning demo.
Logs and traces can also be turned into metrics with recording rules , which makes them available on the same dashboards and in the same queries as the rest of the metrics.
vmui #
vmui is the web interface built into the databases. It requires no setup and gives every signal a native UI for ad-hoc exploration, focused on the signal and use case specific to the signal:
- VictoriaMetrics UI : MetricsQL queries, metrics and cardinality explorers , top and active queries, query tracing, relabeling debugging.
- VictoriaLogs UI : LogsQL queries, streams and fields, live tailing, log context.
- VictoriaTraces UI : LogsQL queries, filtering and exploring traces.
Have a quick look at the vmui demo for VictoriaMetrics , VictoriaLogs and VictoriaTraces at our playgrounds.
vmui complements Grafana with tools specific to each signal. VictoriaMetrics vmui supports time series visualization, cardinality and metric usage analysis, expensive query analysis, and query performance tracing. VictoriaLogs vmui supports log exploration, analytics, and log context. VictoriaTraces vmui supports LogsQL queries and trace exploration.
vmanomaly UI #
The
vmanomaly UI
provides a vmui-like interface for exploring queries, comparing anomaly detection models, and backtesting configurations. Although vmanomaly is an Enterprise component, you can explore its UI in the public playground with Metrics
, Logs
, or Traces
data sources.