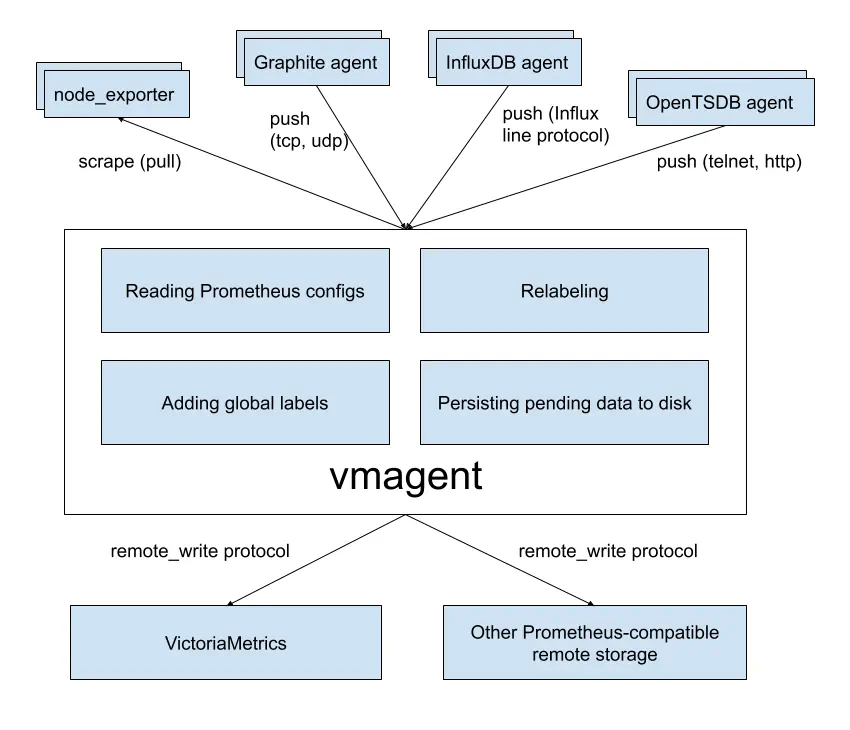
vmagent is a tiny agent that helps you collect metrics from various sources,
relabel and filter the collected metrics
and store them in VictoriaMetrics
or any other storage systems via the Prometheus remote_write protocol
or via the
VictoriaMetrics remote_write protocol
.
See Quick Start for details.
Motivation #
While VictoriaMetrics provides an efficient solution to store and observe metrics, our users needed something fast
and RAM-friendly to scrape metrics from Prometheus-compatible exporters into VictoriaMetrics.
Also, we found that our users’ infrastructure is like snowflakes in that no two are alike. Therefore, we decided to add more flexibility
to vmagent such as the ability to
accept metrics via popular push protocols
and to
discover Prometheus-compatible targets and scrape metrics from them
.
Features #
- Can be used as a drop-in replacement for Prometheus for discovering and scraping targets such as node_exporter
.
Note that single-node VictoriaMetrics can also discover and scrape Prometheus-compatible targets in the same way
vmagentdoes - see these docs . - Can add, remove, and modify labels (aka tags) via Prometheus relabeling and filter data before sending it to remote storage. See these docs for details.
- Can accept data via all the ingestion protocols supported by VictoriaMetrics. See these docs .
- Can aggregate incoming samples by time and by labels before sending them to remote storage. See these docs .
- Can replicate collected metrics simultaneously to multiple Prometheus-compatible remote storage systems . See these docs .
- Can save egress network bandwidth usage costs when VictoriaMetrics remote write protocol is used to send data to VictoriaMetrics.
- Works smoothly in environments with unstable connections to remote storage. If the remote storage is unavailable, the collected metrics
are buffered at
-remoteWrite.tmpDataPath. The buffered metrics are sent to remote storage as soon as the connection to the remote storage is repaired. The maximum disk usage for the buffer can be limited with-remoteWrite.maxDiskUsagePerURL. - Uses much lower amounts of RAM, CPU, disk IO, and network bandwidth than Prometheus. The RAM usage and CPU usage can be reduced further if needed according to these docs .
- Scrape targets can be spread among multiple
vmagentinstances when a large number of targets must be scraped. See these docs . - Can load scrape configs from multiple files. See these docs .
- Can efficiently scrape targets that expose millions of time series, such as the /federate endpoint in Prometheus . See these docs .
- Can deal with high cardinality and high churn rate issues by limiting the number of unique time series at scrape time and before sending them to remote storage systems. See these docs .
- Can write collected metrics to multiple tenants. See these docs .
- Can read and write data from / to Kafka. See these docs .
- Can read and write data from / to Google PubSub. See these docs .
Quick Start #
Download vmutils-* archive from releases page
(
vmagent is also available in Docker images Docker Hub
and Quay
),
unpack it, and pass the following flags to the vmagent binary in order to start scraping Prometheus-compatible targets
and sending the data to the Prometheus-compatible remote storage:
-promscrape.configwith the path to the Prometheus config file (usually located at/etc/prometheus/prometheus.yml). The path can point either to a local file or to an HTTP URL. See scrape config examples .vmagentdoesn’t support some sections of the Prometheus config file, so you may need either to delete these sections or to runvmagentwith-promscrape.config.strictParse=falsecommand-line flag. In this case,vmagentignores unsupported sections. See the list of unsupported sections .-remoteWrite.urlof a Prometheus-compatible remote storage endpoint (e.g., VictoriaMetrics) to send data to. The-remoteWrite.urlmay refer to a DNS SRV address. See these docs for details.
Example command for writing the data received via
supported push-based protocols
to
single-node VictoriaMetrics
located at victoria-metrics-host:8428:
/path/to/vmagent -remoteWrite.url=https://victoria-metrics-host:8428/api/v1/write
See these docs if you need to write data to a VictoriaMetrics cluster .
Example command for scraping Prometheus targets and writing the data to single-node VictoriaMetrics:
/path/to/vmagent -promscrape.config=/path/to/prometheus.yml -remoteWrite.url=https://victoria-metrics-host:8428/api/v1/write
See how to scrape Prometheus-compatible targets for more details.
If you use single-node VictoriaMetrics, then you can discover and scrape Prometheus-compatible targets directly from VictoriaMetrics
without the need to use vmagent . See
these docs
.
vmagent can reduce network bandwidth costs under high load when the
VictoriaMetrics remote write protocol is used
.
Common vmagent issues are covered in the
troubleshooting docs
.
See various use cases for vmagent.
Pass -help to vmagent in order to see
the full list of supported command-line flags with their descriptions
.
Use Cases #
IoT and Edge monitoring #
vmagent can run and collect metrics in IoT environments and industrial networks with unreliable or scheduled connections to remote storage.
It buffers the collected data in local files until the connection to remote storage becomes available and then sends the buffered
data to the remote storage. It retries sending the data to remote storage until errors are resolved.
The maximum on-disk size for the buffered metrics can be limited with -remoteWrite.maxDiskUsagePerURL.
vmagent supports several common architectures used in IoT environments: 32-bit ARM, 64-bit ARM, PPC64, 386, and AMD64.
vmagent can reduce network bandwidth costs by using the
VictoriaMetrics remote write protocol
.
See how to optimize index size at VictoriaMetrics for IoT and industrial monitoring .
Drop-in replacement for Prometheus #
If you use Prometheus only for scraping metrics from various targets and forwarding these metrics to remote storage,
then vmagent can replace Prometheus. Typically, vmagent requires less RAM, CPU, and network bandwidth than Prometheus.
See
these docs
for details.
Statsd alternative #
vmagent can be used as an alternative to StatsD
when
stream aggregation
is enabled.
See
these docs
for details.
Flexible metrics relay #
vmagent can accept metrics in
various popular data ingestion protocols
, apply
relabeling
to the accepted metrics (for example, change metric names/labels or drop unneeded metrics) and then forward the relabeled metrics
to other remote storage systems that support Prometheus remote_write protocol (including other vmagent instances).
Replication and high availability #
vmagent replicates the collected metrics among multiple remote storage instances configured via -remoteWrite.url args.
If a single remote storage instance is temporarily unavailable, the collected data remains available on the other remote storage instances.
vmagent buffers the collected data in files at -remoteWrite.tmpDataPath until the remote storage becomes available again.
Then it sends the buffered data to the remote storage in order to prevent data gaps.
VictoriaMetrics cluster
already supports replication,
so there is no need to specify multiple -remoteWrite.url flags when writing data to the same cluster.
See
these docs
.
Relabeling and filtering #
vmagent can add, remove, or update labels on the collected data before sending it to the remote storage.
It can filter scrape targets or remove unwanted samples via Prometheus-like relabeling.
Please see the
Relabeling cookbook
for details.
Sharding among remote storages #
By default, vmagent replicates data to remote storage systems via the -remoteWrite.url command-line flag.
If the -remoteWrite.shardByURL command-line flag is set, then vmagent spreads
the outgoing
time series
evenly among all the remote storage
systems listed in -remoteWrite.url.
It is possible to replicate samples among remote storage systems by passing -remoteWrite.shardByURLReplicas=N
to vmagent in addition to the -remoteWrite.shardByURL command-line flag.
This instructs vmagent to write every outgoing sample to N number of distinct remote storage systems listed in -remoteWrite.url
in addition to sharding.
Samples for the same time series are routed to the same remote storage system if the -remoteWrite.shardByURL flag is specified.
This allows building scalable data processing pipelines when a single remote storage cannot keep up with the data ingestion workload.
For example, this allows horizontal scaling with
stream aggregation
by routing outgoing samples for the same time series like
counter
and
histogram
types from top-level vmagent instances
to the same second-level vmagent instance, so they are aggregated properly.
If the -remoteWrite.shardByURL command-line flag is set, then all the metric labels are used for even sharding
among remote storage systems specified in -remoteWrite.url.
The -remoteWrite.shardByURL may not work as expected when
SRV URLs
are in use.
An SRV record might resolve to multiple addresses; one address is chosen randomly for all subsequent logic, including sharding. It will make sharding inconsistent. Samples from the same time series always go to the same remote write URL/SRV record, but they may reach different addresses at random due to DNS resolution.
For example, if you set -remoteWrite.url=srv+foo and it’s resolved to three addresses (192.168.1.1, 192.168.1.2, 192.168.1.3),
vmagent will only choose one randomly every time it (re-)creates the connection. In contrast, specifying the addresses manually (-remoteWrite.url=192.168.1.1 -remoteWrite.url=192.168.1.2 -remoteWrite.url=192.168.1.3) will shard samples across all three URLs.
Use -remoteWrite.shardByURL.labels to route metrics among -remoteWrite.url based on their label values.
For example, -remoteWrite.shardByURL.labels=instance,__name__ would shard metrics with the same name and instance
label to the same -remoteWrite.url. This command-line flag allows specifying a comma-separated list of labels.
Alternatively, you can use -remoteWrite.shardByURL.ignoreLabels to route metrics among -remoteWrite.url based on their label values, excluding the specified labels.
For example, -remoteWrite.shardByURL.ignoreLabels=pod would shard metrics metric{pod="foo"} and metric{pod="bar"} to the same -remoteWrite.url
by ignoring the pod label. This command-line flag allows specifying a comma-separated list of labels.
Command-line flags -remoteWrite.shardByURL.labels and -remoteWrite.shardByURL.ignoreLabels are mutually exclusive.
See also how to scrape a large number of targets .
Splitting data streams among multiple systems #
vmagent supports splitting the collected data between multiple destinations with the help of -remoteWrite.urlRelabelConfig,
it is applied independently for each configured -remoteWrite.url destination. For example, it is possible to replicate or split
data among long-term remote storage, short-term remote storage, and a real-time analytical system built on top of Kafka
.
Note that each destination can receive its own subset of the collected data due to per-destination relabeling via -remoteWrite.urlRelabelConfig.
For example, let’s assume that all the metrics scraped or received by vmagent have the label env with the value of dev or prod.
To route metrics with the label env=dev to dev and metrics with the label env=prod to prod apply the following config:
- Create a relabeling config file
relabelDev.ymlto drop all metrics that don’t have the labelenv=dev:
      - action: keep
  source_labels: [env]
  regex: "dev"
- Create a relabeling config file
relabelProd.ymlto drop all metrics that don’t have the labelenv=prod:
      - action: keep
  source_labels: [env]
  regex: "prod"
- Configure
vmagentwith 2-remoteWrite.urlflags pointing to destinationsdevandprodwith corresponding-remoteWrite.urlRelabelConfigconfig files:
      ./vmagent \
  -remoteWrite.url=http://<dev-url> -remoteWrite.urlRelabelConfig=relabelDev.yml \
  -remoteWrite.url=http://<prod-url> -remoteWrite.urlRelabelConfig=relabelProd.yml
With this configuration, vmagent will only forward metrics with the label env=dev to http://<dev-url> and
metrics with the label env=prod to http://<prod-url>.
Please note, the order of flags is important: the first -remoteWrite.urlRelabelConfig will be applied to the
first -remoteWrite.url, and so on.
Prometheus remote_write proxy #
vmagent can be used as a proxy for Prometheus data sent via Prometheus remote_write protocol. It can accept data via the remote_write API
at the/api/v1/write endpoint. It then applies relabeling and filtering; then proxies it to another remote_write system.
vmagent can also be configured to encrypt the incoming remote_write requests with -tls* command-line flags.
Basic Auth can be enabled for incoming remote_write requests using the -httpAuth.* command-line flags.
remote_write for clustered version #
While vmagent can accept data in several supported protocols (OpenTSDB, Influx, Prometheus, Graphite) and scrape data from various targets,
writes are always performed using the Prometheus remote_write protocol. Therefore, for the
clustered version
,
the -remoteWrite.url command-line flag should be configured as <schema>://<vminsert-host>:8480/insert/<accountID>/prometheus/api/v1/write
according to
these docs
.
There is also support for multitenant writes. See
these docs
.
Flexible deduplication #
Deduplication at stream aggregation allows setting up arbitrary complex deduplication schemes for the collected samples. Examples:
The following command instructs
vmagentto send only the last sample for each time series every 60 seconds:./vmagent -remoteWrite.url=http://remote-storage/api/v1/write -streamAggr.dedupInterval=60sThe following command instructs
vmagentto merge time series with differentreplicalabel values and then to send only the last sample for each merged series every 60 seconds:./vmagent -remoteWrite.url=http://remote-storage/api/v1/write -streamAggr.dropInputLabels=replica -streamAggr.dedupInterval=60s
Monitoring Data eXchange #
The Monitoring Data eXchange (MDX)
Available from v1.147.0
feature allows vmagent to forward only VictoriaMetrics metrics to selected -remoteWrite.url destinations while dropping metrics from non-VictoriaMetrics services.
To enable MDX, set -remoteWrite.mdx.enable=true for the target URL and -remoteWrite.mdx.enable=false for other URLs:
      ./vmagent \
  -remoteWrite.url=http://service-to-keep-all-metrics:8428/api/v1/write \
  -remoteWrite.mdx.enable=false \
  -remoteWrite.url=http://service-to-keep-only-vm-metrics:8428/api/v1/write \
  -remoteWrite.mdx.enable=true
When MDX is enabled for a -remoteWrite.url, vmagent forwards only metrics that:
- come from the target that exposes the
vm_app_versionmetric (emitted by all VictoriaMetrics components) - contain the
victoriametrics_app=truelabel, which will be added automatically to the metrics if the instance was deployed via VictoriaMetrics Operator .
victoriametrics_app=true label will be added to all metrics that are preserved by MDX if it’s absent.
- contain the label specified via
-mdx.label.
      ./vmagent \
  -remoteWrite.url=http://service-to-keep-only-vm-metrics:8428/api/v1/write \
  -remoteWrite.mdx.enable=true \
  -mdx.label="service=victoriametrics"
In this configuration, metrics with the label service=victoriametrics are preserved even if their scrape targets do not expose vm_app_version metric.
The number of VictoriaMetrics metrics preserved by MDX is exposed as vmagent_remotewrite_mdx_rows_preserved_total.
The scope of MDX is at the per-url level, so it works after global level mechanisms, such as stream aggregation, relabeling, complexity limiter, and cardinality limiter. See Life of a sample .
Life of a sample #
vmagent supports limiting, relabeling, deduplication, and stream aggregation for all metric samples, scraped or pushed.
The received data is then forwarded to the specified -remoteWrite.url destinations. The pipeline is as follows:
%%{init: { "themeCSS": ".nodeLabel, .edgeLabel { white-space: nowrap; word-break: normal; overflow-wrap: normal; }" }}%%
flowchart TB
    A[Pushed or Scraped samples] --> B[Ingestion rate limiting<br><b>-maxIngestionRate</b>]
    B --> C[Global <a href="https://docs.victoriametrics.com/victoriametrics/relabeling/">relabeling</a><br><b>-remoteWrite.relabelConfig</b>]
    C --> D[complexity limiting<br><b>-maxLabelsPerTimeseries</b><br><b>-maxLabelNameLen</b><br><b>-maxLabelValueLen</b>]
    D --> E[<a href="https://docs.victoriametrics.com/victoriametrics/vmagent/#cardinality-limiter">cardinality limiting</a><br><b>-remoteWrite.maxHourlySeries</b><br><b>-remoteWrite.maxDailySeries</b>]
    E --> F[Global <a href="https://docs.victoriametrics.com/victoriametrics/stream-aggregation">aggregation</a><br><b>-streamAggr.config</b><br><b>-streamAggr.dedupInterval</b>]
    F --> G[<a href="https://docs.victoriametrics.com/victoriametrics/vmagent/#replication-and-high-availability">replicate</a> to each <b>-remoteWrite.url</b><br/>or <a href="https://docs.victoriametrics.com/victoriametrics/vmagent/#sharding-among-remote-storages">shard</a> if <b>-remoteWrite.shardByURL</b> is set]

      %% Left branch
      G --> H1[per-url <a href="https://docs.victoriametrics.com/victoriametrics/vmagent/#monitoring-data-exchange/">mdx filter</a><br><b>-remoteWrite.mdx.enable</b>]
      H1 --> H2[per-url <a href="https://docs.victoriametrics.com/victoriametrics/relabeling/">relabeling</a><br><b>-remoteWrite.urlRelabelConfig</b>]
      H2 --> H3[per-url <a href="https://docs.victoriametrics.com/victoriametrics/stream-aggregation">aggregation</a><br><b>-remoteWrite.streamAggr.config</b><br><b>-remoteWrite.streamAggr.dedupInterval</b>]
      H3 --> H4["per-url <a href="https://docs.victoriametrics.com/victoriametrics/vmagent/#calculating-disk-space-for-persistence-queue">queue</a> (default: enabled)<br><b>-remoteWrite.disableOnDiskQueue</b>"]
      H4 --> H5[<a href="https://docs.victoriametrics.com/victoriametrics/vmagent/#adding-labels-to-metrics">add extra labels</a><br><b>-remoteWrite.label</b>]
      H5 --> H6[[push to <b>-remoteWrite.url</b>]]

      %% Right branch
      G --> R1[per-url <a href="https://docs.victoriametrics.com/victoriametrics/vmagent/#monitoring-data-exchange">mdx filter</a><br><b>-remoteWrite.mdx.enable</b>]
      R1 --> R2[per-url <a href="https://docs.victoriametrics.com/victoriametrics/relabeling/">relabeling</a><br><b>-remoteWrite.urlRelabelConfig</b>]
      R2 --> R3[per-url <a href="https://docs.victoriametrics.com/victoriametrics/stream-aggregation">aggregation</a><br><b>-remoteWrite.streamAggr.config</b><br><b>-remoteWrite.streamAggr.dedupInterval</b>]
      R3 --> R4["per-url <a href="https://docs.victoriametrics.com/victoriametrics/vmagent/#calculating-disk-space-for-persistence-queue">queue</a> (default: enabled)<br><b>-remoteWrite.disableOnDiskQueue</b>"]
      R4 --> R5[<a href="https://docs.victoriametrics.com/victoriametrics/vmagent/#adding-labels-to-metrics">add extra labels</a><br><b>-remoteWrite.label</b>]
      R5 --> R6[[push to <b>-remoteWrite.url</b>]]
Scraping has additional settings that can be applied before samples are pushed to the processing pipeline above:
- Service Discovery relabeling
- Scraping relabeling
sample_limit,series_limit,label_limitin scrape_configs .
How to push data to vmagent #
vmagent supports
the same set of push-based data ingestion protocols as VictoriaMetrics does
in addition to the pull-based Prometheus-compatible targets’ scraping:
- Datadog “submit metrics” API. See these docs .
- InfluxDB line protocol via
http://<vmagent>:8429/write. See these docs . - Graphite plaintext protocol if the
-graphiteListenAddrcommand-line flag is set. See these docs . - OpenTelemetry HTTP API via
http://<vmagent>:8429/opentelemetry/v1/metrics. See these docs . - New Relic API. See these docs .
- OpenTSDB telnet and http protocols if
-opentsdbListenAddrcommand-line flag is set. See these docs . - Zabbix Connector streaming protocol. See these docs .
- Prometheus remote write protocol via
http://<vmagent>:8429/api/v1/write. - JSON lines import protocol via
http://<vmagent>:8429/api/v1/import. See these docs . - Native data import protocol via
http://<vmagent>:8429/api/v1/import/native. See these docs . - Prometheus exposition format via
http://<vmagent>:8429/api/v1/import/prometheus. See these docs for details. - Arbitrary CSV data via
http://<vmagent>:8429/api/v1/import/csv. See these docs .
How to collect metrics in Prometheus format #
Specify the path to the prometheus.yml file via the -promscrape.config command-line flag. vmagent takes into account the following
sections from Prometheus config file
:
globalscrape_configs
All other sections are ignored, including the remote_write
section.
Use the -remoteWrite.* command-line flag instead for configuring remote write settings. See
the list of unsupported config sections
.
The file pointed to by -promscrape.config may contain %{ENV_VAR} placeholders that are substituted by the corresponding ENV_VAR environment variable values.
See also:
scrape_config enhancements #
vmagent supports the following additional options in
scrape_configs
section:
headers- a list of HTTP headers to send to a scrape target with each scrape request. This can be used when the scrape target needs custom authorization and authentication. For example:
      scrape_configs:
- job_name: custom_headers
  headers:
  - "TenantID: abc"
  - "My-Auth: TopSecret"
disable_compression: truefor disabling response compression on a per-job basis. By default,vmagentrequests compressed responses from scrape targets to save network bandwidth.disable_keepalive: truefor disabling HTTP keep-alive connections on a per-job basis. By default, vmagent uses keep-alive connections when scraping targets. This reduces overhead by eliminating the need to repeatedly reestablish connections.series_limit: Nfor limiting the number of unique time series a single scrape target can expose. See these docs .stream_parse: truefor scraping targets in a streaming manner. This may be useful when targets export a large number of metrics. See these docs .scrape_align_interval: durationfor aligning scrapes to the given interval instead of using a random offset in the range[0 ... scrape_interval]for scraping each target. The random offset helps to spread scrapes evenly in time.scrape_offset: durationfor specifying the exact offset for scraping instead of using a random offset in the range[0 ... scrape_interval].
See scrape_configs docs for more details on all the supported options.
Loading scrape configs from multiple files #
vmagent supports loading
scrape configs
from multiple files specified
in the scrape_config_files section of the -promscrape.config file. For example, the following -promscrape.config instructs vmagent
to load scrape configs from all the *.yml files under the configs directory, from the local file single_scrape_config.yml
and from the URL https://config-server/scrape_config.yml:
      scrape_config_files:
- configs/*.yml
- single_scrape_config.yml
- https://config-server/scrape_config.yml
Every referred file can contain an arbitrary number of
supported scrape configs
.
There is no need to specify a top-level scrape_configs section in these files. For example:
      - job_name: foo
  static_configs:
  - targets: ["vmagent:8429"]
- job_name: bar
  kubernetes_sd_configs:
  - role: pod
vmagent can dynamically reload these files, see
these docs
.
Unsupported Prometheus config sections #
vmagent doesn’t support the following sections in the Prometheus config file passed with the -promscrape.config command-line flag:
- remote_write
. This section is substituted
with various
-remoteWrite*command-line flags. See the full list of flags . Theremote_writesection isn’t supported in order to reduce possible confusion whenvmagentis used for accepting incoming metrics via supported push protocols . In this case, the-promscrape.configfile isn’t needed. remote_read. This section isn’t supported at all, sincevmagentdoesn’t provide the Prometheus querying API. Use the querying API on your-remoteWrite.urltarget instead, such as VictoriaMetrics. See Prometheus querying API docs for VictoriaMetrics .rule_filesandalerting. These sections are supported by vmalert .
The list of supported service discovery types is available in how-to-collect-metrics-in-prometheus-format .
Additionally, vmagent doesn’t support the refresh_interval option in the service discovery sections.
This option is replaced by the -promscrape.*CheckInterval command-line flags, which are specific to each service discovery type.
See
the full list of command-line flags for vmagent
.
Configuration update #
vmagent should be restarted in order to update config options set via command-line arguments.
vmagent supports multiple approaches for reloading configs from updated config files, such as
-promscrape.config, -remoteWrite.relabelConfig, -remoteWrite.urlRelabelConfig, -streamAggr.config
and -remoteWrite.streamAggr.config:
Sending
SIGHUPsignal tovmagentprocess:kill -SIGHUP `pidof vmagent`Sending HTTP request to
http://vmagent:8429/-/reloadendpoint. This endpoint can be protected with the-reloadAuthKeycommand-line flag.
There is also the -promscrape.configCheckInterval command-line flag, which can be used to automatically reload configs from the updated -promscrape.config file.
DNS URLs #
If vmagent encounters URLs with the dns+ prefix in the hostname (such as http://dns+some-addr:8428/some/path), it resolves some-addr into IP addresses
via DNS A records
. The port from the original URL is appended to each discovered IP address.
Each discovered IP address is used for least-loaded balancing of write requests.
DNS URLs are supported in the following places:
- In
-remoteWrite.urlcommand-line flag. For example, ifvictoria-metricsDNS A Record record contains192.168.1.15IP address, then-remoteWrite.url=http://dns+victoria-metrics:8428/api/v1/writeis automatically resolved into-remoteWrite.url=http://192.168.1.15:8428/api/v1/write.
DNS URLs are useful when client-side HTTP load balancing is needed. A good example is a Kubernetes headless Service , which returns multiple IP addresses for a single hostname.
DNS URLs and HTTPS #
When a dns+ URL uses the https scheme, vmagent connects to the discovered
IP addresses directly. This affects TLS
in two ways:
- No SNI is sent in the TLS handshake, since the connection target is an IP address rather than a hostname.
- The server certificate is verified against the IP address, so the verification fails unless the certificate contains the corresponding IP SAN entries.
To use dns+ URLs with HTTPS, pass the original hostname via the -remoteWrite.tlsServerName
command-line flag. It is used both as SNI and as the name the server certificate
is verified against:
      -remoteWrite.url=https://dns+victoria-metrics:8428/api/v1/write
-remoteWrite.tlsServerName=victoria-metrics
SRV URLs #
If vmagent encounters URLs with srv+ prefix in hostname (such as http://srv+some-addr/some/path), then it resolves some-addr DNS SRV
record into TCP address with hostname and TCP port, and then use the resulting URL when it needs to connect to it.
SRV URLs are supported in the following places:
In
-remoteWrite.urlcommand-line flag. For example, ifvictoria-metricsDNS SRV record containsvictoria-metrics-host:8428TCP address, then-remoteWrite.url=http://srv+victoria-metrics/api/v1/writeis automatically resolved into-remoteWrite.url=http://victoria-metrics-host:8428/api/v1/write. If the DNS SRV record is resolved into multiple TCP addresses, thenvmagentperforms per request least-loaded load-balancing.In scrape target addresses aka
__address__label. See these docs for details.In URLs used for service discovery .
SRV URLs are useful when HTTP services run on different TCP ports or when their TCP ports can change over time (for instance, after a restart).
VictoriaMetrics remote write protocol #
vmagent supports sending data to the configured -remoteWrite.url either via the Prometheus or VictoriaMetrics remote write protocols.
When comparing the remote protocols between VictoriaMetrics and Prometheus, VictoriaMetrics provides the following benefits:
Reduced network bandwidth usage by 2x-5x. This allows saving network bandwidth usage costs when
vmagentand the configured remote storage systems are located in different datacenters, availability zones, or regions.Reduced disk read/write IO and disk space usage at
vmagentwhen the remote storage is temporarily unavailable. In this case,vmagentbuffers incoming data to disk using the VictoriaMetrics remote write format. This reduces disk read/write IO and disk space usage by 2x-5x compared to the Prometheus remote write format.
vmagent uses VictoriaMetrics remote write protocol by default
Available from v1.116.0
when it sends data to VictoriaMetrics components such as other vmagent instances,
single-node VictoriaMetrics
or vminsert at
cluster version
. If needed, it can automatically downgrade to a Prometheus protocol at runtime.
It is possible to force switch to VictoriaMetrics remote write protocol by specifying -remoteWrite.forceVMProto
command-line flag for the corresponding -remoteWrite.url.
It is possible to tune the compression level for VictoriaMetrics remote write protocol with the -remoteWrite.vmProtoCompressLevel command-line flag.
Bigger values reduce network usage at the cost of higher CPU usage. Negative values reduce CPU usage but increase network usage.
The default value for the compression level is 0, the minimum value is -22, and the maximum value is 22. The default value works optimally
in most cases, so it isn’t recommended to change it.
vmagent automatically switches to the Prometheus remote write protocol when it sends data to old versions of VictoriaMetrics components
or to other Prometheus-compatible remote storage systems. It is possible to force switch to Prometheus remote write protocol
by specifying -remoteWrite.forcePromProto command-line flag for the corresponding -remoteWrite.url.
Multitenancy #
By default, vmagent collects the data without
tenant
identifiers
and routes it to the remote storage specified via -remoteWrite.url command-line flag. Point -remoteWrite.url to vminsert’s /insert/<tenant_id>/prometheus/api/v1/write path
according to
these docs
.
Note: the single-node version of VictoriaMetrics doesn’t support multitenancy.
flowchart LR
    A["requests_total{instance=foo}"] --> |<a href="https://docs.victoriametrics.com/victoriametrics/vmagent/#how-to-push-data-to-vmagent">push</a>| V[vmagent]
    B["requests_total{instance=bar}"] <--> |<a href="https://docs.victoriametrics.com/victoriametrics/vmagent/#how-to-collect-metrics-in-prometheus-format">pull</a>| V
    V --> |"/insert/#60;tenant_id#62;/prometheus/api/v1/write"| C[vminsert]
In this case, all the metrics written to /insert/<tenant_id>/prometheus/api/v1/write will belong to the specified <tenant_id> tenant.
Multitenancy via labels #
vmagent can write data to multiple distinct tenants if -remoteWrite.url points to the
multitenant URL in the VictoriaMetrics cluster
and the tenant is specified via
multitenancy labels
:
flowchart LR
    A["requests_total{instance=foo, vm_account_id=0}"] --> |<a href="https://docs.victoriametrics.com/victoriametrics/vmagent/#how-to-push-data-to-vmagent">push</a>| V[vmagent]
    B["requests_total{instance=bar, vm_account_id=1}"] <--> |<a href="https://docs.victoriametrics.com/victoriametrics/vmagent/#how-to-collect-metrics-in-prometheus-format">pull</a>| V
    V --> |"/insert/multitenant/prometheus/api/v1/write"| C[vminsert]
A single payload pulled from or pushed to vmagent may contain time series belonging to multiple tenants.
When vminsert receives the data on the /insert/multitenant path, it extracts <tenant_id> from the vm_account_id and vm_project_id labels for
each distinct time series.
If vm_account_id or vm_project_id labels are missing or invalid, then the corresponding accountID and projectID are set to 0.
The vm_account_id and vm_project_id labels can be specified via
relabeling
before sending the metrics to -remoteWrite.url.
For example, the following relabeling rule instructs sending metrics to <account_id>:0 tenant defined in the prometheus.io/account_id annotation of Kubernetes pod deployment:
      scrape_configs:
- kubernetes_sd_configs:
  - role: pod
  relabel_configs:
  - source_labels: [__meta_kubernetes_pod_annotation_prometheus_io_account_id]
    target_label: vm_account_id
vmagent can get the tenant identifier from the __tenant_id__ label during the target discovery phase.
It implicitly converts the __tenant_id__ label into vm_account_id and vm_project_id labels and attaches
them to the scraped metrics and metrics metadata.
For example, the following relabeling rule instructs sending metrics to the 10:5 tenant defined in the prometheus.io/tenant_id: 10:5
annotation of the Kubernetes pod deployment:
      scrape_configs:
- kubernetes_sd_configs:
  - role: pod
  relabel_configs:
  - source_labels: [__meta_kubernetes_pod_annotation_prometheus_io_tenant_id]
    target_label: __tenant_id__
vmagent can also enforce adding labels on all scraped or forwarded metrics.
Multitenancy via path #
vmagent can write data to multiple distinct tenants if:
- its
-remoteWrite.urlpoints to the VictoriaMetrics cluster multitenant URL - its
-enableMultitenantHandlerscommand-line flag is set - clients ingest data into vmagent with the tenant specified in the write path
flowchart LR
    A["requests_total{instance=foo}"] --> |<a href="https://docs.victoriametrics.com/victoriametrics/cluster-victoriametrics/#url-format">/insert/0/#60;suffix#62;</a>| V[vmagent]
    B["requests_total{instance=bar}"] --> |<a href="https://docs.victoriametrics.com/victoriametrics/cluster-victoriametrics/#url-format">/insert/1/#60;suffix#62;</a>| V
    V --> |"/insert/multitenant/prometheus/api/v1/write"| C[vminsert]
In this configuration, vmagent accepts writes via the same multitenant endpoints (/insert/<accountID>/<suffix>)
as vminsert does
.
For all the received data, vmagent will automatically convert tenant identifiers in the URL path to vm_account_id and vm_project_id labels, and set tenant information in metadata.
These tenant labels are added before applying
relabeling
specified via -remoteWrite.relabelConfig and -remoteWrite.urlRelabelConfig command-line flags.
Multitenancy via headers #
vmagent can write data to multiple distinct tenants if:
- its
-remoteWrite.urlpoints to the VictoriaMetrics cluster multitenant URL - its
-enableMultitenantHandlersand-enableMultitenancyViaHeaderscommand-line flags are both set - clients ingest data into vmagent with the tenants specified via headers Available from v1.143.0
flowchart LR
    A["requests_total{instance=foo}"] --> |<a href="https://docs.victoriametrics.com/victoriametrics/cluster-victoriametrics/#multitenancy-via-headers">/insert/#60;suffix#62;</a> <br>--header AccountID: 0| V[vmagent]
    B["requests_total{instance=bar}"] --> |<a href="https://docs.victoriametrics.com/victoriametrics/cluster-victoriametrics/#multitenancy-via-headers">/insert/#60;suffix#62;</a> <br>--header AccountID: 1| V
    V --> |"/insert/multitenant/prometheus/api/v1/write"| C[vminsert]
In this configuration, vmagent accepts writes via the same simplified multitenant endpoints (/insert/<suffix>)
as vminsert does
.
The tenant information is extracted from the AccountID and ProjectID HTTP headers, which are expected to be included in all incoming requests.
If headers are missing, then the tenant is set to 0:0 by default.
For all the received data, vmagent will automatically convert tenant identifiers in the headers to vm_account_id and vm_project_id labels, and set tenant info in metadata.
These tenant labels are added before applying
relabeling
specified via the -remoteWrite.relabelConfig
and -remoteWrite.urlRelabelConfig command-line flags.
vmauth can
enforce adding headers
to all
forwarded requests via the headers parameter in the config file.
Adding labels to metrics #
Extra labels can be added to metrics collected by vmagent via the following mechanisms:
The
global -> external_labelssection in the-promscrape.configfile. These labels are added only to metrics scraped from targets configured in the-promscrape.configfile. They aren’t added to metrics collected via other data ingestion protocols .The
-remoteWrite.labelcommand-line flag. These labels are added to all the collected metrics before sending them to all configured-remoteWrite.url. For example, the following command startsvmagent, which adds{datacenter="foobar"}label to all the metrics pushed to all the configured-remoteWrite.urldestinations:/path/to/vmagent -remoteWrite.label=datacenter=foobar ...Via relabeling. Relabeling can be applied globally and for each configured
-remoteWrite.urldestination. See Relabeling Cookbook .Add
extra_labelGET param to-remoteWrite.urladdress (only works when sending data to VictoriaMetrics components):/path/to/vmagent -remoteWrite.url=http://127.0.0.1:8428/api/v1/write?extra_label="env=prod"
Automatically generated metrics #
vmagent automatically generates the following metrics for each scrape of every
Prometheus-compatible target
and attaches instance, job, and other target-specific labels to these metrics:
up- this metric exposes a1value on successful scrape and a0value on unsuccessful scrape. This allows monitoring failing scrapes with the following MetricsQL query :up == 0scrape_duration_seconds- the duration of the scrape for the given target. This allows monitoring slow scrapes. For example, the following MetricsQL query returns scrapes, which take more than 1.5 seconds to complete:scrape_duration_seconds > 1.5scrape_timeout_seconds- the configured timeout for the current scrape target (akascrape_timeout). This allows detecting targets with scrape durations close to the configured scrape timeout. For example, the following MetricsQL query returns targets (identified byinstancelabel), which takes more than 80% of the configuredscrape_timeoutduring scrapes:scrape_duration_seconds / scrape_timeout_seconds > 0.8scrape_response_size_bytes- response size in bytes for the given target. This allows to monitor the amount of data scraped and to adjust themax_scrape_sizeoption for scraped targets. For example, the following MetricsQL query returns targets with scrape response bigger than10MiB:scrape_response_size_bytes > 10MiBscrape_samples_scraped- the number of samples parsed per each scrape. This allows detecting targets, which expose too many series . For example, the following MetricsQL query returns targets, which expose more than 10000 metrics:scrape_samples_scraped > 10000scrape_samples_limit- the configured limit on the number of samples the given target can expose. The limit can be set via thesample_limitoption at scrape_configs . This metric is exposed only if thesample_limitis set. This detects targets exposing more metrics than the configuredsample_limit. For example, the query below returns targets (byinstancelabel) exceeding 80% of the configuredsample_limit.scrape_samples_scraped / scrape_samples_limit > 0.8scrape_samples_post_metric_relabeling- the number of samples left after applying metric-level relabeling frommetric_relabel_configssection (see relabeling docs for more details). This allows detecting targets with too many series after the relabeling. For example, the following MetricsQL query returns targets with more than 10000 metrics after the relabeling:scrape_samples_post_metric_relabeling > 10000scrape_labels_limit- the configured limit on the number of labels the given target can expose per sample . The limit can be set via thelabel_limitoption at scrape_configs . This metric is exposed only if thelabel_limitis set.scrape_series_added- an approximate number of new series the given target generates during the current scrape. This metric allows detecting targets (identified byinstancelabel), which leads to high churn rate . For example, the following MetricsQL query returns targets, which generate more than 1000 new series during the last hour:sum_over_time(scrape_series_added[1h]) > 1000vmagentsetsscrape_series_addedto zero when it runs with-promscrape.noStaleMarkerscommand-line flag or when it scrapes target withno_stale_markers: trueoption, e.g. when staleness markers are disabled.Restarting
vmagentcan causescrape_series_addedto rise because all time series are new to a newly startedvmagent.scrape_series_limit- the limit on the number of unique series the given target can expose according to these docs . This metric is exposed only if the series limit is set.scrape_series_current- the number of unique series the given target exposed so far. This metric is exposed only when the series limit is set as described in these docs . This metric allows alerting when the number of exposed series for the given target reaches the limit. For example, the following query would trigger an alert when the target exposes more than 90% of unique series.scrape_series_current / scrape_series_limit > 0.9scrape_series_limit_samples_dropped- exposes the number of dropped samples during the scrape because of the exceeded limit on the number of unique series . This metric is exposed only when the series limit is set as described in these docs . This metric allows alerting when scraped samples are dropped due to exceeding a limit. For example, the following query alerts when at least a single sample is dropped because the limit has been exceeded during the last hour:sum_over_time(scrape_series_limit_samples_dropped[1h]) > 0
If the target exports metrics with names that clash with the automatically generated metric names, then vmagent automatically
prefixes exported_ to these metric names, so they don’t clash with automatically generated metric names.
Relabeling defined in relabel_configs or metric_relabel_configs of the scrape config isn’t applied to automatically
generated metrics. But they still can be relabeled via -remoteWrite.relabelConfig before sending metrics to the remote address.
Prometheus staleness markers #
vmagent sends Prometheus staleness markers
to -remoteWrite.url in the following cases:
- If they are passed to
vmagentvia Prometheus remote_write protocol . - If the metric disappears from the list of scraped metrics, then a stale marker is sent to this particular metric.
- If the scrape target becomes temporarily unavailable, then stale markers are sent for all the metrics scraped from this target.
- If the scrape target is removed from the list of targets, then stale markers are sent for all the metrics scraped from this target.
Prometheus staleness markers’ tracking needs additional memory, since it must store the previous response body for each scrape target in order to compare it to the current response body. The memory usage may be reduced by disabling staleness tracking in the following ways:
- By passing
-promscrape.noStaleMarkerscommand-line flag tovmagent. This disables staleness tracking across all the targets. - By specifying
no_stale_markers: trueoption in the scrape_config for the corresponding target.
When staleness tracking is disabled, then vmagent doesn’t track the number of new time series for each scrape,
e.g., it sets scrape_series_added metric to zero. See
these docs
for details.
Metric metadata #
vmagent accepts
Available from v1.137.0
metric metadata exposed by scrape targets in Prometheus exposition format
, received via Prometheus remote write v1
or OpenTelemetry protocol
by default. Set -enableMetadata=false to disable metadata processing
Available from v1.125.1
.
During processing, metadata won’t be dropped or modified by
relabeling
or
streaming aggregation
.
When -enableMultitenantHandlers is enabled, vmagent adds tenant info to metadata specified in
multitenant endpoint
(/insert/<accountID>/<suffix>).
However, if the /insert/multitenant/<suffix> endpoint is used, vmagent preserves the tenant information provided in the metadata by the sender. If the sender does not specify tenant information, the default tenant 0:0 is used.
Metadata requires extra memory, disk space, and network traffic.
Use -remoteWrite.disableMetadata
Available from v1.140.0
to fully disable sending metadata from vmagent.
This reduces network traffic and resource usage when metadata is not required.
Stream parsing mode #
By default, vmagent parses the full response from the scrape target, applies
relabeling
and then pushes the resulting metrics to the configured -remoteWrite.url in one go. This mode works great for the majority of cases
when the scrape target exposes a small number of metrics (e.g., less than 10K). But this mode may take large amounts of memory
when the scrape target exposes a large number of metrics (for example, when vmagent scrapes kube-state-metrics
in a large Kubernetes cluster. It is recommended to enable stream parsing for such targets.
When stream parsing is enabled, vmagent processes the response from the scrape target in chunks.
This saves memory when scraping targets that expose millions of metrics.
Stream parsing is automatically enabled for scrape targets returning response bodies with sizes larger than
the -promscrape.minResponseSizeForStreamParse command-line flag value. Additionally,
stream parsing can be explicitly enabled in the following places:
- Via
-promscrape.streamParsecommand-line flag. In this case, all the scrape targets defined in the file pointed by-promscrape.configare scraped in stream parsing mode. - Via
stream_parse: trueoption atscrape_configssection. In this case, all the scrape targets defined in this section are scraped in stream parsing mode. - Via
__stream_parse__=truelabel, which can be set via relabeling atrelabel_configssection. In this case, stream parsing mode is enabled for the corresponding scrape targets. Typical use case: to set the label via Kubernetes annotations for targets exposing a large number of metrics.
Examples:
      scrape_configs:
- job_name: 'big-federate'
  stream_parse: true
  static_configs:
  - targets:
    - big-prometheus1
    - big-prometheus2
  honor_labels: true
  metrics_path: /federate
  params:
    'match[]': ['{__name__!=""}']
Note that vmagent in stream parsing mode stores up to sample_limit samples to the configured -remoteStorage.url
instead of dropping all the samples read from the target, because the parsed data is sent to the remote storage
as soon as it is parsed in stream parsing mode.
Scraping big number of targets #
A single vmagent instance can scrape tens of thousands of scrape targets. Sometimes this isn’t enough due to limitations on CPU, network, RAM, etc.
In this case, scrape targets can be split among multiple vmagent instances (aka vmagent horizontal scaling, sharding, and clustering).
The number of vmagent instances in the cluster must be passed to the -promscrape.cluster.membersCount command-line flag.
Each vmagent instance in the cluster must use identical -promscrape.config files with distinct -promscrape.cluster.memberNum values
in the range 0 ... N-1, where N is the number of vmagent instances in the cluster specified via -promscrape.cluster.membersCount.
For example, the following commands spread scrape targets among a cluster of two vmagent instances:
      /path/to/vmagent -promscrape.cluster.membersCount=2 -promscrape.cluster.memberNum=0 -promscrape.config=/path/to/config.yml ...
/path/to/vmagent -promscrape.cluster.membersCount=2 -promscrape.cluster.memberNum=1 -promscrape.config=/path/to/config.yml ...
The -promscrape.cluster.memberNum can be set to a StatefulSet pod name when vmagent runs in Kubernetes.
The pod name must end with a number in the range 0 ... promscrape.cluster.membersCount-1. For example, -promscrape.cluster.memberNum=vmagent-0.
By default, targets are sharded among vmagent instances by all target labels after relabeling.
Use -promscrape.cluster.shardByLabels
Available from v1.146.0
to shard targets by specified labels instead.
For example, with -promscrape.cluster.shardByLabels=service, the targets with the same service label value will be scraped by the same vmagent instance,
which is useful when perform stream aggregation that requires all metrics with the same service label value to be processed on the same vmagent instance.
If none of the specified labels are present in the target labels, then all target labels will be used for sharding.
By default, each scrape target is scraped only by a single vmagent instance in the cluster. If there is a need for replicating scrape targets among multiple vmagent instances,
then -promscrape.cluster.replicationFactor command-line flag must be set to the desired number of replicas. For example, the following commands
start a cluster of three vmagent instances, where two vmagent instances scrape each target:
      /path/to/vmagent -promscrape.cluster.membersCount=3 -promscrape.cluster.replicationFactor=2 -promscrape.cluster.memberNum=0 -promscrape.config=/path/to/config.yml ...
/path/to/vmagent -promscrape.cluster.membersCount=3 -promscrape.cluster.replicationFactor=2 -promscrape.cluster.memberNum=1 -promscrape.config=/path/to/config.yml ...
/path/to/vmagent -promscrape.cluster.membersCount=3 -promscrape.cluster.replicationFactor=2 -promscrape.cluster.memberNum=2 -promscrape.config=/path/to/config.yml ...
Every vmagent in the cluster exposes all the discovered targets in the http://vmagent:8429/service-discovery page.
Each discovered target on this page contains its status (UP, DOWN, or DROPPED with the reason why the target has been dropped).
If the target is dropped because of sharding to other vmagent instances in the cluster, then the status column contains
-promscrape.cluster.memberNum values for vmagent instances where the given target is scraped.
The /service-discovery page provides links to the corresponding vmagent instances if the -promscrape.cluster.memberURLTemplate command-line flag is set.
Every occurrence of %d inside the -promscrape.cluster.memberURLTemplate is substituted with the -promscrape.cluster.memberNum
for the corresponding vmagent instance. For example, -promscrape.cluster.memberURLTemplate='http://vmagent-instance-%d:8429/targets'
generates http://vmagent-instance-42:8429/targets URL for vmagent instance, which runs with -promscrape.cluster.memberNum=42.
Note that vmagent shows up to -promscrape.maxDroppedTargets dropped targets on the /service-discovery page.
Increase the -promscrape.maxDroppedTargets command-line flag value if the /service-discovery page misses some dropped targets.
If multiple vmagent instances scrape the same target, data deduplication must be enabled for the remote storage specified by -remoteWrite.url.
The -dedup.minScrapeInterval must be set to the scrape_interval configured at -promscrape.config.
See
these docs
for details.
The -promscrape.cluster.memberLabel command-line flag allows specifying a name for the member num label to add to all the scraped metrics.
The value of the member num label is set to -promscrape.cluster.memberNum. For example, the following config instructs adding vmagent_instance="0" label
to all the metrics scraped by the given vmagent instance:
/path/to/vmagent -promscrape.cluster.membersCount=2 -promscrape.cluster.memberNum=0 -promscrape.cluster.memberLabel=vmagent_instance
See also how to shard data among multiple remote storage systems .
High availability #
It is possible to run multiple identically configured vmagent instances or vmagent
clusters
, so they
scrape
the same set of targets and push the collected data to the same set of VictoriaMetrics remote storage systems.
Two identically configured vmagent instances or clusters are usually called an HA pair.
When running HA pairs, deduplication must be configured on the VictoriaMetrics side to deduplicate received samples. See these docs for details.
It is also recommended to pass different values to the -promscrape.cluster.name command-line flag per vmagent
instance or per vmagent cluster in a HA setup. This is needed for proper data de-duplication.
See this issue
for details.
Scraping targets via a proxy #
vmagent supports scraping targets via HTTP, HTTPS, and SOCKS5 proxies. Proxy address must be specified in the proxy_url option. For example, the following scrape config instructs
target scraping via https proxy at https://proxy-addr:1234:
      scrape_configs:
- job_name: foo
  proxy_url: https://proxy-addr:1234
Proxy can be configured with the following optional settings:
proxy_authorizationfor generic token authorization. See these docs .proxy_basic_authfor Basic authorization. See these docs .proxy_bearer_tokenandproxy_bearer_token_filefor Bearer token authorizationproxy_oauth2for OAuth2 config. See these docs .proxy_tls_configfor TLS config. See these docs .proxy_headersfor passing additional HTTP headers in requests to the proxy.
For example:
      scrape_configs:
- job_name: foo
  proxy_url: https://proxy-addr:1234
  proxy_basic_auth:
    username: foobar
    password: secret
  proxy_tls_config:
    insecure_skip_verify: true
    cert_file: /path/to/cert
    key_file: /path/to/key
    ca_file: /path/to/ca
    server_name: real-server-name
  proxy_headers:
  - "Proxy-Auth: top-secret"
On-disk persistence #
vmagent stores pending data that cannot be sent to the configured remote storage systems in a timely manner.
By default, vmagent writes all the pending data to the folder configured via -remoteWrite.tmpDataPath cmd-line flag
until this data is sent to the configured -remoteWrite.url systems or until the folder becomes full.
The maximum data size that can be saved to -remoteWrite.tmpDataPath per every configured -remoteWrite.url can be
limited via -remoteWrite.maxDiskUsagePerURL command-line flag. When this limit is reached, vmagent drops the oldest
data from disk in order to save newly ingested data.
The folder structure of persisted data is as follows:
      <remoteWrite.tmpDataPath>
└── persistent-queue
    └── 1_B9EB7BE220B91E9D
Each remote write URL corresponds to a folder similar to 1_B9EB7BE220B91E9D.
It’s generated based on the following information:
- The sequence order of the remote write URL command-line flags, starting from 1.
- The hash result of the remote write URL itself, excluding query parameters and fragments.
For example, for the remote write configs:
      -remoteWrite.url=http://example-1:8428/prometheus/api/v1/write?foo=bar#baz
-remoteWrite.url=http://user:pass@example-2:8428/prometheus/api/v1/write?qux=quux#quuz
vmagent will generate the following persistent queue folders:
      # 1_<hash(http://example-1:8428/prometheus/api/v1/write)>, query parameters foo=bar and fragment baz are removed.
1_BA6E4303DCFA0D45
# 2_<hash(http://user:pass@example-2:8428/prometheus/api/v1/write)>, query parameters qux=quux and fragment quuz are removed.
2_0AAFDF53E314A72A
On-disk persistence and data processing order #
By default, vmagent processes data in FIFO order. If data has been written to the on-disk queue, it must be flushed to the remote storage before newly ingested data can be forwarded there. During long outages, vmagent may accumulate large amounts of data in the file-based queue, which can introduce a significant lag between the moment data is collected by vmagent and the moment it becomes visible at the remote storage.
This behavior can be changed with the -remoteWrite.inmemoryQueues
Available from v1.146.0
command-line flag.
When set to a non-zero value, vmagent starts the given number of additional workers,
which send only recently ingested data from the in-memory queue, while the workers configured via -remoteWrite.queues drain the file-based backlog concurrently.
This reduces the delivery lag for fresh samples after remote storage outages or slowdowns. The flag can be set individually per each -remoteWrite.url.
Note that these workers are started in addition to the workers configured via -remoteWrite.queues, so the total number of concurrent connections to
the remote storage becomes the sum of both flags. Take this into account if the remote storage limits the number of concurrent requests.
This flag has the following possible limitations:
- Samples may arrive at the remote storage out of order, since recent data can be delivered before the older backlogged data. Do not use this option if the remote storage doesn’t accept out-of-order samples.
- Recent data isn’t guaranteed to take the fast path: if the in-memory queue is full, newly ingested data is still written to the file-based queue and is delivered in FIFO order by the generic workers.
Disabling On-disk persistence #
There are cases when it is better to disable on-disk persistence for pending data on the vmagent side:
- When the persistent disk performance isn’t enough for the given data processing rate.
- When clients can buffer pending data more efficiently on their side than on the
vmagentside (on the-remoteWrite.tmpDataPathfolder). - When the data is already buffered at Kafka or Google PubSub .
- When dropping pending data is better than buffering it.
In this case, the -remoteWrite.disableOnDiskQueue command-line flag can be passed to vmagent for each configured -remoteWrite.url.
vmagent works in the following way if the corresponding remote storage system at -remoteWrite.url cannot keep up with the data ingestion rate
and the -remoteWrite.disableOnDiskQueue command-line flag is set:
- It returns
429 Too Many RequestsHTTP error to clients, which send data tovmagentvia supported HTTP endpoints . If the-remoteWrite.dropSamplesOnOverloadcommand-line flag is set or if multiple-remoteWrite.urlcommand-line flags are set, then the ingested samples are silently dropped instead of returning an error to clients. - It suspends consuming data from
Kafka
or
Google PubSub
until the remote storage becomes available.
If the
-remoteWrite.dropSamplesOnOverloadcommand-line flag is set or if multiple-remoteWrite.disableOnDiskQueuecommand-line flags are set for different-remoteWrite.urloptions, then the fetched samples are silently dropped instead of suspending data consumption from Kafka or Google PubSub. - It drops samples pushed to
vmagentvia non-HTTP protocols and logs the error. Pass-remoteWrite.dropSamplesOnOverloadcommand-line flag in order to suppress error messages in this case. - It drops samples scraped from Prometheus-compatible targets , because it is better from operations perspective to drop samples instead of blocking the scrape process.
- It drops stream aggregation output samples, because it is better from an operations perspective to drop output samples instead of blocking the stream aggregation process.
The number of dropped samples because of overloaded remote storage can be
monitored
via vmagent_remotewrite_samples_dropped_total metric.
The number of unsuccessful attempts to send data to overloaded remote storage can be
monitored
via vmagent_remotewrite_push_failures_total metric.
Running vmagent on hosts with more RAM or increasing the value for -memory.allowedPercent may reduce the number of unsuccessful attempts or dropped samples
on spiky workloads, since vmagent may buffer more data in memory before returning the error or dropping data.
vmagent still may write pending in-memory data to -remoteWrite.tmpDataPath on graceful shutdown
if -remoteWrite.disableOnDiskQueue command-line flag is specified. It may also read buffered data from -remoteWrite.tmpDataPath
on startup.
When the -remoteWrite.disableOnDiskQueue command-line flag is set, vmagent may send the same samples multiple times to the configured remote storage
if it cannot keep up with the data ingestion rate. In this case
deduplication
must be enabled on all the configured remote storage systems.
Cardinality limiter #
By default, vmagent doesn’t limit the number of time series each scrape target can expose.
The limit can be enforced in the following places:
- Via
-promscrape.seriesLimitPerTargetcommand-line flag. This limit is applied individually to all the scrape targets defined in the file pointed to by-promscrape.config. - Via
series_limitconfig option at scrape_config section. Theseries_limitallows overriding the-promscrape.seriesLimitPerTargeton a per-scrape_configbasis. Ifseries_limitis set to0or to a negative value, then it isn’t applied to the givenscrape_config, even if the-promscrape.seriesLimitPerTargetcommand-line flag is set. - Via
__series_limit__label, which can be set with relabeling atrelabel_configssection. The__series_limit__allows overriding theseries_limiton a per-target basis. If__series_limit__is set to0or to a negative value, then it isn’t applied to the given target. Typical use case: to set the limit via Kubernetes annotations for targets, which may expose too many time series.
Scraped metrics are dropped for time series exceeding the given limit for the 24h time window.
vmagent creates the following additional per-target metrics for targets with non-zero series limit:
scrape_series_limit_samples_dropped- the number of dropped samples during the scrape when the unique series limit is exceeded.scrape_series_limit- the series limit for the given target.scrape_series_current- the current number of series for the given target.
These metrics are automatically sent to the configured -remoteWrite.url alongside the scraped per-target metrics.
These metrics allow building the following alerting rules:
scrape_series_current / scrape_series_limit > 0.9- alerts when the number of series exposed by the target reaches 90% of the limit.sum_over_time(scrape_series_limit_samples_dropped[1h]) > 0- alerts when some samples are dropped because the series limit on a particular target is reached.
See also sample_limit option at
scrape_config section
.
By default, vmagent doesn’t limit the number of time series written to remote storage systems specified at -remoteWrite.url.
The limit can be enforced by setting the following command-line flags:
-remoteWrite.maxHourlySeries- limits the number of unique time seriesvmagentcan write to remote storage systems during the last hour. Useful for limiting the number of active time series.-remoteWrite.maxDailySeries- limits the number of unique time seriesvmagentcan write to remote storage systems during the last day. Useful for limiting daily churn rate.
It is possible to use -1 as a value for these flags
Available from v1.140.0
in order to enable series tracking while setting the limit to the maximum possible value.
This is useful for estimating the number of unique series written to remote storage systems without enforcing limits.
Both limits can be set simultaneously. If any of these limits are reached, then samples for the new time series are dropped instead of being sent to remote storage systems. A sample of dropped series is logged with a WARNING level message.
vmagent exposes the following metrics at http://vmagent:8429/metrics page (see
monitoring docs
for details):
vmagent_hourly_series_limit_rows_dropped_total- the number of metrics dropped due to exceeding the hourly limit on the number of unique time series.vmagent_hourly_series_limit_max_series- the hourly series limit set via-remoteWrite.maxHourlySeries.vmagent_hourly_series_limit_current_series- the current number of unique series registered during the last hour.vmagent_daily_series_limit_rows_dropped_total- the number of metrics dropped due to exceeding the daily limit on the number of unique time series.vmagent_daily_series_limit_max_series- the daily series limit set via-remoteWrite.maxDailySeries.vmagent_daily_series_limit_current_series- the current number of unique series registered during the last day.
These limits are approximate, so vmagent can underflow or overflow them by a small percentage (usually less than 1%).
See also cardinality explorer docs .
Monitoring #
vmagent exports various metrics in Prometheus exposition format at http://vmagent-host:8429/metrics page.
We recommend setting up regular scraping of this page either through vmagent itself or by a Prometheus-compatible scraper,
so that the exported metrics may be analyzed later.
If you use Google Cloud Managed Prometheus for scraping metrics from VictoriaMetrics components, then pass -metrics.exposeMetadata
command-line to them, so they add TYPE and HELP comments for each exposed metric on the /metrics page.
See these docs
for details.
Use the official Grafana dashboard
for the vmagent state overview.
Graphs on this dashboard contain useful hints - hover the i icon at the top left corner of each graph in order to read it.
If you have suggestions for improvements or have found a bug, please open an issue on GitHub
, or add a review to the dashboard.
vmagent also exports the status for various targets at the following pages:
http://vmagent-host:8429/targets. This page shows the current status for every active target.http://vmagent-host:8429/service-discovery. This page shows the list of discovered targets with the discovered__meta_*labels according to these docs . This page may help with debugging target relabeling .http://vmagent-host:8429/api/v1/targets. This handler returns a JSON response compatible with the corresponding page from Prometheus API .http://vmagent-host:8429/ready. This handler returns an HTTP 200 status code whenvmagentfinishes its initialization for all the service_discovery configs . It may be useful to perform avmagentrolling update without any scrape loss.
Troubleshooting #
It is recommended to set up the official Grafana dashboard in order to monitor the state of
vmagent.It is recommended to increase the maximum number of open files in the system (
ulimit -n) when scraping a large number of targets, asvmagentestablishes at least one TCP connection per target.If
vmagentuses too much RAM or CPU, then follow these recommendations .When
vmagentscrapes many unreliable targets, it can flood the error log with scrape errors. It is recommended to investigate and fix these errors. If it is unfeasible to fix all the reported errors, then they can be suppressed by passing the-promscrape.suppressScrapeErrorscommand-line flag tovmagent. The most recent scrape error for each target can be observed athttp://vmagent-host:8429/targetsandhttp://vmagent-host:8429/api/v1/targets.The
http://vmagent-host:8429/configpage shows the current active-promscrape.configconfiguration. Access to the endpoint can be protected via the-configAuthKeycommand-line flag.Pages
http://vmagent-host:8429/remotewrite-relabel-configandhttp://vmagent-host:8429/remotewrite-url-relabel-configAvailable from v1.129.0 show current active-remoteWrite.relabelConfigand-remoteWrite.urlRelabelConfigconfiguration correspondingly. Access to endpoints can be protected via the-configAuthKeycommand-line flag.The
http://vmagent-host:8429/service-discoverypage could be useful for debugging the relabeling process for scrape targets. This page contains original labels for targets dropped during relabeling. By default, the-promscrape.maxDroppedTargetstargets are shown here. If your setup drops more targets during relabeling, then increase the-promscrape.maxDroppedTargetscommand-line flag value to see all the dropped targets. Note that tracking each dropped target requires up to 10Kb of RAM. Therefore, big values for-promscrape.maxDroppedTargetsmay result in increased memory usage if a large number of scrape targets are dropped during relabeling.It is recommended to increase
-remoteWrite.queuesifvmagent_remotewrite_pending_data_bytesmetric grows constantly. It is also recommended to increase-remoteWrite.maxBlockSizeand-remoteWrite.maxRowsPerBlockcommand-line flags in this case. This can improve data ingestion performance to the configured remote storage systems at the cost of higher memory usage.If you see gaps in the data pushed by
vmagentto remote storage when-remoteWrite.maxDiskUsagePerURLis set, try increasing-remoteWrite.queues. Such gaps may appear becausevmagentcannot keep up with sending the collected data to remote storage. Therefore, it starts dropping the buffered data if the on-disk buffer size exceeds-remoteWrite.maxDiskUsagePerURL.vmagentdrops data blocks if remote storage replies with400 Bad Requestor409 ConflictHTTP responses. The number of dropped blocks can be monitored via thevmagent_remotewrite_packets_dropped_totalmetric, which is exported on the /metrics page .Use
-remoteWrite.queues=1when-remoteWrite.urlpoints to remote storage, which doesn’t accept out-of-order samples (aka data backfilling). Such storage systems include Prometheus, Mimir, Cortex, and Thanos, which typically emitout of order sampleerrors. The best solution is to use remote storage with backfilling support such as VictoriaMetrics.vmagentbuffers scraped data at the-remoteWrite.tmpDataPathdirectory until it is sent to-remoteWrite.url. The directory can grow large when remote storage is unavailable for extended periods of time, and if the maximum directory size isn’t limited with the-remoteWrite.maxDiskUsagePerURLcommand-line flag. If you don’t want to send all the buffered data from the directory to remote storage, then simply stopvmagentand delete the directory.If
vmagentruns on a host with slow persistent storage, which cannot keep up with the volume of processed samples, then it is possible to disable the persistent storage with the-remoteWrite.disableOnDiskQueuecommand-line flag. See these docs for more details.By default,
vmagentmasks-remoteWrite.urlwithsecret-urlvalues in logs and at the/metricspage because the URL may contain sensitive information such as auth tokens or passwords. Pass-remoteWrite.showURLcommand-line flag when startingvmagentin order to see all the valid URLs.By default,
vmagentevenly spreads scrape load in time. If a particular scrape target must be scraped at the beginning of some interval, then thescrape_align_intervaloption must be used. For example, the following config aligns hourly scrapes to the beginning of the hour:scrape_configs: - job_name: foo scrape_interval: 1h scrape_align_interval: 1hBy default, vmagent evenly spreads scrape load in time. If a particular scrape target needs scraping at a specific offset, use the
scrape_offsetoption. For example, the following config instructsvmagentto scrape the target 10 seconds after the start of every 1-minute interval:scrape_configs: - job_name: foo scrape_interval: 1m scrape_offset: 10sIf you see
skipping duplicate scrape target with identical labelserrors when scraping Kubernetes pods, then it is likely these pods listen to multiple ports or they use an init container. These errors can either be fixed or suppressed with the-promscrape.suppressDuplicateScrapeTargetErrorscommand-line flag. See the available options below if you prefer fixing the root cause of the error:The following relabeling rule may be added to the
relabel_configssection in order to filter out pods with unneeded ports:- action: keep_if_equal source_labels: [__meta_kubernetes_pod_annotation_prometheus_io_port, __meta_kubernetes_pod_container_port_number]The following relabeling rule may be added to the
relabel_configssection in order to filter out init container pods:- action: drop source_labels: [__meta_kubernetes_pod_container_init] regex: true
See also:
Calculating disk space for persistence queue #
vmagent buffers collected metrics on disk at the directory specified via -remoteWrite.tmpDataPath command-line flag
until the metrics are sent to remote storage configured via -remoteWrite.url command-line flag.
The -remoteWrite.tmpDataPath directory can grow large when remote storage is unavailable for extended
periods of time and if the maximum directory size isn’t limited with the -remoteWrite.maxDiskUsagePerURL command-line flag.
To estimate the allocated disk size for the persistent queue, or to estimate the -remoteWrite.maxDiskUsagePerURL command-line flag value,
take into account the following attributes:
The size in bytes of the data stream sent by vmagent:
Run the query
sum(rate(vmagent_remotewrite_bytes_sent_total[1h])) by(instance,url)in vmui or Grafana to get the amount of bytes sent by each vmagent instance per second.The amount of time a persistent queue should keep the data before starting to drop it.
For example, if
vmagentshould be able to buffer the data for at least 6 hours, then the following query can be used for estimating the needed amounts of disk space in gigabytes:sum(rate(vmagent_remotewrite_bytes_sent_total[1h])) by(instance,url) * 6h / 1Gi
Additional notes:
- Ensure that
vmagentmonitoring is configured properly. - Re-evaluate the estimation each time when:
- there is an increase in the vmagent’s workload
- there is a change in relabeling rules which could increase the amount metrics to send
- there is a change in the number of configured
-remoteWrite.urladdresses
- The minimum disk size to allocate for the persistent queue is 500Mi per each
-remoteWrite.url. - The on-disk persistent queue can be disabled if needed. See these docs .
Security #
See general recommendations regarding security .
vmagent’s /remotewrite-relabel-config and /remotewrite-url-relabel-config endpoints
Available from v1.129.0
can be protected via the -configAuthKey command-line flag.
mTLS protection #
By default, vmagent accepts HTTP requests at port 8429 (this port can be changed via -httpListenAddr command-line flags).
It is expected that vmagent runs in an isolated, trusted network.
The
Enterprise version of vmagent
supports the ability to accept mTLS
requests at this port, by specifying -tls and -mtls command-line flags. For example, the following command runs vmagent, which accepts only mTLS requests at port 8429:
./vmagent -tls -mtls -remoteWrite.url=...
By default, the system-wide TLS Root CA
is used for verifying client certificates if the -mtls command-line flag is specified.
It is possible to specify a custom TLS Root CA via the -mtlsCAFile command-line flag.
Performance optimizations #
vmagent is optimized for low CPU and RAM usage, with no need to tune any configs. Sometimes, however, it is necessary to further optimize the CPU/RAM usage of vmagent.
For example, if vmagent needs to scrape thousands of targets in resource-constrained environments, then the following options may help to reduce CPU and RAM usage:
Set the GOGC environment variable to
100. This reduces CPU usage at the cost of higher RAM usage.Set GOMAXPROCS environment variable to a value slightly bigger than the number of CPU cores used by
vmagent. Another option is to set the CPU limit in Kubernetes / Docker to an integer value bigger than the number of CPU cores used byvmagent. This reduces RAM and CPU usage whenvmagentruns in an environment with a large number of available CPU cores. Note that it may be necessary to increase the-remoteWrite.queuescommand-line flag to a larger value ifGOMAXPROCSis set to too small of a value, since by default-remoteWrite.queuesis proportional toGOMAXPROCS.Avoid increasing the value for the
-maxConcurrentRequestscommand-line flag. The default value is optimized for the best performance in most cases, even if many clients send data tovmagentvia many concurrent connections and the number of these connections significantly exceeds the default value for the-maxConcurrentRequestscommand-line flag.vmagentputs incoming requests into a wait queue if the number of concurrently executed requests exceeds-maxConcurrentRequests. The pending requests at the wait queue do not consume CPU and do not consume significant amounts of RAM, so it is OK to have thousands of pending requests in the wait queue. Pending requests in the wait queue are canceled if they wait for their execution for longer than the duration specified in the-insert.maxQueueDurationcommand-line flag. Canceled requests can be monitored viavm_concurrent_insert_limit_timeout_totalmetric.Disable response compression at scrape targets via
-promscrape.disableCompressioncommand-line flag or viadisable_compression: trueoption in the scrape_config . This reduces CPU usage at the cost of higher network bandwidth usage betweenvmagentand scrape targets.Disable tracking of original labels for the discovered targets via
-promscrape.dropOriginalLabelscommand-line flag. This helps to reduce RAM usage whenvmagentdiscovers a large number of scrape targets, and the majority of these targets are dropped . This is a typical case whenvmagentdiscovers Kubernetes targets. The downside of using the-promscrape.dropOriginalLabelscommand-line flag is the reduced debuggability for improperly configured per-target relabeling.Disable staleness markers via
-promscrape.noStaleMarkerscommand-line flag or viano_stale_markers: trueoption in the scrape_config . This reduces RAM and CPU usage. Note that disabling staleness markers may yield unexpected query results when scrape targets are frequently rotated (which is typical in Kubernetes).Set
-memory.allowedBytescommand-line flag to a value close to the actual memory usage ofvmagent. Another option is to set the memory limit in Kubernetes / Docker to the value 50% larger than the actual memory usage ofvmagent. This should reduce memory usage spikes forvmagentrunning in the environment with a large amount of available memory and when the remote storage cannot keep up with the data ingestion rate. Increasing the-remoteWrite.queuescommand-line flag value may help in this case, too.In extreme cases, it may be useful to set the
-promscrape.disableKeepAlivecommand-line flag in order to save RAM on HTTP keep-alive connections to thousands of scrape targets.Increase the
scrape_intervaloption in theglobalsection of the-promscrape.configand/or at every scrape_config to reduce CPU usage. For example, increasing thescrape_intervalfrom10sto30sacross all targets reduces CPU usage onvmagentby up to 3x.
Example command, which runs vmagent in an optimized mode:
GOGC=100 GOMAXPROCS=1 ./vmagent -promscrape.disableCompression -promscrape.dropOriginalLabels -promscrape.noStaleMarkers -memory.allowedBytes=1GiB -promscrape.disableKeepAlive ...
How to build from sources #
We recommend using the official binary releases
- vmagent is located in the vmutils-... archives.
It may be necessary to build vmagent from source code when developing or testing a new feature or bug fix.
Development build #
- Install Go .
- Run
make vmagentfrom the root folder of the repository . It builds thevmagentbinary and puts it into thebinfolder.
Production build #
- Install Docker .
- Run
make vmagent-prodfrom the root folder of the repository . It builds thevmagent-prodbinary and puts it into thebinfolder.
Building docker images #
Run make package-vmagent. It builds victoriametrics/vmagent:<PKG_TAG> docker image locally.
<PKG_TAG> is an auto-generated image tag, which depends on source code in the repository
.
The <PKG_TAG> may be manually set via PKG_TAG=foobar make package-vmagent.
The base Docker image is alpine
, but it is possible to use any other base image
by setting it via the <ROOT_IMAGE> environment variable. For example, the following command builds the image on top of scratch
image:
ROOT_IMAGE=scratch make package-vmagent
ARM build #
ARM build may run on Raspberry Pi or on energy-efficient ARM servers .
Development ARM build #
- Install Go .
- Run
make vmagent-linux-armormake vmagent-linux-arm64from the root folder of the repository It buildsvmagent-linux-armorvmagent-linux-arm64binary, respectively, and puts it into thebinfolder.
Production ARM build #
- Install Docker .
- Run
make vmagent-linux-arm-prodormake vmagent-linux-arm64-prodfrom the root folder of the repository . It buildsvmagent-linux-arm-prodorvmagent-linux-arm64-prodbinary, respectively, and puts it into thebinfolder.
Profiling #
vmagent provides handlers for collecting the following Go profiles
:
- Memory profile can be collected with the following command (replace
0.0.0.0with hostname if needed):
curl http://0.0.0.0:8429/debug/pprof/heap > mem.pprof
- CPU profile can be collected with the following command (replace
0.0.0.0with hostname if needed):
curl http://0.0.0.0:8429/debug/pprof/profile > cpu.pprof
The command for collecting the CPU profile waits for 30 seconds before returning.
The collected profiles may be analyzed with go tool pprof .
It is safe to share the collected profiles from a security perspective, since they do not contain sensitive information.
Advanced usage #
vmagent can be fine-tuned with various command-line flags. Run ./vmagent -help in order to see the full list of these flags with their descriptions and default values.
Common flags #
These flags are available in both VictoriaMetrics OSS and VictoriaMetrics Enterprise.
vmagent collects metrics data via popular data ingestion protocols and routes it to VictoriaMetrics.

See the docs at https://docs.victoriametrics.com/victoriametrics/vmagent/ .

  -blockcache.missesBeforeCaching int
     The number of cache misses before putting the block into cache. Higher values may reduce indexdb/dataBlocks cache size at the cost of higher CPU and disk read usage (default 2)
  -cacheExpireDuration duration
     Items are removed from in-memory caches after they aren't accessed for this duration. Lower values may reduce memory usage at the cost of higher CPU usage. See also -prevCacheRemovalPercent (default 30m0s)
  -configAuthKey value
     Authorization key for accessing /config and /remotewrite-.*-config pages. It must be passed via authKey query arg. It overrides -httpAuth.*
     Flag value can be read from the given file when using -configAuthKey=file:///abs/path/to/file or -configAuthKey=file://./relative/path/to/file.
     Flag value can be read from the given http/https url when using -configAuthKey=http://host/path or -configAuthKey=https://host/path
  -csvTrimTimestamp duration
     Trim timestamps when importing csv data to this duration. Minimum practical duration is 1ms. Higher duration (i.e. 1s) may be used for reducing disk space usage for timestamp data (default 1ms)
  -datadog.maxInsertRequestSize size
     The maximum size in bytes of a single DataDog POST request to /datadog/api/v2/series
     Supports the following optional suffixes for size values: KB, MB, GB, TB, KiB, MiB, GiB, TiB (default 67108864)
  -datadog.sanitizeMetricName
     Sanitize metric names for the ingested DataDog data to comply with DataDog behaviour described at https://docs.datadoghq.com/metrics/custom_metrics/#naming-custom-metrics (default true)
  -denyQueryTracing
     Whether to disable the ability to trace queries. See https://docs.victoriametrics.com/victoriametrics/single-server-victoriametrics/#query-tracing
  -dryRun
     Whether to check config files without running vmagent. The following files are checked: -promscrape.config, -remoteWrite.relabelConfig, -remoteWrite.urlRelabelConfig, -remoteWrite.streamAggr.config . Unknown config entries aren't allowed in -promscrape.config by default. This can be changed by passing -promscrape.config.strictParse=false command-line flag
  -enableMetadata
     Whether to enable metadata processing for metrics scraped from targets, received via VictoriaMetrics remote write, Prometheus remote write v1 or OpenTelemetry protocol. See also remoteWrite.maxMetadataPerBlock (default true)
  -enableMultitenancyViaHeaders
     Enables multitenancy via HTTP headers. See https://docs.victoriametrics.com/victoriametrics/vmagent/#multitenancy
  -enableMultitenantHandlers
     Whether to process incoming data via multitenant insert handlers according to https://docs.victoriametrics.com/victoriametrics/cluster-victoriametrics/#url-format . By default incoming data is processed via single-node insert handlers according to https://docs.victoriametrics.com/victoriametrics/single-server-victoriametrics/#how-to-import-time-series-data .See https://docs.victoriametrics.com/victoriametrics/vmagent/#multitenancy for details
  -enableTCP6
     Whether to enable IPv6 for listening and dialing. By default, only IPv4 TCP and UDP are used
  -envflag.enable
     Whether to enable reading flags from environment variables in addition to the command line. Command line flag values have priority over values from environment vars. Flags are read only from the command line if this flag isn't set. See https://docs.victoriametrics.com/victoriametrics/single-server-victoriametrics/#environment-variables for more details
  -envflag.prefix string
     Prefix for environment variables if -envflag.enable is set
  -filestream.disableFadvise
     Whether to disable fadvise() syscall when reading large data files. The fadvise() syscall prevents from eviction of recently accessed data from OS page cache during background merges and backups. In some rare cases it is better to disable the syscall if it uses too much CPU
  -flagsAuthKey value
     Auth key for /flags endpoint. It must be passed via authKey query arg. It overrides -httpAuth.*
     Flag value can be read from the given file when using -flagsAuthKey=file:///abs/path/to/file or -flagsAuthKey=file://./relative/path/to/file.
     Flag value can be read from the given http/https url when using -flagsAuthKey=http://host/path or -flagsAuthKey=https://host/path
  -fs.disableMincore
     Whether to disable the mincore() syscall for checking mmap()ed files. By default, mincore() is used to detect whether mmap()ed file pages are resident in memory. Disabling mincore() may be needed on older ZFS filesystems (below 2.1.5), since it may trigger ZFS bug. See https://github.com/VictoriaMetrics/VictoriaMetrics/issues/10327 for details.
  -fs.disableMmap
     Whether to use pread() instead of mmap() for reading data files. By default, mmap() is used for 64-bit arches and pread() is used for 32-bit arches, since they cannot read data files bigger than 2^32 bytes in memory. mmap() is usually faster for reading small data chunks than pread()
  -fs.maxConcurrency int
     The maximum number of concurrent goroutines to work with files; smaller values may help reducing Go scheduling latency on systems with small number of CPU cores; higher values may help reducing data ingestion latency on systems with high-latency storage such as NFS or Ceph (default fsutil.getDefaultConcurrency())
  -graphite.sanitizeMetricName
     Sanitize metric names for the ingested Graphite data. See https://docs.victoriametrics.com/victoriametrics/integrations/graphite/#ingesting
  -graphiteListenAddr string
     TCP and UDP address to listen for Graphite plaintext data. Usually :2003 must be set. Doesn't work if empty. See also -graphiteListenAddr.useProxyProtocol
  -graphiteListenAddr.useProxyProtocol
     Whether to use proxy protocol for connections accepted at -graphiteListenAddr . See https://www.haproxy.org/download/1.8/doc/proxy-protocol.txt
  -graphiteTrimTimestamp duration
     Trim timestamps for Graphite data to this duration. Minimum practical duration is 1s. Higher duration (i.e. 1m) may be used for reducing disk space usage for timestamp data (default 1s)
  -http.connTimeout duration
     Incoming connections to -httpListenAddr are closed after the configured timeout. This may help evenly spreading load among a cluster of services behind TCP-level load balancer. Zero value disables closing of incoming connections (default 2m0s)
  -http.disableCORS
     Disable CORS for all origins (*)
  -http.disableKeepAlive
     Whether to disable HTTP keep-alive for incoming connections at -httpListenAddr
  -http.disableResponseCompression
     Disable compression of HTTP responses to save CPU resources. By default, compression is enabled to save network bandwidth
  -http.header.csp string
     Value for 'Content-Security-Policy' header, recommended: "default-src 'self'"
  -http.header.disableServerHostname
     Whether to disable 'X-Server-Hostname' header in HTTP responses
  -http.header.frameOptions string
     Value for 'X-Frame-Options' header
  -http.header.hsts string
     Value for 'Strict-Transport-Security' header, recommended: 'max-age=31536000; includeSubDomains'
  -http.idleConnTimeout duration
     Timeout for incoming idle http connections (default 1m0s)
  -http.maxGracefulShutdownDuration duration
     The maximum duration for a graceful shutdown of the HTTP server. During this period the server stops accepting new connections, but it will continue serving existing connections. The remaining in-flight requests are canceled before the deadline, so the shutdown can finish within this duration. A highly loaded server may require increased value for a graceful shutdown (default 7s)
  -http.pathPrefix string
     An optional prefix to add to all the paths handled by http server. For example, if '-http.pathPrefix=/foo/bar' is set, then all the http requests will be handled on '/foo/bar/*' paths. This may be useful for proxied requests. See https://www.robustperception.io/using-external-urls-and-proxies-with-prometheus
  -http.shutdownDelay duration
     Optional delay before http server shutdown. During this delay, the server returns non-OK responses from /health page, so load balancers can route new requests to other servers
  -httpAuth.password value
     Password for HTTP server's Basic Auth. The authentication is disabled if -httpAuth.username is empty
     Flag value can be read from the given file when using -httpAuth.password=file:///abs/path/to/file or -httpAuth.password=file://./relative/path/to/file.
     Flag value can be read from the given http/https url when using -httpAuth.password=http://host/path or -httpAuth.password=https://host/path
  -httpAuth.username string
     Username for HTTP server's Basic Auth. The authentication is disabled if empty. See also -httpAuth.password
  -httpListenAddr array
     TCP address to listen for incoming http requests. Set this flag to empty value in order to disable listening on any port. This mode may be useful for running multiple vmagent instances on the same server. Note that /targets and /metrics pages aren't available if -httpListenAddr=''. See also -tls and -httpListenAddr.useProxyProtocol
     Supports an array of values separated by comma or specified via multiple flags.
     Each array item can contain comma inside single-quoted or double-quoted string, {}, [] and () braces.
  -httpListenAddr.useProxyProtocol array
     Whether to use proxy protocol for connections accepted at the corresponding -httpListenAddr . See https://www.haproxy.org/download/1.8/doc/proxy-protocol.txt . With enabled proxy protocol http server cannot serve regular /metrics endpoint. Use -pushmetrics.url for metrics pushing
     Supports array of values separated by comma or specified via multiple flags.
     Empty values are set to false.
  -import.maxLineLen size
     The maximum length in bytes of a single line accepted by /api/v1/import; the line length can be limited with 'max_rows_per_line' query arg passed to /api/v1/export
     Supports the following optional suffixes for size values: KB, MB, GB, TB, KiB, MiB, GiB, TiB (default 10485760)
  -influx.databaseNames array
     Comma-separated list of database names to return from /query and /influx/query API. This can be needed for accepting data from Telegraf plugins such as https://github.com/fangli/fluent-plugin-influxdb
     Supports an array of values separated by comma or specified via multiple flags.
     Each array item can contain comma inside single-quoted or double-quoted string, {}, [] and () braces.
  -influx.forceStreamMode
     Force stream mode parsing for ingested data. See https://docs.victoriametrics.com/victoriametrics/integrations/influxdb/
  -influx.maxLineSize size
     The maximum size in bytes for a single InfluxDB line during parsing. Applicable for stream mode only. See https://docs.victoriametrics.com/victoriametrics/integrations/influxdb/
     Supports the following optional suffixes for size values: KB, MB, GB, TB, KiB, MiB, GiB, TiB (default 262144)
  -influx.maxRequestSize size
     The maximum size in bytes of a single InfluxDB request. Applicable for batch mode only. See https://docs.victoriametrics.com/victoriametrics/integrations/influxdb/
     Supports the following optional suffixes for size values: KB, MB, GB, TB, KiB, MiB, GiB, TiB (default 67108864)
  -influxDBLabel string
     Default label for the DB name sent over '?db={db_name}' query parameter (default "db")
  -influxListenAddr string
     TCP and UDP address to listen for InfluxDB line protocol data. Usually :8089 must be set. Doesn't work if empty. This flag isn't needed when ingesting data over HTTP - just send it to http://<vmagent>:8429/write . See also -influxListenAddr.useProxyProtocol
  -influxListenAddr.useProxyProtocol
     Whether to use proxy protocol for connections accepted at -influxListenAddr . See https://www.haproxy.org/download/1.8/doc/proxy-protocol.txt
  -influxMeasurementFieldSeparator string
     Separator for '{measurement}{separator}{field_name}' metric name when inserted via InfluxDB line protocol (default "_")
  -influxSkipMeasurement
     Uses '{field_name}' as a metric name while ignoring '{measurement}' and '-influxMeasurementFieldSeparator'
  -influxSkipSingleField
     Uses '{measurement}' instead of '{measurement}{separator}{field_name}' for metric name if InfluxDB line contains only a single field
  -influxTrimTimestamp duration
     Trim timestamps for InfluxDB line protocol data to this duration. Minimum practical duration is 1ms. Higher duration (i.e. 1s) may be used for reducing disk space usage for timestamp data (default 1ms)
  -insert.maxQueueDuration duration
     The maximum duration to wait in the queue when -maxConcurrentInserts concurrent insert requests are executed (default 1m0s)
  -internStringCacheExpireDuration duration
     The expiry duration for caches for interned strings. See https://en.wikipedia.org/wiki/String_interning . See also -internStringMaxLen and -internStringDisableCache (default 6m0s)
  -internStringDisableCache
     Whether to disable caches for interned strings. This may reduce memory usage at the cost of higher CPU usage. See https://en.wikipedia.org/wiki/String_interning . See also -internStringCacheExpireDuration and -internStringMaxLen
  -internStringMaxLen int
     The maximum length for strings to intern. A lower limit may save memory at the cost of higher CPU usage. See https://en.wikipedia.org/wiki/String_interning . See also -internStringDisableCache and -internStringCacheExpireDuration (default 500)
  -loggerDisableTimestamps
     Whether to disable writing timestamps in logs
  -loggerErrorsPerSecondLimit int
     Per-second limit on the number of ERROR messages. If more than the given number of errors are emitted per second, the remaining errors are suppressed. Zero values disable the rate limit
  -loggerFormat string
     Format for logs. Possible values: default, json (default "default")
  -loggerJSONFields string
     Allows renaming fields in JSON formatted logs. Example: "ts:timestamp,msg:message" renames "ts" to "timestamp" and "msg" to "message". Supported fields: ts, level, caller, msg
  -loggerLevel string
     Minimum level of errors to log. Possible values: INFO, WARN, ERROR, FATAL, PANIC (default "INFO")
  -loggerMaxArgLen int
     The maximum length of a single logged argument. Longer arguments are replaced with 'arg_start..arg_end', where 'arg_start' and 'arg_end' is prefix and suffix of the arg with the length not exceeding -loggerMaxArgLen / 2 (default 5000)
  -loggerOutput string
     Output for the logs. Supported values: stderr, stdout (default "stderr")
  -loggerTimezone string
     Timezone to use for timestamps in logs. Timezone must be a valid IANA Time Zone. For example: America/New_York, Europe/Berlin, Etc/GMT+3 or Local (default "UTC")
  -loggerWarnsPerSecondLimit int
     Per-second limit on the number of WARN messages. If more than the given number of warns are emitted per second, then the remaining warns are suppressed. Zero values disable the rate limit
  -maxConcurrentInserts int
     The maximum number of concurrent insert requests. Set higher value when clients send data over slow networks. Default value depends on the number of available CPU cores. It should work fine in most cases since it minimizes resource usage. See also -insert.maxQueueDuration (default 2*cgroup.AvailableCPUs())
  -maxIngestionRate int
     The maximum number of samples vmagent can receive per second. Data ingestion is paused when the limit is exceeded. By default there are no limits on samples ingestion rate. See also -remoteWrite.rateLimit
  -maxInsertRequestSize size
     The maximum size in bytes of a single Prometheus remote_write API request
     Supports the following optional suffixes for size values: KB, MB, GB, TB, KiB, MiB, GiB, TiB (default 33554432)
  -maxLabelNameLen int
     The maximum length of label names in the accepted time series. Series with longer label name are ignored. In this case the vm_rows_ignored_total{reason="too_long_label_name"} metric at /metrics page is incremented
  -maxLabelValueLen int
     The maximum length of label values in the accepted time series. Series with longer label value are ignored. In this case the vm_rows_ignored_total{reason="too_long_label_value"} metric at /metrics page is incremented
  -maxLabelsPerTimeseries int
     The maximum number of labels per time series to be accepted. Series with superfluous labels are ignored. In this case the vm_rows_ignored_total{reason="too_many_labels"} metric at /metrics page is incremented
  -mdx.label -remoteWrite.url
     Optional label value in the form 'name=value' used to identify VictoriaMetrics metrics for MDX. Metrics containing the specified label are forwarded to -remoteWrite.url endpoints configured with `-remoteWrite.mdx.enable=true`.
  -memory.allowedBytes size
     Allowed size of system memory VictoriaMetrics caches may occupy. This option overrides -memory.allowedPercent if set to a non-zero value. Too low a value may increase the cache miss rate usually resulting in higher CPU and disk IO usage. Too high a value may evict too much data from the OS page cache resulting in higher disk IO usage. The process may behave unexpectedly if this flag is set too small (e.g., 1 byte).
     Supports the following optional suffixes for size values: KB, MB, GB, TB, KiB, MiB, GiB, TiB (default 0)
  -memory.allowedPercent float
     Allowed percent of system memory VictoriaMetrics caches may occupy. See also -memory.allowedBytes. Too low a value may increase cache miss rate usually resulting in higher CPU and disk IO usage. Too high a value may evict too much data from the OS page cache which will result in higher disk IO usage (default 60)
  -metrics.exposeMetadata
     Whether to expose TYPE and HELP metadata at the /metrics page, which is exposed at -httpListenAddr . The metadata may be needed when the /metrics page is consumed by systems, which require this information. For example, Managed Prometheus in Google Cloud - https://cloud.google.com/stackdriver/docs/managed-prometheus/troubleshooting#missing-metric-type
  -metricsAuthKey value
     Auth key for /metrics endpoint. It must be passed via authKey query arg. It overrides -httpAuth.*
     Flag value can be read from the given file when using -metricsAuthKey=file:///abs/path/to/file or -metricsAuthKey=file://./relative/path/to/file.
     Flag value can be read from the given http/https url when using -metricsAuthKey=http://host/path or -metricsAuthKey=https://host/path
  -newrelic.maxInsertRequestSize size
     The maximum size in bytes of a single NewRelic request to /newrelic/infra/v2/metrics/events/bulk
     Supports the following optional suffixes for size values: KB, MB, GB, TB, KiB, MiB, GiB, TiB (default 67108864)
  -opentelemetry.convertMetricNamesToPrometheus
     Whether to convert only metric names into Prometheus-compatible format for the metrics ingested via OpenTelemetry protocol; see https://docs.victoriametrics.com/victoriametrics/integrations/opentelemetry/
  -opentelemetry.ignoreResourceAttributes array
     Control which resource attributes to ignore, can only be set when 'opentelemetry.promoteAllResourceAttributes' is true.
     Supports an array of values separated by comma or specified via multiple flags.
     Each array item can contain comma inside single-quoted or double-quoted string, {}, [] and () braces.
  -opentelemetry.labelNameUnderscoreSanitization
     Whether to enable prepending of 'key' to labels starting with '_' when -opentelemetry.usePrometheusNaming is enabled. Reserved labels starting with '__' are not modified. See https://docs.victoriametrics.com/victoriametrics/integrations/opentelemetry/ (default true)
  -opentelemetry.maxRequestSize size
     The maximum size in bytes of a single OpenTelemetry request
     Supports the following optional suffixes for size values: KB, MB, GB, TB, KiB, MiB, GiB, TiB (default 67108864)
  -opentelemetry.promoteAllResourceAttributes
     Whether to promote all resource attributes to labels, except for the ones configured with 'opentelemetry.ignoreResourceAttributes'. (default true)
  -opentelemetry.promoteResourceAttributes array
     Promote specific list of resource attributes to labels.
     Supports an array of values separated by comma or specified via multiple flags.
     Each array item can contain comma inside single-quoted or double-quoted string, {}, [] and () braces.
  -opentelemetry.promoteScopeMetadata
     Whether to promote OTel scope metadata (i.e. name, version, schema URL, and attributes) to metric labels. (default true)
  -opentelemetry.usePrometheusNaming
     Whether to convert metric names and labels into Prometheus-compatible format for the metrics ingested via OpenTelemetry protocol; see https://docs.victoriametrics.com/victoriametrics/integrations/opentelemetry/
  -opentsdbHTTPListenAddr string
     TCP address to listen for OpenTSDB HTTP put requests. Usually :4242 must be set. Doesn't work if empty. See also -opentsdbHTTPListenAddr.useProxyProtocol
  -opentsdbHTTPListenAddr.useProxyProtocol
     Whether to use proxy protocol for connections accepted at -opentsdbHTTPListenAddr . See https://www.haproxy.org/download/1.8/doc/proxy-protocol.txt
  -opentsdbListenAddr string
     TCP and UDP address to listen for OpenTSDB metrics. Telnet put messages and HTTP /api/put messages are simultaneously served on TCP port. Usually :4242 must be set. Doesn't work if empty. See also -opentsdbListenAddr.useProxyProtocol
  -opentsdbListenAddr.useProxyProtocol
     Whether to use proxy protocol for connections accepted at -opentsdbListenAddr . See https://www.haproxy.org/download/1.8/doc/proxy-protocol.txt
  -opentsdbTrimTimestamp duration
     Trim timestamps for OpenTSDB 'telnet put' data to this duration. Minimum practical duration is 1s. Higher duration (i.e. 1m) may be used for reducing disk space usage for timestamp data (default 1s)
  -opentsdbhttp.maxInsertRequestSize size
     The maximum size of OpenTSDB HTTP put request
     Supports the following optional suffixes for size values: KB, MB, GB, TB, KiB, MiB, GiB, TiB (default 33554432)
  -opentsdbhttpTrimTimestamp duration
     Trim timestamps for OpenTSDB HTTP data to this duration. Minimum practical duration is 1ms. Higher duration (i.e. 1s) may be used for reducing disk space usage for timestamp data (default 1ms)
  -pprofAuthKey value
     Auth key for /debug/pprof/* endpoints. It must be passed via authKey query arg. It overrides -httpAuth.*
     Flag value can be read from the given file when using -pprofAuthKey=file:///abs/path/to/file or -pprofAuthKey=file://./relative/path/to/file.
     Flag value can be read from the given http/https url when using -pprofAuthKey=http://host/path or -pprofAuthKey=https://host/path
  -prevCacheRemovalPercent float
     Items in the previous caches are removed when the percent of requests it serves becomes lower than this value. Higher values reduce memory usage at the cost of higher CPU usage. See also -cacheExpireDuration (default 0.1)
  -promscrape.azureSDCheckInterval duration
     Interval for checking for changes in Azure. This works only if azure_sd_configs is configured in '-promscrape.config' file. See https://docs.victoriametrics.com/victoriametrics/sd_configs/#azure_sd_configs for details (default 1m0s)
  -promscrape.cluster.memberLabel string
     If non-empty, then the label with this name and the -promscrape.cluster.memberNum value is added to all the scraped metrics. See https://docs.victoriametrics.com/victoriametrics/vmagent/#scraping-big-number-of-targets for more info
  -promscrape.cluster.memberNum string
     The number of vmagent instance in the cluster of scrapers. It must be a unique value in the range 0 ... promscrape.cluster.membersCount-1 across scrapers in the cluster. Can be specified as pod name of Kubernetes StatefulSet - pod-name-Num, where Num is a numeric part of pod name. See also -promscrape.cluster.memberLabel . See https://docs.victoriametrics.com/victoriametrics/vmagent/#scraping-big-number-of-targets for more info (default "0")
  -promscrape.cluster.memberURLTemplate string
     An optional template for URL to access vmagent instance with the given -promscrape.cluster.memberNum value. Every %d occurrence in the template is substituted with -promscrape.cluster.memberNum at urls to vmagent instances responsible for scraping the given target at /service-discovery page. For example -promscrape.cluster.memberURLTemplate='http://vmagent-%d:8429/targets'. See https://docs.victoriametrics.com/victoriametrics/vmagent/#scraping-big-number-of-targets for more details
  -promscrape.cluster.membersCount int
     The number of members in a cluster of scrapers. Each member must have a unique -promscrape.cluster.memberNum in the range 0 ... promscrape.cluster.membersCount-1 . Each member then scrapes roughly 1/N of all the targets. By default, cluster scraping is disabled, i.e. a single scraper scrapes all the targets. See https://docs.victoriametrics.com/victoriametrics/vmagent/#scraping-big-number-of-targets for more info (default 1)
  -promscrape.cluster.name string
     Optional name of the cluster. If multiple vmagent clusters scrape the same targets, then each cluster must have unique name in order to properly de-duplicate samples received from these clusters. See https://docs.victoriametrics.com/victoriametrics/vmagent/#scraping-big-number-of-targets for more info
  -promscrape.cluster.replicationFactor int
     The number of members in the cluster, which scrape the same targets. If the replication factor is greater than 1, then the deduplication must be enabled at remote storage side. See https://docs.victoriametrics.com/victoriametrics/vmagent/#scraping-big-number-of-targets for more info (default 1)
  -promscrape.cluster.shardByLabels array
     Optional list of target labels, which will be used for sharding targets among cluster members if -promscrape.cluster.membersCount is greater than 1. If none of the specified labels are found in a target, then all the target labels will be used for sharding. See https://docs.victoriametrics.com/victoriametrics/vmagent/#scraping-big-number-of-targets for more info
     Supports an array of values separated by comma or specified via multiple flags.
     Each array item can contain comma inside single-quoted or double-quoted string, {}, [] and () braces.
  -promscrape.config string
     Optional path to Prometheus config file with 'scrape_configs' section containing targets to scrape. The path can point to local file and to http url. See https://docs.victoriametrics.com/victoriametrics/single-server-victoriametrics/#how-to-scrape-prometheus-exporters-such-as-node-exporter for details
  -promscrape.config.dryRun
     Checks -promscrape.config file for errors and unsupported fields and then exits. Returns non-zero exit code on parsing errors and emits these errors to stderr. See also -promscrape.config.strictParse command-line flag. Pass -loggerLevel=ERROR if you don't need to see info messages in the output.
  -promscrape.config.strictParse
     Whether to deny unsupported fields in -promscrape.config . Set to false in order to silently skip unsupported fields (default true)
  -promscrape.configCheckInterval duration
     Interval for checking for changes in -promscrape.config file. By default, the checking is disabled. See how to reload -promscrape.config file at https://docs.victoriametrics.com/victoriametrics/vmagent/#configuration-update
  -promscrape.consul.waitTime duration
     Wait time used by Consul service discovery. Default value is used if not set
  -promscrape.consulSDCheckInterval duration
     Interval for checking for changes in Consul. This works only if consul_sd_configs is configured in '-promscrape.config' file. See https://docs.victoriametrics.com/victoriametrics/sd_configs/#consul_sd_configs for details (default 30s)
  -promscrape.consulagentSDCheckInterval duration
     Interval for checking for changes in Consul Agent. This works only if consulagent_sd_configs is configured in '-promscrape.config' file. See https://docs.victoriametrics.com/victoriametrics/sd_configs/#consulagent_sd_configs for details (default 30s)
  -promscrape.digitaloceanSDCheckInterval duration
     Interval for checking for changes in digital ocean. This works only if digitalocean_sd_configs is configured in '-promscrape.config' file. See https://docs.victoriametrics.com/victoriametrics/sd_configs/#digitalocean_sd_configs for details (default 1m0s)
  -promscrape.disableCompression
     Whether to disable sending 'Accept-Encoding: gzip' request headers to all the scrape targets. This may reduce CPU usage on scrape targets at the cost of higher network bandwidth utilization. It is possible to set 'disable_compression: true' individually per each 'scrape_config' section in '-promscrape.config' for fine-grained control
  -promscrape.disableKeepAlive
     Whether to disable HTTP keep-alive connections when scraping all the targets. This may be useful when targets has no support for HTTP keep-alive connection. It is possible to set 'disable_keepalive: true' individually per each 'scrape_config' section in '-promscrape.config' for fine-grained control. Note that disabling HTTP keep-alive may increase load on both vmagent and scrape targets
  -promscrape.discovery.concurrency int
     The maximum number of concurrent requests to Prometheus autodiscovery API (Consul, Kubernetes, etc.) (default 100)
  -promscrape.discovery.concurrentWaitTime duration
     The maximum duration for waiting to perform API requests if more than -promscrape.discovery.concurrency requests are simultaneously performed (default 1m0s)
  -promscrape.dnsSDCheckInterval duration
     Interval for checking for changes in dns. This works only if dns_sd_configs is configured in '-promscrape.config' file. See https://docs.victoriametrics.com/victoriametrics/sd_configs/#dns_sd_configs for details (default 30s)
  -promscrape.dockerSDCheckInterval duration
     Interval for checking for changes in docker. This works only if docker_sd_configs is configured in '-promscrape.config' file. See https://docs.victoriametrics.com/victoriametrics/sd_configs/#docker_sd_configs for details (default 30s)
  -promscrape.dockerswarmSDCheckInterval duration
     Interval for checking for changes in dockerswarm. This works only if dockerswarm_sd_configs is configured in '-promscrape.config' file. See https://docs.victoriametrics.com/victoriametrics/sd_configs/#dockerswarm_sd_configs for details (default 30s)
  -promscrape.dropOriginalLabels
     Whether to drop original labels for scrape targets at /targets and /api/v1/targets pages. This may be needed for reducing memory usage when original labels for big number of scrape targets occupy big amounts of memory. Note that this reduces debuggability for improper per-target relabeling configs
  -promscrape.ec2SDCheckInterval duration
     Interval for checking for changes in ec2. This works only if ec2_sd_configs is configured in '-promscrape.config' file. See https://docs.victoriametrics.com/victoriametrics/sd_configs/#ec2_sd_configs for details (default 1m0s)
  -promscrape.eurekaSDCheckInterval duration
     Interval for checking for changes in eureka. This works only if eureka_sd_configs is configured in '-promscrape.config' file. See https://docs.victoriametrics.com/victoriametrics/sd_configs/#eureka_sd_configs for details (default 30s)
  -promscrape.fileSDCheckInterval duration
     Interval for checking for changes in 'file_sd_config'. See https://docs.victoriametrics.com/victoriametrics/sd_configs/#file_sd_configs for details (default 1m0s)
  -promscrape.gceSDCheckInterval duration
     Interval for checking for changes in gce. This works only if gce_sd_configs is configured in '-promscrape.config' file. See https://docs.victoriametrics.com/victoriametrics/sd_configs/#gce_sd_configs for details (default 1m0s)
  -promscrape.hetznerSDCheckInterval duration
     Interval for checking for changes in Hetzner API. This works only if hetzner_sd_configs is configured in '-promscrape.config' file. See https://docs.victoriametrics.com/victoriametrics/sd_configs/#hetzner_sd_configs for details (default 1m0s)
  -promscrape.httpSDCheckInterval duration
     Interval for checking for changes in http endpoint service discovery. This works only if http_sd_configs is configured in '-promscrape.config' file. See https://docs.victoriametrics.com/victoriametrics/sd_configs/#http_sd_configs for details (default 1m0s)
  -promscrape.kubernetes.apiServerTimeout duration
     How frequently to reload the full state from Kubernetes API server (default 30m0s)
  -promscrape.kubernetes.attachNamespaceMetadataAll
     Whether to set attach_metadata.namespace=true for all the kubernetes_sd_configs at -promscrape.config . It is possible to set attach_metadata.namespace=false individually per each kubernetes_sd_configs . See https://docs.victoriametrics.com/victoriametrics/sd_configs/#kubernetes_sd_configs
  -promscrape.kubernetes.attachNodeMetadataAll
     Whether to set attach_metadata.node=true for all the kubernetes_sd_configs at -promscrape.config . It is possible to set attach_metadata.node=false individually per each kubernetes_sd_configs . See https://docs.victoriametrics.com/victoriametrics/sd_configs/#kubernetes_sd_configs
  -promscrape.kubernetes.useHTTP2Client
     Whether to use HTTP/2 client for connection to Kubernetes API server. This may reduce amount of concurrent connections to API server when watching for a big number of Kubernetes objects.
  -promscrape.kubernetesSDCheckInterval duration
     Interval for checking for changes in Kubernetes API server. This works only if kubernetes_sd_configs is configured in '-promscrape.config' file. See https://docs.victoriametrics.com/victoriametrics/sd_configs/#kubernetes_sd_configs for details (default 30s)
  -promscrape.kumaSDCheckInterval duration
     Interval for checking for changes in kuma service discovery. This works only if kuma_sd_configs is configured in '-promscrape.config' file. See https://docs.victoriametrics.com/victoriametrics/sd_configs/#kuma_sd_configs for details (default 30s)
  -promscrape.marathonSDCheckInterval duration
     Interval for checking for changes in Marathon REST API. This works only if marathon_sd_configs is configured in '-promscrape.config' file. See https://docs.victoriametrics.com/victoriametrics/sd_configs/#marathon_sd_configs for details (default 30s)
  -promscrape.maxDroppedTargets int
     The maximum number of droppedTargets to show at /api/v1/targets page. Increase this value if your setup drops more scrape targets during relabeling and you need investigating labels for all the dropped targets. Note that the increased number of tracked dropped targets may result in increased memory usage (default 10000)
  -promscrape.maxResponseHeadersSize size
     The maximum size of http response headers from Prometheus scrape targets
     Supports the following optional suffixes for size values: KB, MB, GB, TB, KiB, MiB, GiB, TiB (default 4096)
  -promscrape.maxScrapeSize size
     The maximum size of uncompressed scrape response in bytes to process from Prometheus targets. Bigger uncompressed responses are rejected. See also max_scrape_size option at https://docs.victoriametrics.com/victoriametrics/sd_configs/#scrape_configs
     Supports the following optional suffixes for size values: KB, MB, GB, TB, KiB, MiB, GiB, TiB (default 16777216)
  -promscrape.minResponseSizeForStreamParse size
     The minimum target response size for automatic switching to stream parsing mode, which can reduce memory usage. See https://docs.victoriametrics.com/victoriametrics/vmagent/#stream-parsing-mode
     Supports the following optional suffixes for size values: KB, MB, GB, TB, KiB, MiB, GiB, TiB (default 1000000)
  -promscrape.noStaleMarkers
     Whether to disable sending Prometheus stale markers for metrics when scrape target disappears. This option may reduce memory usage if stale markers aren't needed for your setup. This option also disables populating the scrape_series_added metric. See https://prometheus.io/docs/concepts/jobs_instances/#automatically-generated-labels-and-time-series
  -promscrape.nomad.waitTime duration
     Wait time used by Nomad service discovery. Default value is used if not set
  -promscrape.nomadSDCheckInterval duration
     Interval for checking for changes in Nomad. This works only if nomad_sd_configs is configured in '-promscrape.config' file. See https://docs.victoriametrics.com/victoriametrics/sd_configs/#nomad_sd_configs for details (default 30s)
  -promscrape.openstackSDCheckInterval duration
     Interval for checking for changes in openstack API server. This works only if openstack_sd_configs is configured in '-promscrape.config' file. See https://docs.victoriametrics.com/victoriametrics/sd_configs/#openstack_sd_configs for details (default 30s)
  -promscrape.ovhcloudSDCheckInterval duration
     Interval for checking for changes in OVH Cloud API. This works only if ovhcloud_sd_configs is configured in '-promscrape.config' file. See https://docs.victoriametrics.com/victoriametrics/sd_configs/#ovhcloud_sd_configs for details (default 30s)
  -promscrape.puppetdbSDCheckInterval duration
     Interval for checking for changes in PuppetDB API. This works only if puppetdb_sd_configs is configured in '-promscrape.config' file. See https://docs.victoriametrics.com/victoriametrics/sd_configs/#puppetdb_sd_configs for details (default 30s)
  -promscrape.seriesLimitPerTarget int
     Optional limit on the number of unique time series a single scrape target can expose. See https://docs.victoriametrics.com/victoriametrics/vmagent/#cardinality-limiter for more info
  -promscrape.streamParse
     Whether to enable stream parsing for metrics obtained from scrape targets. This may be useful for reducing memory usage when millions of metrics are exposed per each scrape target. It is possible to set 'stream_parse: true' individually per each 'scrape_config' section in '-promscrape.config' for fine-grained control
  -promscrape.suppressDuplicateScrapeTargetErrors
     Whether to suppress 'duplicate scrape target' errors; see https://docs.victoriametrics.com/victoriametrics/vmagent/#troubleshooting for details
  -promscrape.suppressScrapeErrors
     Whether to suppress scrape errors logging. The last error for each target is always available at '/targets' page even if scrape errors logging is suppressed. See also -promscrape.suppressScrapeErrorsDelay
  -promscrape.suppressScrapeErrorsDelay duration
     The delay for suppressing repeated scrape errors logging per each scrape targets. This may be used for reducing the number of log lines related to scrape errors. See also -promscrape.suppressScrapeErrors
  -promscrape.vultrSDCheckInterval duration
     Interval for checking for changes in Vultr. This works only if vultr_sd_configs is configured in '-promscrape.config' file. See https://docs.victoriametrics.com/victoriametrics/sd_configs/#vultr_sd_configs for details (default 30s)
  -promscrape.yandexcloudSDCheckInterval duration
     Interval for checking for changes in Yandex Cloud API. This works only if yandexcloud_sd_configs is configured in '-promscrape.config' file. See https://docs.victoriametrics.com/victoriametrics/sd_configs/#yandexcloud_sd_configs for details (default 30s)
  -pushmetrics.disableCompression
     Whether to disable request body compression when pushing metrics to every -pushmetrics.url
  -pushmetrics.extraLabel array
     Optional labels to add to metrics pushed to every -pushmetrics.url . For example, -pushmetrics.extraLabel='instance="foo"' adds instance="foo" label to all the metrics pushed to every -pushmetrics.url
     Supports an array of values separated by comma or specified via multiple flags.
     Each array item can contain comma inside single-quoted or double-quoted string, {}, [] and () braces.
  -pushmetrics.header array
     Optional HTTP request header to send to every -pushmetrics.url . For example, -pushmetrics.header='Authorization: Basic foobar' adds 'Authorization: Basic foobar' header to every request to every -pushmetrics.url
     Supports an array of values separated by comma or specified via multiple flags.
     Each array item can contain comma inside single-quoted or double-quoted string, {}, [] and () braces.
  -pushmetrics.interval duration
     Interval for pushing metrics to every -pushmetrics.url (default 10s)
  -pushmetrics.url array
     Optional URL to push metrics exposed at /metrics page. See https://docs.victoriametrics.com/victoriametrics/single-server-victoriametrics/#push-metrics . By default, metrics exposed at /metrics page aren't pushed to any remote storage
     Supports an array of values separated by comma or specified via multiple flags.
     Each array item can contain comma inside single-quoted or double-quoted string, {}, [] and () braces.
  -reloadAuthKey value
     Auth key for /-/reload http endpoint. It must be passed via authKey query arg. It overrides -httpAuth.*
     Flag value can be read from the given file when using -reloadAuthKey=file:///abs/path/to/file or -reloadAuthKey=file://./relative/path/to/file.
     Flag value can be read from the given http/https url when using -reloadAuthKey=http://host/path or -reloadAuthKey=https://host/path
  -remoteWrite.aws.accessKey array
     Optional AWS AccessKey to use for the corresponding -remoteWrite.url if -remoteWrite.aws.useSigv4 is set
     Supports an array of values separated by comma or specified via multiple flags.
     Each array item can contain comma inside single-quoted or double-quoted string, {}, [] and () braces.
  -remoteWrite.aws.ec2Endpoint array
     Optional AWS EC2 API endpoint to use for the corresponding -remoteWrite.url if -remoteWrite.aws.useSigv4 is set
     Supports an array of values separated by comma or specified via multiple flags.
     Each array item can contain comma inside single-quoted or double-quoted string, {}, [] and () braces.
  -remoteWrite.aws.region array
     Optional AWS region to use for the corresponding -remoteWrite.url if -remoteWrite.aws.useSigv4 is set
     Supports an array of values separated by comma or specified via multiple flags.
     Each array item can contain comma inside single-quoted or double-quoted string, {}, [] and () braces.
  -remoteWrite.aws.roleARN array
     Optional AWS roleARN to use for the corresponding -remoteWrite.url if -remoteWrite.aws.useSigv4 is set
     Supports an array of values separated by comma or specified via multiple flags.
     Each array item can contain comma inside single-quoted or double-quoted string, {}, [] and () braces.
  -remoteWrite.aws.secretKey array
     Optional AWS SecretKey to use for the corresponding -remoteWrite.url if -remoteWrite.aws.useSigv4 is set
     Supports an array of values separated by comma or specified via multiple flags.
     Each array item can contain comma inside single-quoted or double-quoted string, {}, [] and () braces.
  -remoteWrite.aws.service array
     Optional AWS Service to use for the corresponding -remoteWrite.url if -remoteWrite.aws.useSigv4 is set. Defaults to "aps"
     Supports an array of values separated by comma or specified via multiple flags.
     Each array item can contain comma inside single-quoted or double-quoted string, {}, [] and () braces.
  -remoteWrite.aws.stsEndpoint array
     Optional AWS STS API endpoint to use for the corresponding -remoteWrite.url if -remoteWrite.aws.useSigv4 is set
     Supports an array of values separated by comma or specified via multiple flags.
     Each array item can contain comma inside single-quoted or double-quoted string, {}, [] and () braces.
  -remoteWrite.aws.useSigv4 array
     Enables SigV4 request signing for the corresponding -remoteWrite.url. It is expected that other -remoteWrite.aws.* command-line flags are set if sigv4 request signing is enabled
     Supports array of values separated by comma or specified via multiple flags.
     Empty values are set to false.
  -remoteWrite.basicAuth.password array
     Optional basic auth password to use for the corresponding -remoteWrite.url
     Supports an array of values separated by comma or specified via multiple flags.
     Each array item can contain comma inside single-quoted or double-quoted string, {}, [] and () braces.
  -remoteWrite.basicAuth.passwordFile array
     Optional path to basic auth password to use for the corresponding -remoteWrite.url. The file is re-read every second
     Supports an array of values separated by comma or specified via multiple flags.
     Each array item can contain comma inside single-quoted or double-quoted string, {}, [] and () braces.
  -remoteWrite.basicAuth.username array
     Optional basic auth username to use for the corresponding -remoteWrite.url
     Supports an array of values separated by comma or specified via multiple flags.
     Each array item can contain comma inside single-quoted or double-quoted string, {}, [] and () braces.
  -remoteWrite.basicAuth.usernameFile array
     Optional path to basic auth username to use for the corresponding -remoteWrite.url. The file is re-read every second
     Supports an array of values separated by comma or specified via multiple flags.
     Each array item can contain comma inside single-quoted or double-quoted string, {}, [] and () braces.
  -remoteWrite.bearerToken array
     Optional bearer auth token to use for the corresponding -remoteWrite.url
     Supports an array of values separated by comma or specified via multiple flags.
     Each array item can contain comma inside single-quoted or double-quoted string, {}, [] and () braces.
  -remoteWrite.bearerTokenFile array
     Optional path to bearer token file to use for the corresponding -remoteWrite.url. The token is re-read from the file every second
     Supports an array of values separated by comma or specified via multiple flags.
     Each array item can contain comma inside single-quoted or double-quoted string, {}, [] and () braces.
  -remoteWrite.disableMetadata array
     Whether to disable sending metadata to the corresponding -remoteWrite.url. By default, metadata sending is controlled by the global -enableMetadata flag
     Supports array of values separated by comma or specified via multiple flags.
     Empty values are set to false.
  -remoteWrite.disableOnDiskQueue array
     Whether to disable storing pending data to -remoteWrite.tmpDataPath when the remote storage system at the corresponding -remoteWrite.url cannot keep up with the data ingestion rate. See https://docs.victoriametrics.com/victoriametrics/vmagent/#disabling-on-disk-persistence . See also -remoteWrite.dropSamplesOnOverload
     Supports array of values separated by comma or specified via multiple flags.
     Empty values are set to false.
  -remoteWrite.dropSamplesOnOverload
     Whether to drop samples when -remoteWrite.disableOnDiskQueue is set and if the samples cannot be pushed into the configured -remoteWrite.url systems in a timely manner. See https://docs.victoriametrics.com/victoriametrics/vmagent/#disabling-on-disk-persistence
  -remoteWrite.flushInterval duration
     Interval for flushing the data to remote storage. This option takes effect only when less than -remoteWrite.maxRowsPerBlock data points per -remoteWrite.flushInterval are pushed to -remoteWrite.url (default 1s)
  -remoteWrite.forcePromProto array
     Whether to force Prometheus remote write protocol for sending data to the corresponding -remoteWrite.url . See https://docs.victoriametrics.com/victoriametrics/vmagent/#victoriametrics-remote-write-protocol
     Supports array of values separated by comma or specified via multiple flags.
     Empty values are set to false.
  -remoteWrite.forceVMProto array
     Whether to force VictoriaMetrics remote write protocol for sending data to the corresponding -remoteWrite.url . See https://docs.victoriametrics.com/victoriametrics/vmagent/#victoriametrics-remote-write-protocol
     Supports array of values separated by comma or specified via multiple flags.
     Empty values are set to false.
  -remoteWrite.headers array
     Optional HTTP headers to send with each request to the corresponding -remoteWrite.url. For example, -remoteWrite.headers='My-Auth:foobar' would send 'My-Auth: foobar' HTTP header with every request to the corresponding -remoteWrite.url. Multiple headers must be delimited by '^^': -remoteWrite.headers='header1:value1^^header2:value2'
     Supports an array of values separated by comma or specified via multiple flags.
     Each array item can contain comma inside single-quoted or double-quoted string, {}, [] and () braces.
  -remoteWrite.inmemoryQueues array
     The number of additional workers per each -remoteWrite.url, which send only recently ingested data from the in-memory queue, while the file-based queue at -remoteWrite.tmpDataPath is drained by workers configured via -remoteWrite.queues. This reduces delivery lag for fresh samples when the file-based queue contains a backlog accumulated during remote storage outages. (default 0)
     Supports array of values separated by comma or specified via multiple flags.
     Empty values are set to default value.
  -remoteWrite.keepDanglingQueues
     Keep persistent queues contents at -remoteWrite.tmpDataPath in case there are no matching -remoteWrite.url. Useful when -remoteWrite.url is changed temporarily and persistent queue files will be needed later on.
  -remoteWrite.label array
     Optional label in the form 'name=value' to add to all the metrics before sending them to all -remoteWrite.url.
     Supports an array of values separated by comma or specified via multiple flags.
     Each array item can contain comma inside single-quoted or double-quoted string, {}, [] and () braces.
  -remoteWrite.maxBlockSize size
     The maximum block size to send to remote storage. Bigger blocks may improve performance at the cost of the increased memory usage. See also -remoteWrite.maxRowsPerBlock
     Supports the following optional suffixes for size values: KB, MB, GB, TB, KiB, MiB, GiB, TiB (default 8388608)
  -remoteWrite.maxDailySeries int
     The maximum number of unique series vmagent can send to remote storage systems during the last 24 hours. Excess series are logged and dropped. This can be useful for limiting series churn rate. Setting this flag to '-1' sets limit to maximum possible value (2147483647) which is useful in order to enable series tracking without enforcing limits. See https://docs.victoriametrics.com/victoriametrics/vmagent/#cardinality-limiter
  -remoteWrite.maxDiskUsagePerURL array
     The maximum file-based buffer size in bytes at -remoteWrite.tmpDataPath for each -remoteWrite.url. When buffer size reaches the configured maximum, then old data is dropped when adding new data to the buffer. Buffered data is stored in ~500MB chunks. It is recommended to set the value for this flag to a multiple of the block size 500MB. Disk usage is unlimited if the value is set to 0
     Supports the following optional suffixes for size values: KB, MB, GB, TB, KiB, MiB, GiB, TiB. (default 0)
     Supports array of values separated by comma or specified via multiple flags.
     Empty values are set to default value.
  -remoteWrite.maxHourlySeries int
     The maximum number of unique series vmagent can send to remote storage systems during the last hour. Excess series are logged and dropped. This can be useful for limiting series cardinality. Setting this flag to '-1' sets limit to maximum possible value (2147483647) which is useful in order to enable series tracking without enforcing limits. See https://docs.victoriametrics.com/victoriametrics/vmagent/#cardinality-limiter
  -remoteWrite.maxMetadataPerBlock int
     The maximum number of metadata to send in each block to remote storage. Higher number may improve performance at the cost of the increased memory usage. See also -remoteWrite.maxBlockSize (default 5000)
  -remoteWrite.maxRowsPerBlock int
     The maximum number of samples to send in each block to remote storage. Higher number may improve performance at the cost of the increased memory usage. See also -remoteWrite.maxBlockSize (default 10000)
  -remoteWrite.mdx.enable array
     Whether to only retain metrics from VictoriaMetrics services before sending them to the corresponding -remoteWrite.url. Please see https://docs.victoriametrics.com/victoriametrics/vmagent/#monitoring-data-exchange
     Supports array of values separated by comma or specified via multiple flags.
     Empty values are set to false.
  -remoteWrite.oauth2.clientID array
     Optional OAuth2 clientID to use for the corresponding -remoteWrite.url
     Supports an array of values separated by comma or specified via multiple flags.
     Each array item can contain comma inside single-quoted or double-quoted string, {}, [] and () braces.
  -remoteWrite.oauth2.clientSecret array
     Optional OAuth2 clientSecret to use for the corresponding -remoteWrite.url
     Supports an array of values separated by comma or specified via multiple flags.
     Each array item can contain comma inside single-quoted or double-quoted string, {}, [] and () braces.
  -remoteWrite.oauth2.clientSecretFile array
     Optional OAuth2 clientSecretFile to use for the corresponding -remoteWrite.url
     Supports an array of values separated by comma or specified via multiple flags.
     Each array item can contain comma inside single-quoted or double-quoted string, {}, [] and () braces.
  -remoteWrite.oauth2.endpointParams array
     Optional OAuth2 endpoint parameters to use for the corresponding -remoteWrite.url . The endpoint parameters must be set in JSON format: {"param1":"value1",...,"paramN":"valueN"}
     Supports an array of values separated by comma or specified via multiple flags.
     Each array item can contain comma inside single-quoted or double-quoted string, {}, [] and () braces.
  -remoteWrite.oauth2.scopes array
     Optional OAuth2 scopes to use for the corresponding -remoteWrite.url. Scopes must be delimited by ';'
     Supports an array of values separated by comma or specified via multiple flags.
     Each array item can contain comma inside single-quoted or double-quoted string, {}, [] and () braces.
  -remoteWrite.oauth2.tokenUrl array
     Optional OAuth2 tokenURL to use for the corresponding -remoteWrite.url
     Supports an array of values separated by comma or specified via multiple flags.
     Each array item can contain comma inside single-quoted or double-quoted string, {}, [] and () braces.
  -remoteWrite.proxyURL array
     Optional proxy URL for writing data to the corresponding -remoteWrite.url. Supported proxies: http, https, socks5. Example: -remoteWrite.proxyURL=socks5://proxy:1234
     Supports an array of values separated by comma or specified via multiple flags.
     Each array item can contain comma inside single-quoted or double-quoted string, {}, [] and () braces.
  -remoteWrite.queues array
     The number of concurrent queues to each -remoteWrite.url. Set more queues if default number of queues isn't enough for sending high volume of collected data to remote storage. Default value depends on the number of available CPU cores. It should work fine in most cases since it minimizes resource usage (default 2*cgroup.AvailableCPUs())
     Supports array of values separated by comma or specified via multiple flags.
     Empty values are set to default value.
  -remoteWrite.rateLimit array
     Optional rate limit in bytes per second for data sent to the corresponding -remoteWrite.url. By default, the rate limit is disabled. It can be useful for limiting load on remote storage when big amounts of buffered data is sent after temporary unavailability of the remote storage. See also -maxIngestionRate (default 0)
     Supports array of values separated by comma or specified via multiple flags.
     Empty values are set to default value.
  -remoteWrite.relabelConfig string
     Optional path to file with relabeling configs, which are applied to all the metrics before sending them to -remoteWrite.url. See also -remoteWrite.urlRelabelConfig. The path can point either to local file or to http url. See https://docs.victoriametrics.com/victoriametrics/relabeling/
  -remoteWrite.retryMaxInterval array
     The maximum delay between retry attempts to send a block of data to the corresponding -remoteWrite.url.  The delay doubles with each retry until this maximum is reached, after which it remains constant. See also -remoteWrite.retryMinInterval (default 1m0s)
     Supports array of values separated by comma or specified via multiple flags.
     Empty values are set to default value.
  -remoteWrite.retryMaxTime array
     The max time spent on retry attempts to send a block of data to the corresponding -remoteWrite.url. This flag is deprecated, use -remoteWrite.retryMaxInterval instead (default 1m0s)
     Supports array of values separated by comma or specified via multiple flags.
     Empty values are set to default value.
  -remoteWrite.retryMinInterval array
     The minimum delay between retry attempts to send a block of data to the corresponding -remoteWrite.url. Every next retry attempt will double the delay to prevent hammering of remote database. See also -remoteWrite.retryMaxInterval (default 1s)
     Supports array of values separated by comma or specified via multiple flags.
     Empty values are set to default value.
  -remoteWrite.roundDigits array
     Round metric values to this number of decimal digits after the point before writing them to remote storage. Examples: -remoteWrite.roundDigits=2 would round 1.236 to 1.24, while -remoteWrite.roundDigits=-1 would round 126.78 to 130. By default, digits rounding is disabled. Set it to 100 for disabling it for a particular remote storage. This option may be used for improving data compression for the stored metrics. See also -remoteWrite.significantFigures (default 100)
     Supports array of values separated by comma or specified via multiple flags.
     Empty values are set to default value.
  -remoteWrite.sendTimeout array
     Timeout for sending a single block of data to the corresponding -remoteWrite.url (default 1m0s)
     Supports array of values separated by comma or specified via multiple flags.
     Empty values are set to default value.
  -remoteWrite.shardByURL
     Whether to shard outgoing series across all the remote storage systems enumerated via -remoteWrite.url. By default the data is replicated across all the -remoteWrite.url . See https://docs.victoriametrics.com/victoriametrics/vmagent/#sharding-among-remote-storages . See also -remoteWrite.shardByURLReplicas
  -remoteWrite.shardByURL.ignoreLabels array
     Optional list of labels, which must be ignored when sharding outgoing samples among remote storage systems if -remoteWrite.shardByURL command-line flag is set. By default all the labels are used for sharding in order to gain even distribution of series over the specified -remoteWrite.url systems. See also -remoteWrite.shardByURL.labels
     Supports an array of values separated by comma or specified via multiple flags.
     Each array item can contain comma inside single-quoted or double-quoted string, {}, [] and () braces.
  -remoteWrite.shardByURL.labels array
     Optional list of labels, which must be used for sharding outgoing samples among remote storage systems if -remoteWrite.shardByURL command-line flag is set. By default all the labels are used for sharding in order to gain even distribution of series over the specified -remoteWrite.url systems. See also -remoteWrite.shardByURL.ignoreLabels
     Supports an array of values separated by comma or specified via multiple flags.
     Each array item can contain comma inside single-quoted or double-quoted string, {}, [] and () braces.
  -remoteWrite.shardByURLReplicas int
     How many copies of data to make among remote storage systems enumerated via -remoteWrite.url when -remoteWrite.shardByURL is set. See https://docs.victoriametrics.com/victoriametrics/vmagent/#sharding-among-remote-storages (default 1)
  -remoteWrite.showURL
     Whether to show -remoteWrite.url in the exported metrics. It is hidden by default, since it can contain sensitive info such as auth key
  -remoteWrite.significantFigures array
     The number of significant figures to leave in metric values before writing them to remote storage. See https://en.wikipedia.org/wiki/Significant_figures . Zero value saves all the significant figures. This option may be used for improving data compression for the stored metrics. See also -remoteWrite.roundDigits (default 0)
     Supports array of values separated by comma or specified via multiple flags.
     Empty values are set to default value.
  -remoteWrite.streamAggr.config array
     Optional path to file with stream aggregation config for the corresponding -remoteWrite.url. See https://docs.victoriametrics.com/victoriametrics/stream-aggregation/ . See also -remoteWrite.streamAggr.keepInput, -remoteWrite.streamAggr.dropInput and -remoteWrite.streamAggr.dedupInterval
     Supports an array of values separated by comma or specified via multiple flags.
     Each array item can contain comma inside single-quoted or double-quoted string, {}, [] and () braces.
  -remoteWrite.streamAggr.dedupInterval array
     Input samples are de-duplicated with this interval before optional aggregation with -remoteWrite.streamAggr.config at the corresponding -remoteWrite.url. See also -dedup.minScrapeInterval and https://docs.victoriametrics.com/victoriametrics/stream-aggregation/#deduplication (default 0s)
     Supports array of values separated by comma or specified via multiple flags.
     Empty values are set to default value.
  -remoteWrite.streamAggr.dropInput array
     Whether to drop input samples that not matching any rule in the corresponding -remoteWrite.streamAggr.config. By default, only matched raw samples are dropped, while unmatched samples are written to the corresponding -remoteWrite.url . See also -remoteWrite.streamAggr.keepInput and https://docs.victoriametrics.com/victoriametrics/stream-aggregation/
     Supports array of values separated by comma or specified via multiple flags.
     Empty values are set to false.
  -remoteWrite.streamAggr.dropInputLabels array
     An optional list of labels to drop from samples before stream de-duplication and aggregation with -remoteWrite.streamAggr.config and -remoteWrite.streamAggr.dedupInterval at the corresponding -remoteWrite.url. Multiple labels per remoteWrite.url must be delimited by '^^': -remoteWrite.streamAggr.dropInputLabels='replica^^az,replica'. See https://docs.victoriametrics.com/victoriametrics/stream-aggregation/#dropping-unneeded-labels
     Supports an array of values separated by comma or specified via multiple flags.
     Each array item can contain comma inside single-quoted or double-quoted string, {}, [] and () braces.
  -remoteWrite.streamAggr.enableWindows array
     Enables aggregation within fixed windows for all remote write's aggregators. This allows to get more precise results, but impacts resource usage as it requires twice more memory to store two states. See https://docs.victoriametrics.com/victoriametrics/stream-aggregation/#aggregation-windows.
     Supports array of values separated by comma or specified via multiple flags.
     Empty values are set to false.
  -remoteWrite.streamAggr.ignoreFirstIntervals array
     Number of aggregation intervals to skip after the start for the corresponding -remoteWrite.streamAggr.config at the corresponding -remoteWrite.url. Increase this value if you observe incorrect aggregation results after vmagent restarts. It could be caused by receiving buffered delayed data from clients pushing data into the vmagent. See https://docs.victoriametrics.com/victoriametrics/stream-aggregation/#ignore-aggregation-intervals-on-start (default 0)
     Supports array of values separated by comma or specified via multiple flags.
     Empty values are set to default value.
  -remoteWrite.streamAggr.ignoreOldSamples array
     Whether to ignore input samples with old timestamps outside the current aggregation interval for the corresponding -remoteWrite.streamAggr.config at the corresponding -remoteWrite.url. See https://docs.victoriametrics.com/victoriametrics/stream-aggregation/#ignoring-old-samples
     Supports array of values separated by comma or specified via multiple flags.
     Empty values are set to false.
  -remoteWrite.streamAggr.keepInput array
     Whether to keep input samples that match any rule in the corresponding -remoteWrite.streamAggr.config. By default, matched raw samples are aggregated and dropped, while unmatched samples are written to the corresponding -remoteWrite.url . See also -remoteWrite.streamAggr.dropInput and https://docs.victoriametrics.com/victoriametrics/stream-aggregation/
     Supports array of values separated by comma or specified via multiple flags.
     Empty values are set to false.
  -remoteWrite.tlsCAFile array
     Optional path to TLS CA file to use for verifying connections to the corresponding -remoteWrite.url. By default, system CA is used
     Supports an array of values separated by comma or specified via multiple flags.
     Each array item can contain comma inside single-quoted or double-quoted string, {}, [] and () braces.
  -remoteWrite.tlsCertFile array
     Optional path to client-side TLS certificate file to use when connecting to the corresponding -remoteWrite.url
     Supports an array of values separated by comma or specified via multiple flags.
     Each array item can contain comma inside single-quoted or double-quoted string, {}, [] and () braces.
  -remoteWrite.tlsHandshakeTimeout array
     The timeout for establishing tls connections to the corresponding -remoteWrite.url (default 20s)
     Supports array of values separated by comma or specified via multiple flags.
     Empty values are set to default value.
  -remoteWrite.tlsInsecureSkipVerify array
     Whether to skip tls verification when connecting to the corresponding -remoteWrite.url
     Supports array of values separated by comma or specified via multiple flags.
     Empty values are set to false.
  -remoteWrite.tlsKeyFile array
     Optional path to client-side TLS certificate key to use when connecting to the corresponding -remoteWrite.url
     Supports an array of values separated by comma or specified via multiple flags.
     Each array item can contain comma inside single-quoted or double-quoted string, {}, [] and () braces.
  -remoteWrite.tlsServerName array
     Optional TLS server name to use for connections to the corresponding -remoteWrite.url. By default, the server name from -remoteWrite.url is used
     Supports an array of values separated by comma or specified via multiple flags.
     Each array item can contain comma inside single-quoted or double-quoted string, {}, [] and () braces.
  -remoteWrite.tmpDataPath string
     Path to directory for storing pending data, which isn't sent to the configured -remoteWrite.url . See also -remoteWrite.maxDiskUsagePerURL and -remoteWrite.disableOnDiskQueue (default "vmagent-remotewrite-data")
  -remoteWrite.url array
     Remote storage URL to write data to. It must support either VictoriaMetrics remote write protocol or Prometheus remote_write protocol. Example url: http://<victoriametrics-host>:8428/api/v1/write . Pass multiple -remoteWrite.url options in order to replicate the collected data to multiple remote storage systems. The data can be sharded among the configured remote storage systems if -remoteWrite.shardByURL flag is set
     Supports an array of values separated by comma or specified via multiple flags.
     Each array item can contain comma inside single-quoted or double-quoted string, {}, [] and () braces.
  -remoteWrite.urlRelabelConfig array
     Optional path to relabel configs for the corresponding -remoteWrite.url. See also -remoteWrite.relabelConfig. The path can point either to local file or to http url. See https://docs.victoriametrics.com/victoriametrics/relabeling/
     Supports an array of values separated by comma or specified via multiple flags.
     Each array item can contain comma inside single-quoted or double-quoted string, {}, [] and () braces.
  -remoteWrite.vmProtoCompressLevel int
     The compression level for VictoriaMetrics remote write protocol. Higher values reduce network traffic at the cost of higher CPU usage. Negative values reduce CPU usage at the cost of increased network traffic. See https://docs.victoriametrics.com/victoriametrics/vmagent/#victoriametrics-remote-write-protocol
  -secret.flags array
     Comma-separated list of flag names with secret values. Values for these flags are hidden in logs and on /metrics page
     Supports an array of values separated by comma or specified via multiple flags.
     Each array item can contain comma inside single-quoted or double-quoted string, {}, [] and () braces.
  -sortLabels
     Whether to sort labels for incoming samples before writing them to all the configured remote storage systems. This may be needed for reducing memory usage at remote storage when the order of labels in incoming samples is random. For example, if m{k1="v1",k2="v2"} may be sent as m{k2="v2",k1="v1"}Enabled sorting for labels can slow down ingestion performance a bit
  -streamAggr.config string
     Optional path to file with stream aggregation config. See https://docs.victoriametrics.com/victoriametrics/stream-aggregation/ . See also -streamAggr.keepInput, -streamAggr.dropInput and -streamAggr.dedupInterval
  -streamAggr.dedupInterval duration
     Input samples are de-duplicated with this interval on aggregator before optional aggregation with -streamAggr.config . See also -dedup.minScrapeInterval and https://docs.victoriametrics.com/victoriametrics/stream-aggregation/#deduplication
  -streamAggr.dropInput
     Whether to drop input samples that not matching any rule in -streamAggr.config. By default, only matched raw samples are dropped, while unmatched samples are written to the remote storage. See also -streamAggr.keepInput and https://docs.victoriametrics.com/victoriametrics/stream-aggregation/
  -streamAggr.dropInputLabels array
     An optional list of labels to drop from samples for aggregator before stream de-duplication and aggregation . See https://docs.victoriametrics.com/victoriametrics/stream-aggregation/#dropping-unneeded-labels
     Supports an array of values separated by comma or specified via multiple flags.
     Each array item can contain comma inside single-quoted or double-quoted string, {}, [] and () braces.
  -streamAggr.enableWindows
     Enables aggregation within fixed windows for all global aggregators. This allows to get more precise results, but impacts resource usage as it requires twice more memory to store two states. See https://docs.victoriametrics.com/victoriametrics/stream-aggregation/#aggregation-windows.
  -streamAggr.ignoreFirstIntervals int
     Number of aggregation intervals to skip after the start for aggregator. Increase this value if you observe incorrect aggregation results after vmagent restarts. It could be caused by receiving unordered delayed data from clients pushing data into the vmagent. See https://docs.victoriametrics.com/victoriametrics/stream-aggregation/#ignore-aggregation-intervals-on-start
  -streamAggr.ignoreOldSamples
     Whether to ignore input samples with old timestamps outside the current aggregation interval for aggregator. See https://docs.victoriametrics.com/victoriametrics/stream-aggregation/#ignoring-old-samples
  -streamAggr.keepInput
     Whether to keep input samples that match any rule in -streamAggr.config. By default, matched raw samples are aggregated and dropped, while unmatched samples are written to the remote storage. See also -streamAggr.dropInput and https://docs.victoriametrics.com/victoriametrics/stream-aggregation/
  -tls array
     Whether to enable TLS for incoming HTTP requests at the given -httpListenAddr (aka https). -tlsCertFile and -tlsKeyFile must be set if -tls is set. See also -mtls
     Supports array of values separated by comma or specified via multiple flags.
     Empty values are set to false.
  -tlsCertFile array
     Path to file with TLS certificate for the corresponding -httpListenAddr if -tls is set. Prefer ECDSA certs instead of RSA certs as RSA certs are slower. The provided certificate file is automatically re-read every second, so it can be dynamically updated. See also -tlsAutocertHosts
     Supports an array of values separated by comma or specified via multiple flags.
     Each array item can contain comma inside single-quoted or double-quoted string, {}, [] and () braces.
  -tlsCipherSuites array
     Optional list of TLS cipher suites for incoming requests over HTTPS if -tls is set. See the list of supported cipher suites at https://pkg.go.dev/crypto/tls#pkg-constants
     Supports an array of values separated by comma or specified via multiple flags.
     Each array item can contain comma inside single-quoted or double-quoted string, {}, [] and () braces.
  -tlsKeyFile array
     Path to file with TLS key for the corresponding -httpListenAddr if -tls is set. The provided key file is automatically re-read every second, so it can be dynamically updated. See also -tlsAutocertHosts
     Supports an array of values separated by comma or specified via multiple flags.
     Each array item can contain comma inside single-quoted or double-quoted string, {}, [] and () braces.
  -tlsMinVersion array
     Optional minimum TLS version to use for the corresponding -httpListenAddr if -tls is set. Supported values: TLS10, TLS11, TLS12, TLS13
     Supports an array of values separated by comma or specified via multiple flags.
     Each array item can contain comma inside single-quoted or double-quoted string, {}, [] and () braces.
  -usePromCompatibleNaming
     Whether to replace characters unsupported by Prometheus with underscores in the ingested metric names and label names. For example, foo.bar{a.b='c'} is transformed into foo_bar{a_b='c'} during data ingestion if this flag is set. See https://prometheus.io/docs/concepts/data_model/#metric-names-and-labels
  -version
     Show VictoriaMetrics version
  -zabbixconnector.addDuplicateTagsSeparator string
     If set to non-empty value, enables merging of duplicate Zabbix tag values and set a separator for the values of these labels.
  -zabbixconnector.addEmptyTagsValue string
     If set to non-empty value, enables adding Zabbix tags without values to labels and set value for these labels.
  -zabbixconnector.addGroupsValue string
     If set to non-empty value, enables adding Zabbix host groups to labels and set value for these labels.
  -zabbixconnector.maxLineLen size
     The maximum length in bytes of a single line accepted by /zabbixconnector/api/v1/history
     Supports the following optional suffixes for size values: KB, MB, GB, TB, KiB, MiB, GiB, TiB (default 33554432)
Enterprise flags #
These flags are available only in VictoriaMetrics enterprise .
        -eula
     Deprecated, please use -license or -licenseFile flags instead. By specifying this flag, you confirm that you have an enterprise license and accept the ESA https://victoriametrics.com/legal/esa/ . This flag is available only in Enterprise binaries. See https://docs.victoriametrics.com/victoriametrics/enterprise/
  -gcp.pubsub.publish.byteThreshold int
     Publish a batch when its size in bytes reaches this value. See https://docs.victoriametrics.com/victoriametrics/integrations/pubsub/#writing-metrics . This flag is available only in Enterprise binaries. See https://docs.victoriametrics.com/victoriametrics/enterprise/ (default 1000000)
  -gcp.pubsub.publish.countThreshold int
     Publish a batch when it has this many messages. See https://docs.victoriametrics.com/victoriametrics/integrations/pubsub/#writing-metrics . This flag is available only in Enterprise binaries. See https://docs.victoriametrics.com/victoriametrics/enterprise/ (default 100)
  -gcp.pubsub.publish.credentialsFile string
     Path to file with GCP credentials to use for PubSub client. If not set, default credentials will be used (see Workload Identity for K8S or https://cloud.google.com/docs/authentication/application-default-credentials). See https://docs.victoriametrics.com/victoriametrics/integrations/pubsub/#writing-metrics . This flag is available only in Enterprise binaries. See https://docs.victoriametrics.com/victoriametrics/enterprise/
  -gcp.pubsub.publish.delayThreshold duration
     Publish a non-empty batch after this delay has passed. See https://docs.victoriametrics.com/victoriametrics/integrations/pubsub/#writing-metrics . This flag is available only in Enterprise binaries. See https://docs.victoriametrics.com/victoriametrics/enterprise/ (default 10ms)
  -gcp.pubsub.publish.maxOutstandingBytes int
     The maximum size of buffered messages to be published. If less than or equal to zero, this is disabled. See https://docs.victoriametrics.com/victoriametrics/integrations/pubsub/#writing-metrics . This flag is available only in Enterprise binaries. See https://docs.victoriametrics.com/victoriametrics/enterprise/ (default -1)
  -gcp.pubsub.publish.maxOutstandingMessages int
     The maximum number of buffered messages to be published. If less than or equal to zero, this is disabled. See https://docs.victoriametrics.com/victoriametrics/integrations/pubsub/#writing-metrics . This flag is available only in Enterprise binaries. See https://docs.victoriametrics.com/victoriametrics/enterprise/ (default 100)
  -gcp.pubsub.publish.timeout duration
     The maximum time that the client will attempt to publish a bundle of messages. See https://docs.victoriametrics.com/victoriametrics/integrations/pubsub/#writing-metrics . This flag is available only in Enterprise binaries. See https://docs.victoriametrics.com/victoriametrics/enterprise/ (default 1m0s)
  -gcp.pubsub.subscribe.credentialsFile string
     Path to file with GCP credentials to use for PubSub client. If not set, default credentials are used (see Workload Identity for K8S or https://cloud.google.com/docs/authentication/application-default-credentials ). See https://docs.victoriametrics.com/victoriametrics/integrations/pubsub/#reading-metrics . This flag is available only in Enterprise binaries. See https://docs.victoriametrics.com/victoriametrics/enterprise/
  -gcp.pubsub.subscribe.defaultMessageFormat string
     Default message format if -gcp.pubsub.subscribe.topicSubscription.messageFormat is missing. See https://docs.victoriametrics.com/victoriametrics/integrations/pubsub/#reading-metrics . This flag is available only in Enterprise binaries. See https://docs.victoriametrics.com/victoriametrics/enterprise/ (default "promremotewrite")
  -gcp.pubsub.subscribe.topicSubscription array
     GCP PubSub topic subscription in the format: projects/<project-id>/subscriptions/<subscription-name>. See https://docs.victoriametrics.com/victoriametrics/integrations/pubsub/#reading-metrics . This flag is available only in Enterprise binaries. See https://docs.victoriametrics.com/victoriametrics/enterprise/
     Supports an array of values separated by comma or specified via multiple flags.
     Each array item can contain comma inside single-quoted or double-quoted string, {}, [] and () braces.
  -gcp.pubsub.subscribe.topicSubscription.concurrency array
     The number of concurrently processed messages for topic subscription specified via -gcp.pubsub.subscribe.topicSubscription flag. See https://docs.victoriametrics.com/victoriametrics/integrations/pubsub/#reading-metrics . This flag is available only in Enterprise binaries. See https://docs.victoriametrics.com/victoriametrics/enterprise/ (default 0)
     Supports array of values separated by comma or specified via multiple flags.
     Empty values are set to default value.
  -gcp.pubsub.subscribe.topicSubscription.isGzipped array
     Enables gzip decompression for messages payload at the corresponding -gcp.pubsub.subscribe.topicSubscription. Only prometheus, jsonline, graphite and influx formats accept gzipped messages. See https://docs.victoriametrics.com/victoriametrics/integrations/pubsub/#reading-metrics . This flag is available only in Enterprise binaries. See https://docs.victoriametrics.com/victoriametrics/enterprise/
     Supports array of values separated by comma or specified via multiple flags.
     Empty values are set to false.
  -gcp.pubsub.subscribe.topicSubscription.messageFormat array
     Message format for the corresponding -gcp.pubsub.subscribe.topicSubscription. Valid formats: influx, prometheus, promremotewrite, graphite, jsonline . See https://docs.victoriametrics.com/victoriametrics/integrations/pubsub/#reading-metrics . This flag is available only in Enterprise binaries. See https://docs.victoriametrics.com/victoriametrics/enterprise/
     Supports an array of values separated by comma or specified via multiple flags.
     Each array item can contain comma inside single-quoted or double-quoted string, {}, [] and () braces.
  -kafka.consumer.topic array
     Kafka topic names for data consumption. See https://docs.victoriametrics.com/victoriametrics/integrations/kafka/#reading-metrics . This flag is available only in Enterprise binaries. See https://docs.victoriametrics.com/victoriametrics/enterprise/
     Supports an array of values separated by comma or specified via multiple flags.
     Each array item can contain comma inside single-quoted or double-quoted string, {}, [] and () braces.
  -kafka.consumer.topic.basicAuth.password array
     Optional basic auth password for -kafka.consumer.topic.  Must be used in conjunction with any supported auth methods for kafka client, specified by flag -kafka.consumer.topic.options='security.protocol=SASL_SSL;sasl.mechanisms=PLAIN' . See https://docs.victoriametrics.com/victoriametrics/integrations/kafka/#reading-metrics . This flag is available only in Enterprise binaries. See https://docs.victoriametrics.com/victoriametrics/enterprise/
     Supports an array of values separated by comma or specified via multiple flags.
     Each array item can contain comma inside single-quoted or double-quoted string, {}, [] and () braces.
  -kafka.consumer.topic.basicAuth.username array
     Optional basic auth username for -kafka.consumer.topic. Must be used in conjunction with any supported auth methods for kafka client, specified by flag -kafka.consumer.topic.options='security.protocol=SASL_SSL;sasl.mechanisms=PLAIN' . See https://docs.victoriametrics.com/victoriametrics/integrations/kafka/#reading-metrics . This flag is available only in Enterprise binaries. See https://docs.victoriametrics.com/victoriametrics/enterprise/
     Supports an array of values separated by comma or specified via multiple flags.
     Each array item can contain comma inside single-quoted or double-quoted string, {}, [] and () braces.
  -kafka.consumer.topic.brokers array
     List of brokers to connect for given topic, e.g. -kafka.consumer.topic.broker=host-1:9092;host-2:9092 . See https://docs.victoriametrics.com/victoriametrics/integrations/kafka/#reading-metrics . This flag is available only in Enterprise binaries. See https://docs.victoriametrics.com/victoriametrics/enterprise/
     Supports an array of values separated by comma or specified via multiple flags.
     Each array item can contain comma inside single-quoted or double-quoted string, {}, [] and () braces.
  -kafka.consumer.topic.concurrency array
     Configures consumer concurrency for topic specified via -kafka.consumer.topic flag. See https://docs.victoriametrics.com/victoriametrics/integrations/kafka/#reading-metrics . This flag is available only in Enterprise binaries. See https://docs.victoriametrics.com/victoriametrics/enterprise/ (default 1)
     Supports array of values separated by comma or specified via multiple flags.
     Empty values are set to default value.
  -kafka.consumer.topic.defaultFormat string
     Expected data format in the topic if -kafka.consumer.topic.format is skipped. See https://docs.victoriametrics.com/victoriametrics/integrations/kafka/#reading-metrics . This flag is available only in Enterprise binaries. See https://docs.victoriametrics.com/victoriametrics/enterprise/ (default "promremotewrite")
  -kafka.consumer.topic.format array
     data format for corresponding kafka topic. Valid formats: influx, prometheus, promremotewrite, graphite, jsonline and opentelemetry. See https://docs.victoriametrics.com/victoriametrics/integrations/kafka/#reading-metrics . This flag is available only in Enterprise binaries. See https://docs.victoriametrics.com/victoriametrics/enterprise/
     Supports an array of values separated by comma or specified via multiple flags.
     Each array item can contain comma inside single-quoted or double-quoted string, {}, [] and () braces.
  -kafka.consumer.topic.groupID array
     Defines group.id for topic. See https://docs.victoriametrics.com/victoriametrics/integrations/kafka/#reading-metrics . This flag is available only in Enterprise binaries. See https://docs.victoriametrics.com/victoriametrics/enterprise/
     Supports an array of values separated by comma or specified via multiple flags.
     Each array item can contain comma inside single-quoted or double-quoted string, {}, [] and () braces.
  -kafka.consumer.topic.isGzipped array
     Enables gzip setting for topic messages payload. Only prometheus, jsonline, graphite and influx formats accept gzipped messages.See https://docs.victoriametrics.com/victoriametrics/integrations/kafka/#reading-metrics . This flag is available only in Enterprise binaries. See https://docs.victoriametrics.com/victoriametrics/enterprise/
     Supports array of values separated by comma or specified via multiple flags.
     Empty values are set to false.
  -kafka.consumer.topic.options array
     Optional key=value;key1=value2 settings for topic consumer. See full configuration options at https://github.com/edenhill/librdkafka/blob/master/CONFIGURATION.md . See https://docs.victoriametrics.com/victoriametrics/integrations/kafka/#reading-metrics . This flag is available only in Enterprise binaries. See https://docs.victoriametrics.com/victoriametrics/enterprise/
     Supports an array of values separated by comma or specified via multiple flags.
     Each array item can contain comma inside single-quoted or double-quoted string, {}, [] and () braces.
  -license string
     License key for VictoriaMetrics Enterprise. See https://victoriametrics.com/products/enterprise/ . Trial Enterprise license can be obtained from https://victoriametrics.com/products/enterprise/trial/ . This flag is available only in Enterprise binaries. The license key can be also passed via file specified by -licenseFile command-line flag
  -license.forceOffline
     Whether to enable offline verification for VictoriaMetrics Enterprise license key, which has been passed either via -license or via -licenseFile command-line flag. The issued license key must support offline verification feature. Contact info@victoriametrics.com if you need offline license verification. This flag is available only in Enterprise binaries
  -licenseFile string
     Path to file with license key for VictoriaMetrics Enterprise. See https://victoriametrics.com/products/enterprise/ . Trial Enterprise license can be obtained from https://victoriametrics.com/products/enterprise/trial/ . This flag is available only in Enterprise binaries. The license key can be also passed inline via -license command-line flag
  -licenseFile.reloadInterval duration
     Interval for reloading the license file specified via -licenseFile. A non-positive value disables periodic and SIGHUP-triggered reloads of -licenseFile. See https://victoriametrics.com/products/enterprise/ . This flag is available only in Enterprise binaries (default 1h0m0s)
  -mtls array
     Whether to require valid client certificate for https requests to the corresponding -httpListenAddr . This flag works only if -tls flag is set. See also -mtlsCAFile . This flag is available only in Enterprise binaries. See https://docs.victoriametrics.com/victoriametrics/enterprise/
     Supports array of values separated by comma or specified via multiple flags.
     Empty values are set to false.
  -mtlsCAFile array
     Optional path to TLS Root CA for verifying client certificates at the corresponding -httpListenAddr when -mtls is enabled. By default the host system TLS Root CA is used for client certificate verification. This flag is available only in Enterprise binaries. See https://docs.victoriametrics.com/victoriametrics/enterprise/
     Supports an array of values separated by comma or specified via multiple flags.
     Each array item can contain comma inside single-quoted or double-quoted string, {}, [] and () braces.
  -tlsAutocertCacheDir string
     Directory to store TLS certificates issued via Let's Encrypt. Certificates are lost on restarts if this flag isn't set. This flag is available only in Enterprise binaries. See https://docs.victoriametrics.com/victoriametrics/enterprise/
  -tlsAutocertEmail string
     Contact email for the issued Let's Encrypt TLS certificates. See also -tlsAutocertHosts and -tlsAutocertCacheDir . This flag is available only in Enterprise binaries. See https://docs.victoriametrics.com/victoriametrics/enterprise/
  -tlsAutocertHosts array
     Optional hostnames for automatic issuing of Let's Encrypt TLS certificates. These hostnames must be reachable at -httpListenAddr . The -httpListenAddr must listen tcp port 443 . The -tlsCertFile and -tlsKeyFile must be unset when -tlsAutocertHosts is used . See also -tlsAutocertEmail and -tlsAutocertCacheDir . This flag is available only in Enterprise binaries. See https://docs.victoriametrics.com/victoriametrics/enterprise/
     Supports an array of values separated by comma or specified via multiple flags.
     Each array item can contain comma inside single-quoted or double-quoted string, {}, [] and () braces.
The section below contains backward-compatible anchors for links that were moved or renamed.
Relabeling #
Moved to Relabeling Cookbook .
Relabeling enhancements #
Moved to Relabeling Cookbook .
Graphite relabeling #
Moved to Relabeling Cookbook .
Relabel debug #
Moved to Relabeling Cookbook .
Debugging scrape targets #
Moved to Relabeling Cookbook .
Google PubSub integration #
Moved to integrations/pubsub .
Reading metrics from PubSub #
Moved to integrations/pubsub/#reading-metrics .
Consume metrics from multiple topics #
Moved to integrations/pubsub/#multiple-topics .
Command-line flags for PubSub consumer #
Moved to integrations/pubsub/#consumer-command-line-flags .
Writing metrics to PubSub #
Moved to integrations/pubsub/#writing-metrics .
Command-line flags for PubSub producer #
Moved to integrations/pubsub/#producer-command-line-flags .
Kafka integration #
Moved to integrations/kafka .
Reading metrics from Kafka #
Moved to integrations/kafka/#reading-metrics .
Command-line flags for Kafka consumer #
Moved to integrations/kafka/#consumer-command-line-flags .
Writing metrics to Kafka #
Moved to integrations/kafka/#writing-metrics .
Estimating message size and rate #
Moved to integrations/kafka/#estimating-message-size-and-rate .
Kafka broker authorization and authentication #
Moved to integrations/kafka/#kafka-broker-authorization-and-authentication .