vmalert executes a list of the given
alerting
or
recording
rules against configured -datasource.url. For sending alerting notifications
vmalert relies on Alertmanager
configured via -notifier.url flag.
Recording rules results are persisted via remote write protocols and require -remoteWrite.url to be configured.
vmalert is heavily inspired by Prometheus
implementation and aims to be compatible with its syntax.
Features #
- Integration with VictoriaMetrics, VictoriaLogs, VictoriaTraces, Graphite and Prometheus compatible storages. See Integrations for details;
- Prometheus alerting rules definition format support;
- Integration with Alertmanager starting from Alertmanager v0.16.0-alpha ;
- Keeps the alerts state on restarts ;
- Graphite datasource can be used for alerting and recording rules. See these docs ;
- Recording and Alerting rules backfilling (aka
replay). See these docs ; - Lightweight and without extra dependencies.
- Supports reusable templates for annotations;
- Load of recording and alerting rules from local filesystem, URL, GCS and S3;
- Detect alerting rules which don’t match any series .
Limitations #
vmalertexecute queries against remote datasource which has reliability risks because of the network. It is recommended to configure alerts thresholds and rules expressions with the understanding that network requests may fail;vmalertexecutes rules within a group sequentially, but persistence of execution results to remote storage is asynchronous. Hence, user shouldn’t rely on chaining of recording rules when result of previous recording rule is reused in the next one. See how to chain groups .
QuickStart #
To start using vmalert you will need the following things:
- list of rules - PromQL/MetricsQL/LogsQL/GraphiteQL expressions to execute;
- datasource address - a storage that vmalert integrates with for executing queries;
- notifier address [optional] - reachable Alert Manager instance for processing, aggregating alerts, and sending notifications. Please note, notifier address also supports Consul and DNS Service Discovery via config file .
- remote write address [optional] - remote write compatible storage to persist rules and alerts state info. To persist results to multiple destinations use vmagent configured with multiple remote writes as a proxy;
- remote read address [optional] - MetricsQL compatible datasource to restore alerts state from.
You can use the existing docker-compose environment as an example. It already contains vmalert configured with the list of alerting rules and integrated with Alert Manager and VictoriaMetrics.
Alternatively, build vmalert from sources:
      git clone https://github.com/VictoriaMetrics/VictoriaMetrics
cd VictoriaMetrics
make vmalert
Then run vmalert:
      ./bin/vmalert -rule=alert.rules \            # Path to the file with rules configuration. Supports wildcard and HTTP URL (S3/GCS are available in Enterprise).
    -datasource.url=http://localhost:8428 \  # VictoriaMetrics URL to query for rules evaluation. See other available Integrations above.
    -notifier.url=http://localhost:9093 \    # AlertManager URL (required if alerting rules are used)
    -notifier.url=http://127.0.0.1:9093 \    # AlertManager replica URL
    -remoteWrite.url=http://localhost:8428 \ # Remote write compatible storage to persist rules and alerts state info (required if recording rules are used)
    -remoteRead.url=http://localhost:8428 \  # MetricsQL compatible datasource to restore alerts state from
    -external.label=cluster=east-1 \         # External label to be applied for each rule
    -external.label=replica=a                # Multiple external labels may be set
To validate the syntax of configured rules simply run vmalert with -rule and -dryRun cmd-line flags.
Note there’s a separate -remoteWrite.url command-line flag to allow writing results of
alerting/recording rules into a different storage than the initial data that’s
queried. This allows using vmalert to aggregate data from a short-term,
high-frequency, high-cardinality storage into a long-term storage with
decreased cardinality and a bigger interval between samples.
See also
stream aggregation
.
See the full list of configuration flags in configuration section.
If you run multiple vmalert services for the same datasource or AlertManager and need to distinguish the results or alerts,
specify different -external.label command-line flags to indicate which vmalert generated them.
If rule result metrics have label that conflict with -external.label, vmalert will automatically rename
it with prefix exported_.
Configuration for recording and alerting rules is very similar to Prometheus rules and configured using YAML. Configuration examples may be found in testdata folder.
Every rule belongs to a group and every configuration file may contain arbitrary number of groups:
      groups:
  [ - <rule_group> ]
Groups #
Each group has the following attributes:
      # The name of the group. Must be unique within a file.
name: <string>

# How often rules in the group are evaluated.
[ interval: <duration> | default = -evaluationInterval flag ]

# Optional
# Group will be evaluated at the exact offset in the range of [0...interval].
# E.g. for Group with `interval: 1h` and `eval_offset: 5m` the evaluation will
# start at 5th minute of the hour.
# `eval_offset` also supports negative values, which means the evaluation will start at `interval-abs(eval_offset)` within [0...interval],
# For example, `eval_offset: -6m` is equivalent to `eval_offset: 4m` for `interval: 10m`.
# `interval` must be specified if `eval_offset` is used, and the `abs(eval_offset)` cannot exceed `interval`.
# `eval_offset` cannot be used with `eval_delay`, as group will be executed at the exact offset and `eval_delay` is ignored.
[ eval_offset: <duration> ]

# Optional
# Adjust the `time` parameter of group evaluation requests to compensate intentional query delay from the datasource.
# By default, the value is inherited from the `-rule.evalDelay` cmd-line flag - see its description for details.
# If group has `latency_offset` set in `params`, then it is recommended to set `eval_delay` equal to `latency_offset`.
# See https://github.com/VictoriaMetrics/VictoriaMetrics/issues/5155 and https://docs.victoriametrics.com/victoriametrics/keyconcepts/#query-latency.
[ eval_delay: <duration> ]

# Limit limits the number of alerts or recording results a single rule within this group can produce.
# If exceeded, the rule will be marked with an error and all its results will be discarded.
# 0 means no limit.
[ limit: <integer> | default = -rule.resultsLimit flag]

# How many rules execute at once within a group. Increasing concurrency may speed
# up group's evaluation duration (exposed via `vmalert_iteration_duration_seconds` metric).
[ concurrency: <integer> | default = 1 ]

# Optional type for expressions inside rules to override the `-rule.defaultRuleType(default is "prometheus")` cmd-line flag.
# Supported values: "graphite", "prometheus" and "vlogs"(check https://docs.victoriametrics.com/victorialogs/vmalert/ for details).
[ type: <string> ]

# Optional
# The evaluation timestamp will be aligned with group's interval,
# instead of using the actual timestamp that evaluation happens at.
#
# It is enabled by default to get more predictable results
# and to visually align with graphs plotted via Grafana or vmui.
# When comparing with raw queries, remember to use `step` equal to evaluation interval.
#
# See https://github.com/VictoriaMetrics/VictoriaMetrics/issues/5049
# Available starting from v1.95
[ eval_alignment: <bool> | default true]

# Optional list of HTTP URL parameters
# applied for all rules requests within a group
# For example:
#  params:
#    nocache: ["1"]                # disable caching for vmselect
#    denyPartialResponse: ["true"] # fail if one or more vmstorage nodes returned an error
#    extra_label: ["env=dev"]      # apply additional label filter "env=dev" for all requests
# see more details at https://docs.victoriametrics.com/victoriametrics/single-server-victoriametrics/#prometheus-querying-api-enhancements
params:
  [ <string>: [<string>, ...]]

# Optional list of HTTP headers in form `header-name: value`
# applied for all rules requests within a group
# For example:
#  headers:
#    - "CustomHeader: foo"
#    - "CustomHeader2: bar"
# Headers set via this param have priority over headers set via `-datasource.headers` flag.
headers:
  [ <string>, ...]

# Optional list of HTTP headers in form `header-name: value`
# applied for all alert notifications sent to notifiers
# generated by rules of this group.
# It has higher priority over headers defined in notifier config.
# For example:
#  notifier_headers:
#    - "TenantID: foo"
notifier_headers:
  [ <string>, ...]

# Optional list of labels added to every rule within a group.
# It has priority over the external labels.
# Labels are commonly used for adding environment
# or tenant-specific tag.
labels:
  [ <labelname>: <labelvalue> ... ]

rules:
  [ - <rule> ... ]

# Enable debug mode for all rules in the group.
# This can be overridden by the `debug` field in rule.
[ debug: <bool> | default = false ]
Rules #
Every rule contains an expr field for the expression to evaluate against the configured datasource.
Depending on group.type value or -rule.defaultRuleType cmd-line flag expression can be one of the following types:
prometheus(default) - PromQL or MetricsQL expression.vlogs- VictoriaLogs expression.graphite- Graphite expression.
There are two types of Rules:
- Alerting
-
Alerting rules allow defining alert conditions via
exprfield and to send notifications to Alertmanager if execution result is not empty (Prometheus alerting rules docs ). - Recording
-
Recording rules allow defining
exprwhich result will be then backfilled to configured-remoteWrite.url. Recording rules are used to precompute frequently needed or computationally expensive expressions and save their result as a new set of time series (Prometheus recording rules docs ).
vmalert forbids defining duplicates - rules with the same combination of name, expression and labels within one group.
Alerting rules #
The syntax for alerting rule is the following:
      # The name of the alert. Must be a valid metric name.
alert: <string>

# The expression to evaluate. The expression language depends on the type value.
# By default, PromQL/MetricsQL expression is used. Other available types are "graphite" and "vlogs".
# See https://docs.victoriametrics.com/victoriametrics/vmalert/#integrations
expr: <string>

# Alerts are considered firing once they have been returned for this long.
# Alerts which have not yet been fired for long enough are considered pending.
# If param is omitted or set to 0 then alerts will be immediately considered
# as firing once they return.
[ for: <duration> | default = 0s ]

# Alert will continue firing for this long even when the alerting expression no longer has results.
# This allows you to delay alert resolution.
[ keep_firing_for: <duration> | default = 0s ]

# Whether to print debug information into logs.
# Information includes alerts state changes and requests sent to the datasource.
# Please note, that if rule's query params contain sensitive
# information - it will be printed to logs.
# Logs are printed with INFO level, so make sure that -loggerLevel=INFO to see the output.
[ debug: <bool> | default = false ]

# Defines the number of rule's updates entries stored in memory
# and available for view on rule's Details page.
# Overrides `rule.updateEntriesLimit` value for this specific rule.
# Available starting from https://docs.victoriametrics.com/victoriametrics/changelog/#v1860
[ update_entries_limit: <integer> | default 0 ]

# Labels to add or overwrite labels from other external label sources, such as group labels, for each alert.
# Labels are merged with labels received from `expr` evaluation and uniquely identify each generated alert.
#
# In case of conflicts, original labels are kept with prefix `exported_`.
# As a special case, specifying a label with an empty string value removes the label from the result if it exists
# in the original query result; otherwise, it is ignored.
#
# Labels only support limited templating variables in https://docs.victoriametrics.com/victoriametrics/vmalert/#templating,
# including `$labels`, `$value` and `$expr`, to avoid breaking alert states or causing cardinality issue with results.
# Note: be careful set dynamic label values like `$value`, because each time the $value changes - the new alert will be
# generated which also break `for` condition.
labels:
  [ <labelname>: <tmpl_string> ]

# Annotations to add to each generated alert.
# Annotations could contain arbitrary dynamically generated data or templates - see https://docs.victoriametrics.com/victoriametrics/vmalert/#templating
annotations:
  [ <labelname>: <tmpl_string> ]
Recording rules #
The syntax for recording rules is the following:
      # The name of the time series to output to. Must be a valid metric name.
record: <string>

# The expression to evaluate. The expression language depends on the type value.
# By default, PromQL/MetricsQL expression is used. Other available types are "graphite" and "vlogs".
# See https://docs.victoriametrics.com/victoriametrics/vmalert/#integrations
expr: <string>

# Labels to add or overwrite labels from other external label sources, such as group labels, before storing the result.
#
# In case of conflicts, original labels are kept with prefix `exported_`.
# As a special case, specifying a label with an empty string value removes the label from the result if it exists
# in the original query result; otherwise, it is ignored.
#
# Labels do not support templating in https://docs.victoriametrics.com/victoriametrics/vmalert/#templating due to cardinality concerns. See https://github.com/VictoriaMetrics/VictoriaMetrics/issues/8171.
labels:
  [ <labelname>: <labelvalue> ]

# Whether to print debug information into logs.
# Information includes requests sent to the datasource.
# information - it will be printed to logs.
# Logs are printed with INFO level, so make sure that -loggerLevel=INFO to see the output.
[ debug: <bool> | default = false ]

# Defines the number of rule updates entries stored in memory
# and available for view on rule Details page.
# Overrides `rule.updateEntriesLimit` value for this specific rule.
[ update_entries_limit: <integer> | default 0 ]
For recording rules to work -remoteWrite.url must be specified.
Templating #
It is allowed to use Go templating in annotations and labels(with limited support) to format data, iterate over or execute expressions. The following variables are available in templating:
| Variable | Description | Example |
|---|---|---|
| $value or .Value | The current alert’s value. Avoid using value in labels, it may cause unexpected issues. | Number of connections is {{ $value }} |
| $activeAt or .ActiveAt | The moment of time
when alert became active (pending or firing). | http://vm-grafana.com/<dashboard-id>?viewPanel=<panel-id>&from={{($activeAt.Add (parseDurationTime \"-1h\")).UnixMilli}}&to={{($activeAt.Add (parseDurationTime \"1h\")).UnixMilli}} |
| $labels or .Labels | The list of labels of the current alert. Use as .Labels.<label_name>. When the label name contains ., such as cpu.mode, use {{ index .Labels "cpu.mode" }} to access label value instead. | Too high number of connections for {{ .Labels.instance }} |
| $type or .Type | The rule type: “graphite”, “prometheus” or “vlogs” | Link: /explore?left={"datasource":"{{ if eq .Type "vlogs" }}VictoriaLogs{{ else }}VictoriaMetrics{{ end }}","queries":[{"expr":"{{ .Expr }}"}]} |
| $alertID or .AlertID | The current alert’s ID generated by vmalert. | Link: /vmalert/alert?group_id={{.GroupID}}&alert_id={{.AlertID}} |
| $groupID or .GroupID | The current alert’s group ID generated by vmalert. | Link: /vmalert/alert?group_id={{.GroupID}}&alert_id={{.AlertID}} |
| $expr or .Expr | Alert’s expression. Can be used for generating links to Grafana or other systems. | /api/v1/query?query={{ $expr|queryEscape }} |
| $for or .For | Alert’s configured for param. | Number of connections is too high for more than {{ .For }} |
| $externalLabels or .ExternalLabels | List of labels configured via -external.label command-line flag. | Issues with {{ $labels.instance }} (datacenter-{{ $externalLabels.dc }}) |
| $externalURL or .ExternalURL | URL configured via -external.url command-line flag. Used for cases when vmalert is hidden behind proxy. | Visit {{ $externalURL }} for more details |
| $isPartial or .IsPartial | Indicates whether the latest rule query response from the datasource(that supports returning isPartial option, such as vmcluster) could be partial. | {{ if $isPartial }}WARNING: The latest alert state may be a false alarm due to a partial response from the datasource.{{ end }} |
Additionally, vmalert provides some extra templating functions listed in
template functions
and
reusable templates
.
Template functions #
vmalert provides the following template functions, which can be used during
templating
:
args arg0 ... argN- converts the input args into a map witharg0, …,argNkeys.externalURL- returns the value of-external.urlcommand-line flag.first- returns the first result from the input query results returned byqueryfunction.htmlEscape- escapes special chars in input string, so it can be safely embedded as a plaintext into HTML.humanize- converts the input number into human-readable format by adding metric prefixes . For example,100000is converted into100K.humanize1024- converts the input number into human-readable format with 1024 base. For example,1024is converted into 1ki`.humanizeDuration- converts the input number in seconds into human-readable duration.humanizePercentage- converts the input number to percentage. For example,0.123is converted into12.3%.humanizeTimestamp- converts the input unix timestamp into human-readable time.jsonEscape- JSON-encodes the input string.label name- returns the value of the label with the givennamefrom the input query result.match regex- matches the input string against the providedregex.now- returns the Unix timestamp in seconds at the time of the template evaluation. For example:{{ (now | toTime).Sub $activeAt }}will return the duration the alert has been active.parseDuration- parses the input string into duration in seconds. For example,1his parsed into3600.parseDurationTime- parses the input string into time.Duration .pathEscape- escapes the input string, so it can be safely put inside path part of URL.pathPrefix- returns the path part of the-external.urlcommand-line flag.query- executes query against-datasource.urland returns the query result. For example,{{ query "sort_desc(process_resident_memory_bytes)" | first | value }}executes thesort_desc(process_resident_memory_bytes)query at-datasource.urland returns the first result.queryEscape- escapes the input string, so it can be safely put inside query arg part of URL.quotesEscape- escapes the input string, so it can be safely embedded into JSON string.reReplaceAll regex repl- replaces all the occurrences of theregexin input string with therepl.safeHtml- marks the input string as safe to use in HTML context without the need to html-escape it.sortByLabel name- sorts the input query results by the label with the givenname.stripDomain- leaves the first part of the domain. For example,foo.bar.bazis converted tofoo. The port part is left in the output string. E.g.foo.bar:1234is converted intofoo:1234.stripPort- stripsportpart fromhost:portinput string.strvalue- returns the metric name from the input query result.title- converts the first letters of every input word to uppercase.toLower- converts all the chars in the input string to lowercase.toTime- converts the input unix timestamp to time.Time .formatTime layout- formats a Unix timestamp time using the given time layout . For example,{{ now | formatTime "2006-01-02T15:04:05Z07:00" }}returns the current time formatted as RFC3339.toUpper- converts all the chars in the input string to uppercase.value- returns the numeric value from the input query result.
Reusable templates #
Like in Alertmanager you can define reusable templates
to share same templates across annotations. Just define the templates in a file and
set the path via -rule.templates flag.
For example, template grafana.filter can be defined as following:
      {{ define "grafana.filter" -}}
  {{- $labels := .arg0 -}}
  {{- range $name, $label := . -}}
    {{- if (ne $name "arg0") -}}
      {{- ( or (index $labels $label) "All" ) | printf "&var-%s=%s" $label -}}
    {{- end -}}
  {{- end -}}
{{- end -}}
And then used in annotations:
      groups:
  - name: AlertGroupName
    rules:
      - alert: AlertName
        expr: any_metric > 100
        for: 30s
        labels:
          alertname: 'Any metric is too high'
          severity: 'warning'
        annotations:
          dashboard: '{{ $externalURL }}/d/dashboard?orgId=1{{ template "grafana.filter" (args .CommonLabels "account_id" "any_label") }}'
The -rule.templates flag supports wildcards so multiple files with templates can be loaded.
The content of -rule.templates can be also
hot reloaded
.
Alerts state on restarts #
vmalert holds alerts state in the memory. Restart of the vmalert process will reset the state of all active alerts
in the memory. To prevent vmalert from losing the state on restarts configure it to persist the state
to the remote database via the following flags:
-remoteWrite.url- URL to VictoriaMetrics (Single) or vminsert (Cluster).vmalertwill persist alerts state to the configured address in the form of time seriesALERTSandALERTS_FOR_STATEvia remote-write protocol. These time series can be queried from VictoriaMetrics just as any other time series. The state will be persisted to the configured address on each evaluation.-remoteRead.url- URL to VictoriaMetrics (Single) or vmselect (Cluster).vmalertwill try to restore alerts state from the configured address by querying time series with nameALERTS_FOR_STATE. The restore happens only once whenvmalertprocess starts, and only for the configured rules. Config hot reload doesn’t trigger state restore.
Both flags are required for proper state restoration. Restore process may fail if time series are missing
in configured -remoteRead.url, weren’t updated in the last 1h (controlled by -remoteRead.lookback)
or received state doesn’t match current vmalert rules configuration. vmalert marks successfully restored rules
with restored label in
web UI
.
Link to alert source #
Alerting notifications sent by vmalert always contain a source link. By default, the link format
is the following http://<vmalert-addr>/vmalert/alert?group_id=<group_id>&alert_id=<alert_id>. On click, it opens
vmalert
web UI
to show the alert status and its fields.
It is possible to override the link format. For example, to make the link to vmui specify the following cmd-line flags:
      ./bin/vmalert \
    -external.url=http://<vmui-addr> \  # the hostname and port for datasource vmui
    -external.alert.source='vmui/#/?g0.expr={{.Expr|queryEscape}}' # the path built using alert expr
Now, all source links will lead to http://<vmui-addr>/vmui/#/?g0.expr=$expr, where $expr is an alerting rule
expression.
The -external.alert.source cmd-line flag supports
templating
and allows using labels and extra data related to the alert. For example, see the following link to Grafana:
      ./bin/vmalert \
    -external.url=http://<grafana-addr> \  # the hostname and port for Grafana
    -external.alert.source='explore?left={"datasource":"{{ if eq .Type \"vlogs\" }}VictoriaLogs{{ else }}VictoriaMetrics{{ end }}","queries":[{"expr":{{ .Expr|jsonEscape|queryEscape }},"refId":"A"}],"range":{"from":"{{ .ActiveAt.UnixMilli }}","to":"now"}}'
In this example, -external.alert.source will lead to Grafana’s Explore page with expr field equal to alert expression,
and time range will be selected starting from "from":"{{ .ActiveAt.UnixMilli }}" when alert became active.
The datasource name is set to VictoriaLogs if rule’s type
Available from v1.117.0
(prometheus, vlogs or graphite) is vlogs.
Otherwise, it is set to VictoriaMetrics. See how we set alert source in docker
.
In addition to source link, some extra links could be added to alert’s
annotations
field. See how we use them
to link alerting rule and the corresponding panel on Grafana dashboard.
Multitenancy #
See how to use multitenancy in rules for VictoriaLogs .
There are the following approaches exist for alerting and recording rules across multiple tenants :
To run a separate
vmalertinstance per each tenant. The corresponding tenant must be specified in-datasource.urlcommand-line flag according to these docs . For example,/path/to/vmalert -datasource.url=http://vmselect:8481/select/123/prometheuswould run alerts againstAccountID=123. For recording rules the-remoteWrite.urlcommand-line flag must contain the url for the specific tenant as well. For example,-remoteWrite.url=http://vminsert:8480/insert/123/prometheuswould write recording rules toAccountID=123.To use the multitenant endpoint Available from v1.104.0 of vminsert as the
-remoteWrite.urland vmselect as the-datasource.url, addextra_labelwith tenant ID as an HTTP URL parameter for each group. For example, run vmalert using-datasource.url=http://vmselect:8481/select/multitenant/prometheus -remoteWrite.url=http://vminsert:8480/insert/multitenant/prometheus, along with the rule group:
      groups:
- name: rules_for_tenant_456:789
  params:
     extra_label: [vm_account_id=456,vm_project_id=789]
  rules:
    # Rules for accountID=456, projectID=789
The multitenant endpoint in vmselect is less efficient than specifying tenants in URL .
For security considerations, it is recommended restricting access to multitenant endpoints only to trusted sources, since untrusted source may break per-tenant data by writing unwanted samples or get access to data of arbitrary tenants.
- To specify the
tenantparameter for each rule group when-clusterModeis enabled in the enterprise version of vmalert . In this mode,-datasource.url,-remoteRead.urland-remoteWrite.urlmust contain only the hostname without tenant information, such as-datasource.url=http://vmselect:8481, andvmalertwill automatically append the specified tenant to the URLs for querying and writing:
      groups:
- name: rules_for_tenant_123
  tenant: "123"
  rules:
    # Rules for accountID=123

- name: rules_for_tenant_456:789
  tenant: "456:789"
  rules:
    # Rules for accountID=456, projectID=789
The results of alerting and recording rules contain vm_account_id and vm_project_id labels
if -clusterMode is enabled. These labels can be used during
templating
,
and help to identify to which account or project the triggered alert or produced recording belongs.
If -clusterMode is enabled and the tenant in a particular group is missing, then the tenant value
is obtained from -defaultTenant.prometheus or -defaultTenant.graphite depending on the type of the group.
The enterprise version of vmalert is available in vmutils-*-enterprise.tar.gz files
at release page
and in *-enterprise
tags at Docker Hub
and Quay
.
Reading rules from object storage #
Enterprise version
of vmalert may read alerting and recording rules
from object storage:
./bin/vmalert -rule=s3://bucket/dir/alert.ruleswould read rules from the given path at S3 bucket./bin/vmalert -rule=gs://bucket/dir/alert.ruleswould read rules from the given path at GCS bucket
S3 and GCS paths support only matching by prefix, e.g. s3://bucket/dir/rule_ matches
all files with prefix rule_ in the folder dir.
The following command-line flags can be used for fine-tuning access to S3 and GCS:
-s3.credsFilePath- path to file with GCS or S3 credentials. Credentials are loaded from default locations if not set.-s3.configFilePath- path to file with S3 configs. Configs are loaded from default location if not set.-s3.configProfile- profile name for S3 configs. If no set, the value of the environment variable will be loaded (AWS_PROFILEorAWS_DEFAULT_PROFILE).-s3.customEndpoint- custom S3 endpoint for use with S3-compatible storages (e.g. MinIO). S3 is used if not set.-s3.forcePathStyle- prefixing endpoint with bucket name when set false, true by default.
Topology examples #
The following sections are showing how vmalert may be used and configured
for different scenarios.
Please note, not all flags in examples are required:
-remoteWrite.urland-remoteRead.urlare optional and are needed only if you have recording rules or want to store alerts state onvmalertrestarts;-notifier.urlis optional and is needed only if you have alerting rules.
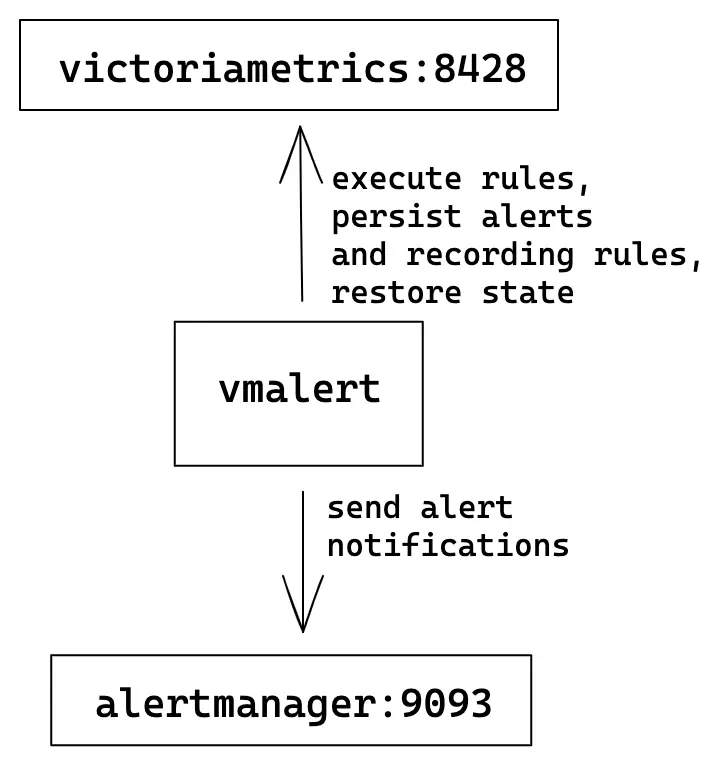
Single-node VictoriaMetrics #
The simplest configuration where one single-node VM server is used for rules execution, storing recording rules results and alerts state.
vmalert configuration flags:
      ./bin/vmalert -rule=rules.yml  \                    # Path to the file with rules configuration. Supports wildcard
    -datasource.url=http://victoriametrics:8428 \   # VM-single addr for executing rules expressions
    -remoteWrite.url=http://victoriametrics:8428 \  # VM-single addr to persist alerts state and recording rules results
    -remoteRead.url=http://victoriametrics:8428 \   # VM-single addr for restoring alerts state after restart
    -notifier.url=http://alertmanager:9093          # AlertManager addr to send alerts when they trigger
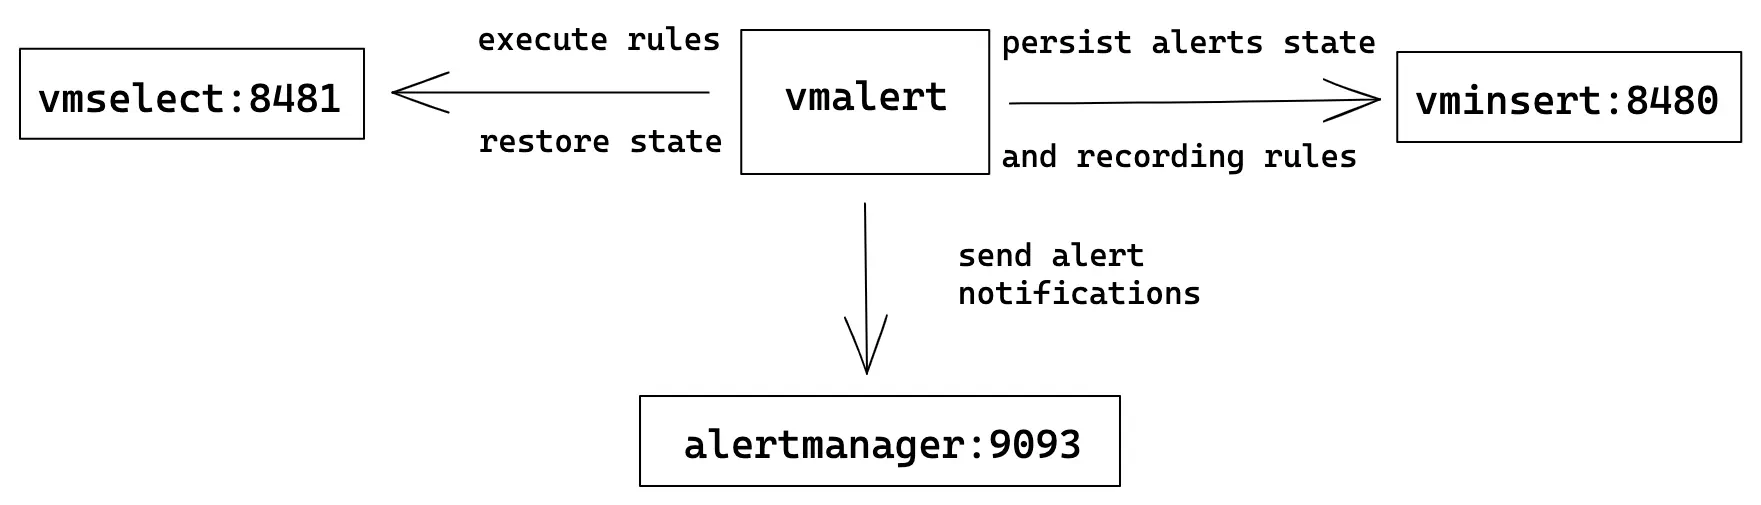
Cluster VictoriaMetrics #
In
cluster mode
VictoriaMetrics has separate components for writing and reading path:
vminsert and vmselect components respectively. vmselect is used for executing rules expressions
and vminsert is used to persist recording rules results and alerts state.
Cluster mode could have multiple vminsert and vmselect components.
vmalert configuration flags:
      ./bin/vmalert -rule=rules.yml  \                                # Path to the file with rules configuration. Supports wildcard
    -datasource.url=http://vmselect:8481/select/0/prometheus    # vmselect addr for executing rules expressions
    -remoteWrite.url=http://vminsert:8480/insert/0/prometheus   # vminsert addr to persist alerts state and recording rules results
    -remoteRead.url=http://vmselect:8481/select/0/prometheus    # vmselect addr for restoring alerts state after restart
    -notifier.url=http://alertmanager:9093                      # AlertManager addr to send alerts when they trigger
In case when you want to spread the load on these components - add balancers before them and configure
vmalert with balancer addresses. Please, see more about
VictoriaMetrics cluster architecture
.
HA vmalert #
For High Availability(HA) user can run multiple identically configured vmalert instances.
It means all of them will execute the same rules, write state and results to
the same destinations, and send alert notifications to multiple configured
Alertmanagers.
vmalert configuration flags:
      ./bin/vmalert -rule=rules.yml \                   # Path to the file with rules configuration. Supports wildcard
    -datasource.url=http://victoriametrics:8428 \   # VM-single addr for executing rules expressions
    -remoteWrite.url=http://victoriametrics:8428 \  # VM-single addr to persist alerts state and recording rules results
    -remoteRead.url=http://victoriametrics:8428 \   # VM-single addr for restoring alerts state after restart
    -notifier.url=http://alertmanager1:9093 \       # Multiple AlertManager addresses to send alerts when they trigger
    -notifier.url=http://alertmanagerN:9093         # The same alert will be sent to all configured notifiers
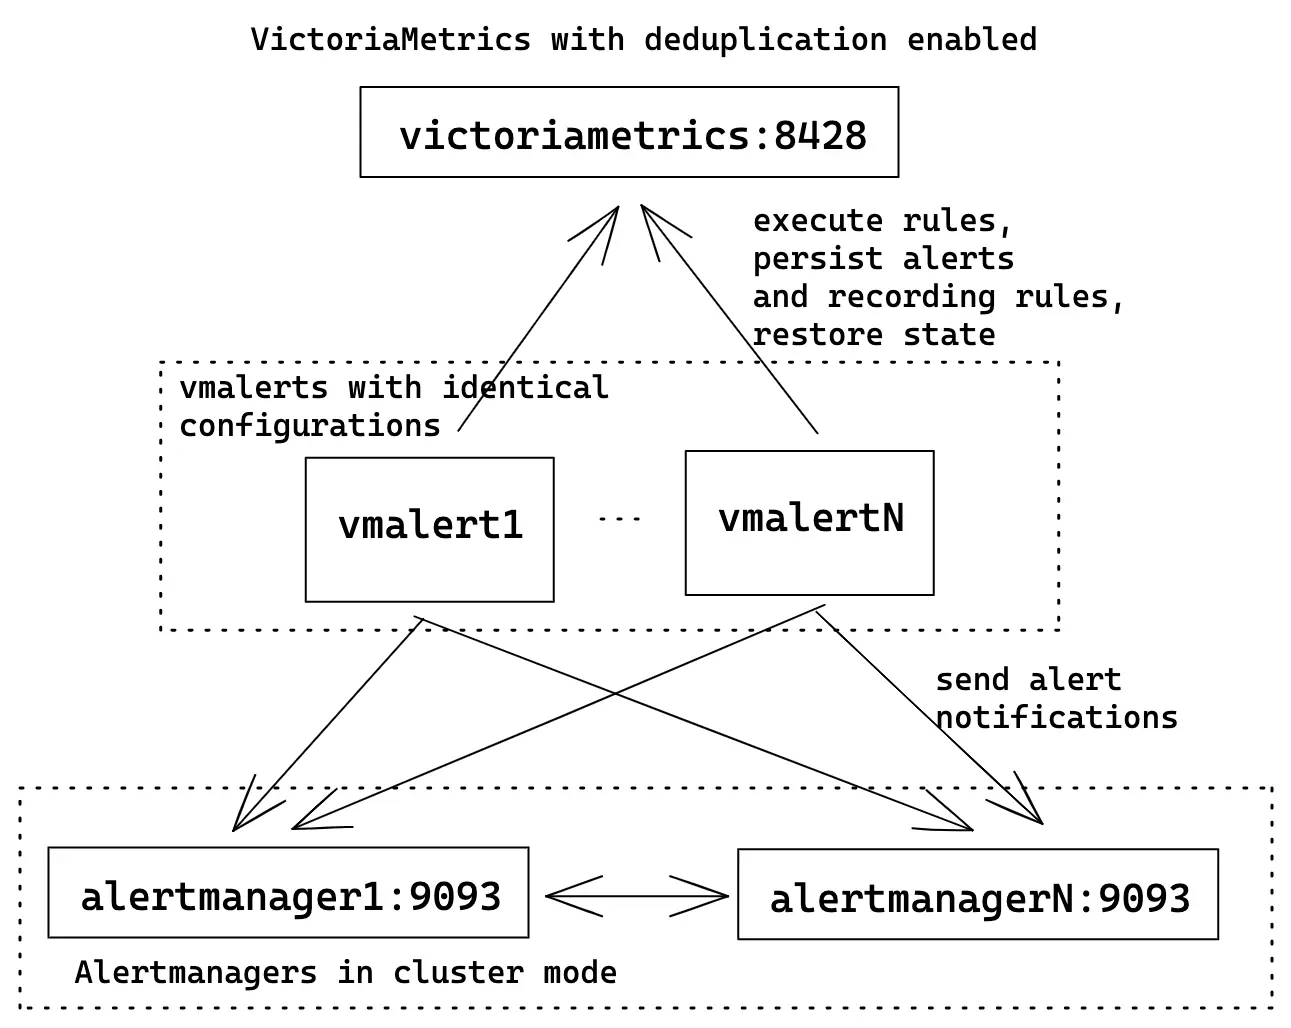
To avoid recording rules results and alerts state duplication in VictoriaMetrics server
don’t forget to configure
deduplication
.
Multiple equally configured vmalerts should evaluate rules at the same timestamps, so it is recommended
to set -dedup.minScrapeInterval as equal to vmalert’s -evaluationInterval.
If you have multiple different interval params for distinct rule groups, then set -dedup.minScrapeInterval to
the biggest interval value, or value which will be a multiple for all interval values. For example, if you have
two groups with interval: 10s and interval: 15s, then set -dedup.minScrapeInterval=30s. This would consistently
keep only a single data point on 30s time interval for all rules. However, try to avoid having inconsistent interval
values.
It is not recommended having -dedup.minScrapeInterval smaller than -evaluationInterval, as it may produce
results with inconsistent intervals between data points.
Alertmanager will automatically deduplicate alerts with identical labels, so ensure that
all vmalerts are having identical config.
Don’t forget to configure cluster mode
for Alertmanagers for better reliability. List all Alertmanager URLs in vmalert -notifier.url
to ensure high availability
.
This example uses single-node VM server for the sake of simplicity. Check how to replace it with cluster VictoriaMetrics if needed.
Downsampling and aggregation via vmalert #
Please note, stream aggregation might be more efficient for cases when downsampling or aggregation need to be applied before data gets into the TSDB.
vmalert can’t modify existing data. But it can run arbitrary queries
via
recording rules
and backfill results to the configured -remoteWrite.url.
This ability allows to aggregate data. For example, the following rule will calculate the average value for
metric http_requests on the 5m interval:
        - record: http_requests:avg5m
    expr: avg_over_time(http_requests[5m])
Every time this rule will be evaluated, vmalert will backfill its results as a new time series http_requests:avg5m
to the configured -remoteWrite.url.
vmalert executes rules with specified interval (configured via flag -evaluationInterval
or as
group’s
interval param). The interval helps to control “resolution” of the produced series.
This ability allows to downsample data. For example, the following config will execute the rule only once every 5m:
      groups:
  - name: my_group
    interval: 5m
    rules:
    - record: http_requests:avg5m
      expr: avg_over_time(http_requests[5m])
Ability of vmalert to be configured with different -datasource.url and -remoteWrite.url command-line flags
allows reading data from one data source and backfilling results to another. This helps to build a system
for aggregating and downsampling the data.
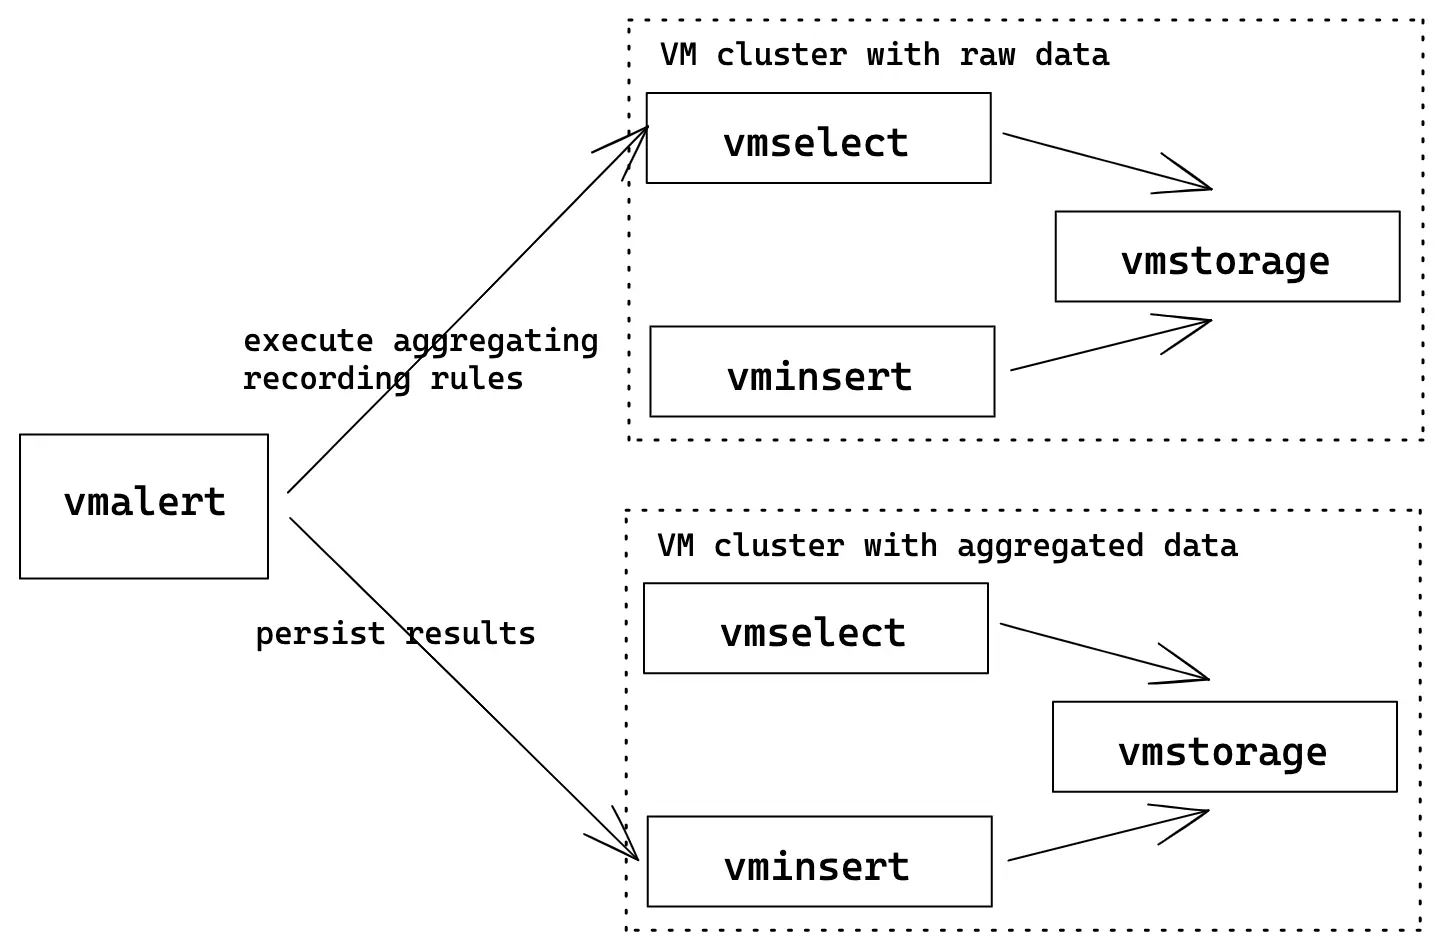
The following example shows how to build a topology where vmalert will process data from one cluster
and write results into another. Such clusters may be called as “hot” (low retention,
high-speed disks, used for operative monitoring) and “cold” (long term retention,
slower/cheaper disks, low resolution data). With help of vmalert, user can setup
recording rules to process raw data from “hot” cluster (by applying additional transformations
or reducing resolution) and push results to “cold” cluster.
vmalert configuration flags:
      ./bin/vmalert -rule=downsampling-rules.yml \                                        # Path to the file with rules configuration. Supports wildcard
    -datasource.url=http://raw-cluster-vmselect:8481/select/0/prometheus            # vmselect addr for executing recording rules expressions
    -remoteWrite.url=http://aggregated-cluster-vminsert:8480/insert/0/prometheus    # vminsert addr to persist recording rules results
Please note, replay feature may be used for transforming historical data.
Flags -remoteRead.url and -notifier.url are omitted since we assume only recording rules are used.
See also stream aggregation and downsampling .
Multiple remote writes #
For persisting recording or alerting rule results vmalert requires -remoteWrite.url to be set.
But this flag supports only one destination. To persist rule results to multiple destinations
we recommend using
vmagent
as fan-out proxy:
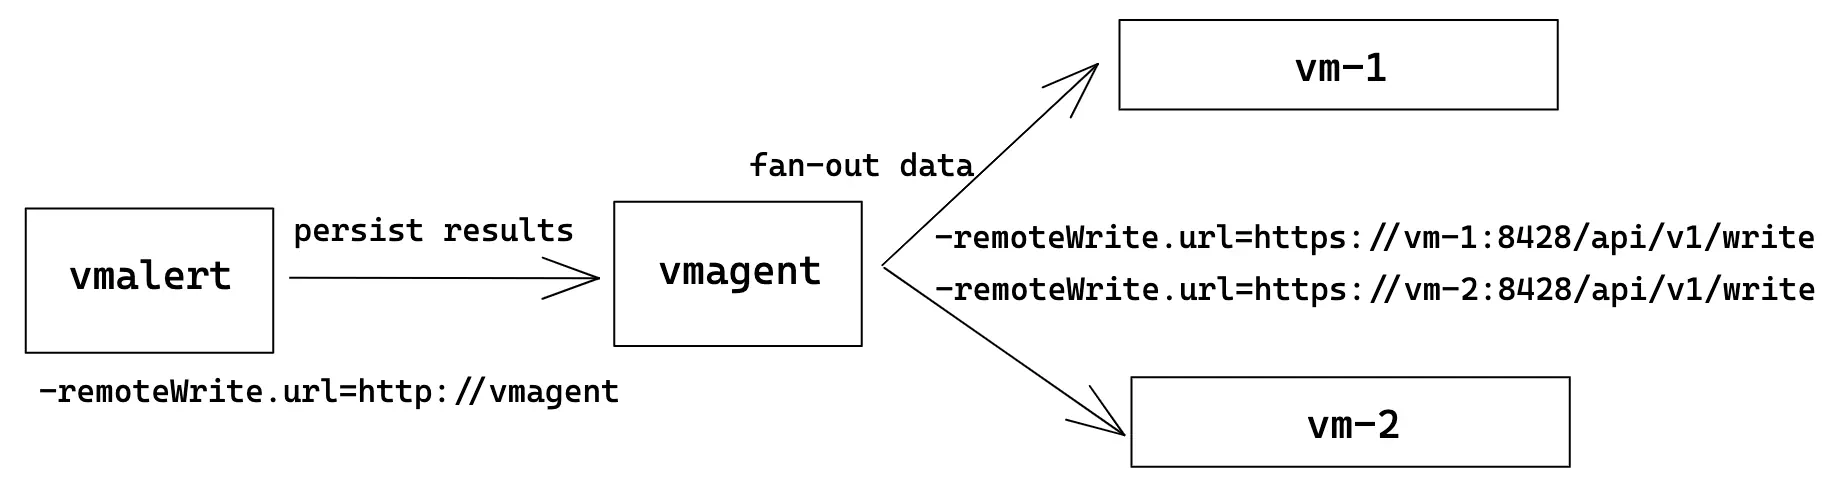
In this topology, vmalert is configured to persist rule results to vmagent. And vmagent
is configured to fan-out received data to two or more destinations.
Using vmagent as a proxy provides additional benefits such as
data persisting when storage is unreachable
,
or time series modification via
relabeling
.
Integrations #
vmalert can be integrated with different data sources for alerting and recording rules. But it deliberately allows
configuring only one datasource.url. We recommend running separate instances of vmalert for each datasource type
with the specified -rule.defaultRuleType=<datasource_type> command-line flag.
VictoriaMetrics #
vmalert natively integrates with VictoriaMetrics for alerting and recording rules.
VictoriaLogs #
vmalert integrates with
VictoriaLogs
and allows configuring alerting and recording rules using
LogsQL
.
Results of recording rules and alerting state should be persisted to the remote-write compatible storage, such as VictoriaMetrics.
To enable VictoriaLogs compatibility set the -rule.defaultRuleType=vlogs command-line flag.
See this doc for details.
VictoriaTraces #
vmalert integrates with VictoriaTraces in exactly the same way as with VictoriaLogs .
Graphite #
vmalert integrates with Graphite Render API
and allows configuring alerting and recording rules.
During evaluation, vmalert will send requests to <-datasource.url>/render?format=json.
To enable Graphite compatibility set the -rule.defaultRuleType=graphite command-line flag.
Since VictoriaMetrics supports both Graphite and Prometheus APIs, it is possible to mix Graphite and VictoriaMetrics rules.
On the group level, set the type field to specify to which datasource type it should belong: prometheus (MetricsQL) or graphite (GraphiteQL).
When using vmalert with both graphite and prometheus rules configured against the cluster version of VictoriaMetrics, don’t forget
to set the -datasource.appendTypePrefix flag to true, so vmalert can adjust URL prefix automatically based on the query type.
Prometheus #
vmalert uses Prometheus HTTP API for querying and Prometheus Remote Write v1 protocol for persisting recording rules results and alerting state. Hence, it can be integrated with any Prometheus-compatible storage that supports these protocols.
Grafana #
To proxy requests from Grafana Alerting UI
configure -vmalert.proxyURL
on VictoriaMetrics
single-node
or
vmselect in cluster version
.
vmui #
To access rules UI through
vmui
configure -vmalert.proxyURL
on VictoriaMetrics
single-node
or
vmselect in cluster version
.
vmanomaly #
See how to integrate vmalert with VictoriaMetrics Anomaly Detection in the following guide .
VictoriaMetrics Cloud #
For users of VictoriaMetrics Cloud
,
many of the configuration steps (including highly available setup of vmalert for cluster deployments) are handled automatically.
Please refer to the
VictoriaMetrics Cloud documentation
for more details.
Web #
vmalert runs a web-server (-httpListenAddr) for serving metrics and alerts endpoints:
http://<vmalert-addr>- UI;http://<vmalert-addr>/api/v1/rules- returns a list of all loaded groups and rules. Supports thedatasource_type,search,group_limit, andpage_numparameters, as well as additional filtering ;http://<vmalert-addr>/api/v1/alerts- returns a list of all active alerts. Supports thedatasource_type,rule_group[],file[]andmatch[](applied on templated alert labels) query parameters;http://<vmalert-addr>/api/v1/notifiers- returns a list of all available notifiers;http://<vmalert-addr>/vmalert/api/v1/alert?group_id=<group_id>&alert_id=<alert_id>- returns the alert status in JSON format;http://<vmalert-addr>/vmalert/api/v1/rule?group_id=<group_id>&rule_id=<rule_id>- returns the rule status in JSON format;http://<vmalert-addr>/vmalert/api/v1/group?group_id=<group_id>- returns the group status in JSON format. Used as the alert source in AlertManager;http://<vmalert-addr>/vmalert/alert?group_id=<group_id>&alert_id=<alert_id>- displays the alert status in the web UI;http://<vmalert-addr>/vmalert/rule?group_id=<group_id>&rule_id=<rule_id>- displays the rule status in the web UI;http://<vmalert-addr>/metrics- application metrics endpoint;http://<vmalert-addr>/-/reload- hot configuration reload.
vmalert web UI can be accessed from
single-node version of VictoriaMetrics
and from
cluster version of VictoriaMetrics
.
This may be used for better integration with Grafana unified alerting system. See the following docs for details:
- How to query vmalert from single-node VictoriaMetrics
- How to query vmalert from VictoriaMetrics cluster
Rules backfilling #
vmalert supports alerting and recording rules backfilling (aka replay). In replay mode vmalert
can read the same rules configuration as normal, evaluate them on the given time range and backfill
results via remote write to the configured storage. vmalert supports only the prometheus datasource type for backfilling.
Please note, that response caching may lead to unexpected results during and after backfilling process. In order to avoid this you need to reset cache contents or disable caching when using backfilling as described in backfilling docs .
See a blogpost about Rules backfilling via vmalert .
How it works #
In replay mode vmalert works as a cli-tool and exits immediately after work is done.
To run vmalert in replay mode:
      ./bin/vmalert -rule=path/to/your.rules \        # path to files with rules you usually use with vmalert
    -datasource.url=http://localhost:8428 \     # Prometheus HTTP API compatible datasource
    -remoteWrite.url=http://localhost:8428 \    # remote write compatible storage to persist results
    -replay.timeFrom=2021-05-11T07:21:43Z \     # to start replay from
    -replay.timeTo=2021-05-29T18:40:43Z         # to finish replay by, optional. By default, set to the current time
The output of the command will look like the following:
      Replay mode:
from:   2021-05-11 07:21:43 +0000 UTC   # set by -replay.timeFrom
to:     2021-05-29 18:40:43 +0000 UTC   # set by -replay.timeTo
max data points per request: 1000       # set by -replay.maxDatapointsPerQuery

Group "ReplayGroup"
interval:       1m0s
requests to make:       27
max range per request:  16h40m0s
> Rule "type:vm_cache_entries:rate5m" (ID: 1792509946081842725)
27 / 27 [----------------------------------------------------------------------------------------------------] 100.00% 78 p/s
> Rule "go_cgo_calls_count:rate5m" (ID: 17958425467471411582)
27 / 27 [-----------------------------------------------------------------------------------------------------] 100.00% ? p/s

Group "vmsingleReplay"
interval:       30s
requests to make:       54
max range per request:  8h20m0s
> Rule "RequestErrorsToAPI" (ID: 17645863024999990222)
54 / 54 [-----------------------------------------------------------------------------------------------------] 100.00% ? p/s
> Rule "TooManyLogs" (ID: 9042195394653477652)
54 / 54 [-----------------------------------------------------------------------------------------------------] 100.00% ? p/s
2021-06-07T09:59:12.098Z        info    app/vmalert/replay.go:68        replay finished! Imported 511734 samples
In replay mode, groups are executed sequentially in the defined order. Within each group, rules are also executed sequentially,
regardless of the concurrency setting. This ensures that any potential chaining between rules is preserved (see -replay.rulesDelay).
If you want rules to run concurrently based on the concurrency setting, set -replay.rulesDelay=0.
vmalert sends rule’s expression to
/query_range
endpoint
of the configured -datasource.url. Returned data is then processed according to the rule type and
backfilled to -remoteWrite.url via
remote Write protocol
.
vmalert respects evaluationInterval value set by flag or per-group during the replay.
vmalert automatically disables caching on VictoriaMetrics side by sending nocache=1 param. It allows
to prevent cache pollution and unwanted time range boundaries adjustment during backfilling.
Results of recording rules replay should match the results of normal rules evaluation.
Results of alerting rules replay are the time series reflecting the
state of the alert
.
To see if replayed alert has fired in the past use the following PromQL/MetricsQL expression:
ALERTS{alertname="your_alertname", alertstate="firing"}
Execute the query against storage which was used for -remoteWrite.url during the replay.
Since alerting rule annotations are attached to alert messages sent to the notifier (such as Alertmanager), and vmalert does not send alert messages to notifier in replay mode, all rule annotations will be ignored.
Additional configuration #
There are following non-required replay flags:
-replay.maxDatapointsPerQuery- the max number of data points expected to receive in one request. In two words, it affects the max time range for every/query_rangerequest. The higher the value, the fewer requests will be issued duringreplay.-replay.ruleRetryAttempts- when datasource fails to respond vmalert will make this number of retries per rule before giving up.-replay.rulesDelay- delay between sequential rules execution. Important in cases if there are chaining (rules which depend on each other) rules. It is expected, that remote storage will be able to persist previously accepted data during the delay, so data will be available for the subsequent queries. Keep it equal or bigger than-remoteWrite.flushInterval. When set to0, allows executing rules within the group concurrently.-replay.disableProgressBar- whether to disable progress bar which shows progress work. Progress bar may generate a lot of log records, which is not formatted as standard VictoriaMetrics logger. It could break logs parsing by external system and generate additional load on it.-replay.ruleEvaluationConcurrency- The maximum number of concurrent/query_rangerequests when replay recording rule or alerting rule with for=0. Increasing this value when replaying for a long time, since each request is limited by-replay.maxDatapointsPerQuery. The default value is1.
See full description for these flags in ./vmalert -help.
Limitations #
- Graphite engine isn’t supported yet;
querytemplate function is disabled for performance reasons (might be changed in future);limitgroup’s param has no effect during replay (might be changed in future);keep_firing_foralerting rule param has no effect during replay (might be changed in future).
Unit Testing for Rules #
You can use vmalert-tool to test your alerting and recording rules like promtool does
.
See more details in
vmalert-tool
.
Monitoring #
vmalert exports various metrics in Prometheus exposition format at http://vmalert-host:8880/metrics page.
See the list of recommended alerting rules
to track the vmalert health.
We recommend setting up regular scraping of this page either through
vmagent
or by Prometheus-compatible scraper,
so that the exported metrics may be analyzed later.
If you use Google Cloud Managed Prometheus for scraping metrics from VictoriaMetrics components, then pass -metrics.exposeMetadata
command-line to them, so they add TYPE and HELP comments per each exposed metric at /metrics page.
See these docs
for details.
Use the official Grafana dashboard
for vmalert overview.
Graphs on this dashboard contain useful hints - hover the i icon in the top left corner of each graph in order to read it.
If you have suggestions for improvements or have found a bug - please open an issue on GitHub or add
a review to the dashboard.
Troubleshooting #
Common mistakes #
Try the following tips to avoid common issues:
- Always set group’s interval to be equal to or greater than the time series resolution .
- Don’t set labels with dynamic values to
labelsparam .- Example: setting
label: {{$value}}to the rule will break its alert state tracking because every evaluation could change thelabelvalue. If you need to attach$valueto the alert notification - add it toannotationsinstead.
- Example: setting
- vmalert runs
instant queries
during rule evaluation
using the
stepparameter, which defaults to-datasource.queryStep(default is5m). In VictoriaMetrics,stepcontrols how far back the query can look for a recent datapoint. If series resolution is>=5m, the query might return no data.- To fix this, set
-datasource.queryStepto value at least 2x larger than the resolution. You can also setstepper group using theparamssetting.
- To fix this, set
- Be careful when chaining rules. If rule B uses results from rule A, make sure rule A is evaluated with an
interval less than 5 minutes (or less than
-datasource.queryStep). Otherwise, rule B might get empty results during evaluation. See how to chain groups . - Don’t skip
[lookbehind-window]in rollup functions.- Example:
rate(errors_total) > 0. MetricsQL allows omitting lookbehind window but that works well only with /api/v1/query_range . For instant requests setting window makes the query predictable.
- Example:
- Make sure the
[lookbehind-window]in your expression is at least 2× larger than time series resolution .- Example: in
rate(my_metric[2m]) > 0, ensure thatmy_metricis scraped every 1 minute or better, every 30 seconds.
- Example: in
- Increase
[lookbehind-window]to help tolerate data delays.- Example:
max_over_time(node_memory_MemAvailable_bytes[10m]) > 0will still work even if no data was present in the last 9 minutes.
- Example:
- Don’t skip step in
subqueries
.
- Example:
sum(count_over_time((metric == 0)[1h:]))is missing a step after1h:. In that case, the default step will be used (-datasource.queryStep) and may cause unexpected results compared to executing this query in vmui/Grafana, where step is adjusted differently.
- Example:
Rule state #
vmalert keeps the last -rule.updateEntriesLimit updates (or update_entries_limit
per-rule config
)
for each rule. You can see these updates in vmalert’s
web UI
:
- Open the
Groupstab - Find the Group and rule you’re interested in
- Click the
Detailslink next to rule’s name and look at theLast N updatessection:
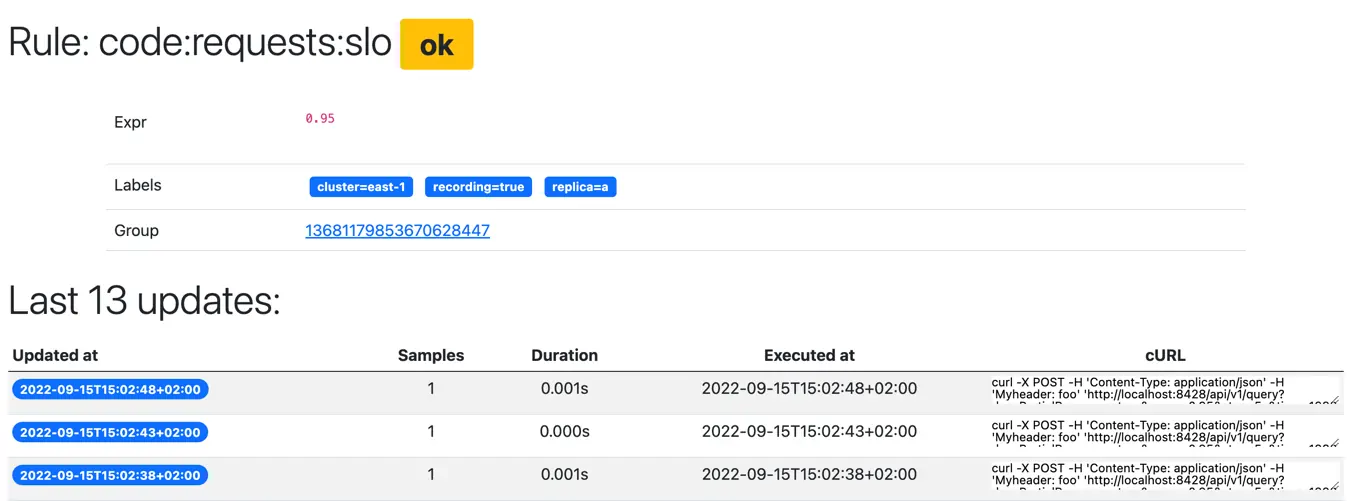
The rows in this section show the rule’s evaluations in order, along with their results.
Every state has the following attributes:
Updated at- the actual time when vmalert executed this rule.Execution timestamp- thetimeparam that was sent to the datasource with evaluation request.Series returned- the number of series returned in this evaluation:- A recording rule with 0 series means it produced no results;
- An alerting rule with 0 series means the rule is in inactive state.
Series fetched- the number of series scanned during execution. See never-firing alerts .Duration- how long it took to evaluate the rule.- If this time is close to or longer than the evaluation interval, some evaluations might be skipped.
- See how to handle slow queries .
cURL- a sample HTTP request that vmalert sent to-datasource.urlduring evaluation.- It includes all headers and query parameters.
- You can use this command to debug and see what the data source returned at that moment of time.
- Sensitive data is removed from the
curlexample – see the security section for more info.
If a specific entry shows Series returned: 0, but the cURL command returns some data when you execute it, it likely means there was no data in the data source at the exact time the rule was evaluated. See more about data delay .
vmalert exposes vmalert_recording_rules_last_evaluation_samples for recording rules to represent the amount of series
returned during evaluations. The following alerting rule can be used to detect those recording rules that produce no data:
            - alert: RecordingRulesNoData
        expr: vmalert_recording_rules_last_evaluation_samples < 1
        annotations:
          summary: "Recording rule {{ $labels.recording }} ({{ $labels.group }}) produces no data"
See more about alerting rules in Monitoring .
Alert state #
Sometimes, it’s hard to understand why a specific alert fired or not. Keep in mind the following:
- Alerts with
for: 0(or not set) fire immediately after the evaluation. - Alerts with
for > 0fire only after several evaluations in a row, if the expression is true every time.
If evaluation returns error (i.e. datasource is unavailable), alert state doesn’t change.
If at least one evaluation returns no data, then alert’s for state resets.
Note: The alert state is tracked separately for each time series returned during evaluation. For example, if the 1st evaluation returns series A and B, and the 2nd evaluation returns only B – the alert will remain active only for B.
If -remoteWrite.url command-line flag is configured, vmalert will persist alert’s state
in form of time series ALERTS and ALERTS_FOR_STATE to the specified destination. Such time series can be then queried via
vmui
or Grafana to track how
alerts state changed in time. See query statistics dashboard
as example for tracking historical alerts state.
Data delay #
Data delay is one of the most common problems when running rules.
vmalert runs the configured rules at specific timestamps.
It expects that the needed data is already available in the configured -datasource.url at the time the rule is evaluated.
Usually, troubles begin when data in -datasource.url is delayed or absent. In such cases, evaluations
may get an empty response from the datasource, produce empty recording rules or reset alerts state:
Please note, data delay is inevitable in distributed systems. And it is better to account for it rather than ignore it.
By default, recently written samples to VictoriaMetrics
aren’t visible for queries
for up to 30s (see -search.latencyOffset command-line flag at vmselect or VictoriaMetrics single-node).
Such delay is needed to eliminate the risk of incomplete data on the moment of querying. To compensate the latency in
timestamps for produced evaluation results, -rule.evalDelay is also set to 30s by default.
If you expect data to be delayed for longer intervals (it gets buffered, queued, or just network is slow sometimes),
or you changed default value of -search.latencyOffset - consider increasing the -rule.evalDelay value accordingly.
See common mistakes for recommendations for dealing with sporadic or delayed data.
Debug mode #
vmalert allows configuring more detailed logging for specific rule starting from
Available from v1.116.0
.
Or for all rules within the
group
Available from v1.117.0
.
Just set debug: true in configuration and vmalert will start printing additional log messages:
      2022-09-15T13:35:41.155Z  DEBUG alerting rule "TestGroup":"Conns" (2601299393013563564) at 2022-09-15T15:35:41+02:00: query returned 0 series (elapsed: 5.896041ms, isPartial: false)
2022-09-15T13:35:56.149Z  DEBUG datasource request: executing POST request with params "denyPartialResponse=true&query=sum%28vm_tcplistener_conns%7Binstance%3D%22localhost%3A8429%22%7D%29+by%28instance%29+%3E+0&step=15s&time=1663248945"
2022-09-15T13:35:56.178Z  DEBUG alerting rule "TestGroup":"Conns" (2601299393013563564) at 2022-09-15T15:35:56+02:00: query returned 1 series (elapsed: 28.368208ms, isPartial: false)
2022-09-15T13:35:56.178Z  DEBUG datasource request: executing POST request with params "denyPartialResponse=true&query=sum%28vm_tcplistener_conns%7Binstance%3D%22localhost%3A8429%22%7D%29&step=15s&time=1663248945"
2022-09-15T13:35:56.179Z  DEBUG alerting rule "TestGroup":"Conns" (2601299393013563564) at 2022-09-15T15:35:56+02:00: alert 10705778000901301787 {alertgroup="TestGroup",alertname="Conns",cluster="east-1",instance="localhost:8429",replica="a"} created in state PENDING
...
2022-09-15T13:36:56.153Z  DEBUG alerting rule "TestGroup":"Conns" (2601299393013563564) at 2022-09-15T15:36:56+02:00: alert 10705778000901301787 {alertgroup="TestGroup",alertname="Conns",cluster="east-1",instance="localhost:8429",replica="a"} PENDING => FIRING: 1m0s since becoming active at 2022-09-15 15:35:56.126006 +0200 CEST m=+39.384575417
Sensitive info is stripped from the curl examples - see
security
section for more details.
Flapping alerts #
Transient alerts, that change state from inactive to firing too frequently, called flapping alerts.
The following expression will show how many times a specific rule switched its state over last 24h:
max(changes(vmalert_alerts_firing[24h])) by(group, alertname) > 0
How to reduce the chance for a rule to flap:
- Use the
for <interval>:setting with a value much larger than thescrape_intervalfor the series used in the expression. Note, the larger isfor, the longer it takes for the alert to fire. - Set a
[lookbehind-window]in rollup expressions (i.e.rate(http_errors_total[<lookbehind-window>]) > 0) to at least 2× thescrape_intervalfor the selected series. - Use
keep_firing_for: <interval>to delay alert resolution if the expression stops returning data. For example, for short CPU spikes, you may want to keep the alert active until CPU usage stays low for 5 minutes in a row. - Make sure your rule can handle possible data delays from the datasource.
- Review the metric’s past behavior to set a threshold that avoids triggering alerts too easily.
See common mistakes for rules config.
Never-firing alerts #
vmalert can detect
Available from v1.91.0
if alert’s expression doesn’t match any time series in runtime.
This problem usually happens when alerting expression selects time series which aren’t present in the datasource (i.e. wrong job label)
or there is a typo in the series selector (i.e. env=prodd). Such alerting rules will be marked with special icon in
vmalert UI and exposed via vmalert_alerting_rules_last_evaluation_series_fetched metric. The metric value will
show how many time series were matched before the filtering by rule’s expression. If metric value is -1, then
this feature is not supported by the datasource (old versions of VictoriaMetrics). The following expression can be
used to detect rules matching no series:
max(vmalert_alerting_rules_last_evaluation_series_fetched) by(group, alertname) == 0
See more details in this GitHub Issue and read Never-firing alerts blogpost.
Series with the same labelset #
vmalert can produce the following error message:
result contains metrics with the same labelset during evaluation
The error means there is a collision between time series during evaluation.
For example, a rule with expr: {__name__=~"vmalert_alerts_.*"} > 0 returns two distinct time series in response:
      {__name__="vmalert_alerts_pending",job="vmalert",alertname="HostContextSwitching"} 12
{__name__="vmalert_alerts_firing",job="vmalert",alertname="HostContextSwitching"} 0
As label __name__ will be dropped during evaluation, leads to duplicated time series.
To fix this, use
label_replace
to preserve the distinct labelset.
mTLS protection #
By default vmalert accepts http requests at 8880 port (this port can be changed via -httpListenAddr command-line flags),
since it is expected it runs in an isolated trusted network.
Enterprise version of vmagent
supports the ability to accept mTLS
requests at this port, by specifying -tls and -mtls command-line flags. For example, the following command runs vmalert, which accepts only mTLS requests at port 8880:
./vmalert -tls -mtls -remoteWrite.url=...
By default system-wide TLS Root CA
is used for verifying client certificates if -mtls command-line flag is specified.
It is possible to specify custom TLS Root CA via -mtlsCAFile command-line flag.
Security #
See general recommendations regarding security .
vmalert web UI , logs, and exported metrics contain details such as group configurations, active alerts, alerts state , notifiers configuration . Consider limiting user’s access to them if this information is sensitive. Specifically:
- Log messages, the UI, and exported metrics contain full path to the configured rule files. These file paths can be stripped
by enabling
-rule.stripFilePathcommand-line flag Available from v1.143.0 ; - Datasource address is sanitized in log messages, UI and exported metrics, can be shown by enabling
-datasource.showURL; - Notifier addresses are sanitized in log messages, UI and exported metrics, can be shown by enabling
-notifier.showURL; - Remote read address is sanitized in log messages, UI and exported metrics, can be shown by enabling
--remoteRead.showURL; - Remote write address is sanitized in log messages, UI and exported metrics, can be shown by enabling
-remoteWrite.showURL.
Alerts state
page or
debug mode
could emit additional information about configured
datasource URL, GET params and headers. Sensitive information such as passwords or auth tokens is stripped by default.
To disable stripping of such info pass -datasource.showURL cmd-line flag to vmalert.
See also mTLS protection docs .
Profiling #
vmalert provides handlers for collecting the following Go profiles
:
- Memory profile. It can be collected with the following command (replace
0.0.0.0with hostname if needed):
curl http://0.0.0.0:8880/debug/pprof/heap > mem.pprof
- CPU profile. It can be collected with the following command (replace
0.0.0.0with hostname if needed):
curl http://0.0.0.0:8880/debug/pprof/profile > cpu.pprof
The command for collecting CPU profile waits for 30 seconds before returning.
The collected profiles may be analyzed with go tool pprof . It is safe sharing the collected profiles from security point of view, since they do not contain sensitive information.
Configuration #
Flags #
Pass -help to vmalert in order to see the full list of supported
command-line flags with their descriptions.
The shortlist of configuration flags is the following:
Common flags #
These flags are available in both VictoriaMetrics OSS and VictoriaMetrics Enterprise.
vmalert processes alerts and recording rules.

See the docs at https://docs.victoriametrics.com/victoriametrics/vmalert/ .

  -blockcache.missesBeforeCaching int
     The number of cache misses before putting the block into cache. Higher values may reduce indexdb/dataBlocks cache size at the cost of higher CPU and disk read usage (default 2)
  -configCheckInterval duration
     Interval for checking for changes in '-rule', '-rule.templates' and '-notifier.config' files. By default, the checking is disabled. Send SIGHUP signal in order to force config check for changes.
  -datasource.appendTypePrefix
     Whether to add type prefix to -datasource.url based on the query type. Set to true if sending different query types to the vmselect URL.
  -datasource.basicAuth.password string
     Optional basic auth password for -datasource.url
  -datasource.basicAuth.passwordFile string
     Optional path to basic auth password to use for -datasource.url
  -datasource.basicAuth.username string
     Optional basic auth username for -datasource.url
  -datasource.basicAuth.usernameFile string
     Optional path to basic auth username to use for -datasource.url
  -datasource.bearerToken string
     Optional bearer auth token to use for -datasource.url.
  -datasource.bearerTokenFile string
     Optional path to bearer token file to use for -datasource.url.
  -datasource.disableKeepAlive
     Whether to disable long-lived connections to the datasource. If true, disables HTTP keep-alive and will only use the connection to the server for a single HTTP request.
  -datasource.disableStepParam
     Whether to disable adding 'step' param in instant queries to the configured -datasource.url and -remoteRead.url. Only valid for prometheus datasource. This might be useful when using vmalert with datasources that do not support 'step' param for instant queries, like Google Managed Prometheus. It is not recommended to enable this flag if you use vmalert with VictoriaMetrics.
  -datasource.headers string
     Optional HTTP extraHeaders to send with each request to the corresponding -datasource.url. For example, -datasource.headers='My-Auth:foobar' would send 'My-Auth: foobar' HTTP header with every request to the corresponding -datasource.url. Multiple headers must be delimited by '^^': -datasource.headers='header1:value1^^header2:value2'
  -datasource.idleConnTimeout duration
     Defines a duration for idle (keep-alive connections) to exist. Consider setting this value less than "-http.idleConnTimeout". It must prevent possible "write: broken pipe" and "read: connection reset by peer" errors. (default 50s)
  -datasource.maxIdleConnections int
     Defines the number of idle (keep-alive connections) to each configured datasource. Consider setting this value equal to the value: groups_total * group.concurrency. Too low a value may result in a high number of sockets in TIME_WAIT state. (default 100)
  -datasource.oauth2.clientID string
     Optional OAuth2 clientID to use for -datasource.url
  -datasource.oauth2.clientSecret string
     Optional OAuth2 clientSecret to use for -datasource.url
  -datasource.oauth2.clientSecretFile string
     Optional OAuth2 clientSecretFile to use for -datasource.url
  -datasource.oauth2.endpointParams string
     Optional OAuth2 endpoint parameters to use for -datasource.url . The endpoint parameters must be set in JSON format: {"param1":"value1",...,"paramN":"valueN"}
  -datasource.oauth2.scopes string
     Optional OAuth2 scopes to use for -datasource.url. Scopes must be delimited by ';'
  -datasource.oauth2.tokenUrl string
     Optional OAuth2 tokenURL to use for -datasource.url
  -datasource.queryStep duration
     How far a value can fallback to when evaluating queries to the configured -datasource.url and -remoteRead.url. Only valid for prometheus datasource. For example, if -datasource.queryStep=15s then param "step" with value "15s" will be added to every query. If set to 0, rule's evaluation interval will be used instead. (default 5m0s)
  -datasource.roundDigits int
     Adds "round_digits" GET param to datasource requests which limits the number of digits after the decimal point in response values. Only valid for VictoriaMetrics as the datasource.
  -datasource.showURL
     Whether to avoid stripping sensitive information such as auth headers or passwords from URLs in log messages or UI and exported metrics. It is hidden by default, since it can contain sensitive info such as auth key
  -datasource.tlsCAFile string
     Optional path to TLS CA file to use for verifying connections to -datasource.url. By default, system CA is used
  -datasource.tlsCertFile string
     Optional path to client-side TLS certificate file to use when connecting to -datasource.url
  -datasource.tlsInsecureSkipVerify
     Whether to skip tls verification when connecting to -datasource.url
  -datasource.tlsKeyFile string
     Optional path to client-side TLS certificate key to use when connecting to -datasource.url
  -datasource.tlsServerName string
     Optional TLS server name to use for connections to -datasource.url. By default, the server name from -datasource.url is used
  -datasource.url string
     Datasource compatible with Prometheus HTTP API. It can be single node VictoriaMetrics or vmselect endpoint. Required parameter. Supports address in the form of IP address with a port (e.g., http://127.0.0.1:8428) or DNS SRV record. See also -remoteRead.disablePathAppend and -datasource.showURL
  -disableAlertgroupLabel
     Whether to disable adding group's Name as label to generated alerts and time series.
  -dryRun
     Whether to check only config files without running vmalert. The rules file are validated. The -rule flag must be specified.
  -enableTCP6
     Whether to enable IPv6 for listening and dialing. By default, only IPv4 TCP and UDP are used
  -envflag.enable
     Whether to enable reading flags from environment variables in addition to the command line. Command line flag values have priority over values from environment vars. Flags are read only from the command line if this flag isn't set. See https://docs.victoriametrics.com/victoriametrics/single-server-victoriametrics/#environment-variables for more details
  -envflag.prefix string
     Prefix for environment variables if -envflag.enable is set
  -evaluationInterval duration
     How often to evaluate the rules (default 1m0s)
  -external.alert.source string
     External Alert Source allows to override the Source link for alerts sent to AlertManager for cases where you want to build a custom link to Grafana, Prometheus or any other service. Supports templating - see https://docs.victoriametrics.com/victoriametrics/vmalert/#templating . For example, link to Grafana: -external.alert.source='explore?orgId=1&left={"datasource":"VictoriaMetrics","queries":[{"expr":{{.Expr|jsonEscape|queryEscape}},"refId":"A"}],"range":{"from":"now-1h","to":"now"}}'. Link to VMUI: -external.alert.source='vmui/#/?g0.expr={{.Expr|queryEscape}}'. If empty 'vmalert/alert?group_id={{.GroupID}}&alert_id={{.AlertID}}' is used.
  -external.label array
     Optional label in the form 'Name=value' to add to all generated recording rules and alerts. In case of conflicts, original labels are kept with prefix 'exported_'.
     Supports an array of values separated by comma or specified via multiple flags.
     Each array item can contain comma inside single-quoted or double-quoted string, {}, [] and () braces.
  -external.url string
     External URL is used as alert's source for sent alerts to the notifier. By default, hostname is used as address.
  -filestream.disableFadvise
     Whether to disable fadvise() syscall when reading large data files. The fadvise() syscall prevents from eviction of recently accessed data from OS page cache during background merges and backups. In some rare cases it is better to disable the syscall if it uses too much CPU
  -flagsAuthKey value
     Auth key for /flags endpoint. It must be passed via authKey query arg. It overrides -httpAuth.*
     Flag value can be read from the given file when using -flagsAuthKey=file:///abs/path/to/file or -flagsAuthKey=file://./relative/path/to/file.
     Flag value can be read from the given http/https url when using -flagsAuthKey=http://host/path or -flagsAuthKey=https://host/path
  -fs.disableMincore
     Whether to disable the mincore() syscall for checking mmap()ed files. By default, mincore() is used to detect whether mmap()ed file pages are resident in memory. Disabling mincore() may be needed on older ZFS filesystems (below 2.1.5), since it may trigger ZFS bug. See https://github.com/VictoriaMetrics/VictoriaMetrics/issues/10327 for details.
  -fs.disableMmap
     Whether to use pread() instead of mmap() for reading data files. By default, mmap() is used for 64-bit arches and pread() is used for 32-bit arches, since they cannot read data files bigger than 2^32 bytes in memory. mmap() is usually faster for reading small data chunks than pread()
  -fs.maxConcurrency int
     The maximum number of concurrent goroutines to work with files; smaller values may help reducing Go scheduling latency on systems with small number of CPU cores; higher values may help reducing data ingestion latency on systems with high-latency storage such as NFS or Ceph (default fsutil.getDefaultConcurrency())
  -group.maxStartDelay duration
     Defines the max delay before starting the group evaluation. Group's start is artificially delayed for random duration on interval [0..min(--group.maxStartDelay, group.interval)]. This helps smoothing out the load on the configured datasource, so evaluations aren't executed too close to each other. (default 5m0s)
  -http.connTimeout duration
     Incoming connections to -httpListenAddr are closed after the configured timeout. This may help evenly spreading load among a cluster of services behind TCP-level load balancer. Zero value disables closing of incoming connections (default 2m0s)
  -http.disableCORS
     Disable CORS for all origins (*)
  -http.disableKeepAlive
     Whether to disable HTTP keep-alive for incoming connections at -httpListenAddr
  -http.disableResponseCompression
     Disable compression of HTTP responses to save CPU resources. By default, compression is enabled to save network bandwidth
  -http.header.csp string
     Value for 'Content-Security-Policy' header, recommended: "default-src 'self'"
  -http.header.disableServerHostname
     Whether to disable 'X-Server-Hostname' header in HTTP responses
  -http.header.frameOptions string
     Value for 'X-Frame-Options' header
  -http.header.hsts string
     Value for 'Strict-Transport-Security' header, recommended: 'max-age=31536000; includeSubDomains'
  -http.idleConnTimeout duration
     Timeout for incoming idle http connections (default 1m0s)
  -http.maxGracefulShutdownDuration duration
     The maximum duration for a graceful shutdown of the HTTP server. During this period the server stops accepting new connections, but it will continue serving existing connections. The remaining in-flight requests are canceled before the deadline, so the shutdown can finish within this duration. A highly loaded server may require increased value for a graceful shutdown (default 7s)
  -http.pathPrefix string
     An optional prefix to add to all the paths handled by http server. For example, if '-http.pathPrefix=/foo/bar' is set, then all the http requests will be handled on '/foo/bar/*' paths. This may be useful for proxied requests. See https://www.robustperception.io/using-external-urls-and-proxies-with-prometheus
  -http.shutdownDelay duration
     Optional delay before http server shutdown. During this delay, the server returns non-OK responses from /health page, so load balancers can route new requests to other servers
  -httpAuth.password value
     Password for HTTP server's Basic Auth. The authentication is disabled if -httpAuth.username is empty
     Flag value can be read from the given file when using -httpAuth.password=file:///abs/path/to/file or -httpAuth.password=file://./relative/path/to/file.
     Flag value can be read from the given http/https url when using -httpAuth.password=http://host/path or -httpAuth.password=https://host/path
  -httpAuth.username string
     Username for HTTP server's Basic Auth. The authentication is disabled if empty. See also -httpAuth.password
  -httpListenAddr array
     Address to listen for incoming http requests. See also -tls and -httpListenAddr.useProxyProtocol
     Supports an array of values separated by comma or specified via multiple flags.
     Each array item can contain comma inside single-quoted or double-quoted string, {}, [] and () braces.
  -httpListenAddr.useProxyProtocol array
     Whether to use proxy protocol for connections accepted at the corresponding -httpListenAddr . See https://www.haproxy.org/download/1.8/doc/proxy-protocol.txt . With enabled proxy protocol http server cannot serve regular /metrics endpoint. Use -pushmetrics.url for metrics pushing
     Supports array of values separated by comma or specified via multiple flags.
     Empty values are set to false.
  -internStringCacheExpireDuration duration
     The expiry duration for caches for interned strings. See https://en.wikipedia.org/wiki/String_interning . See also -internStringMaxLen and -internStringDisableCache (default 6m0s)
  -internStringDisableCache
     Whether to disable caches for interned strings. This may reduce memory usage at the cost of higher CPU usage. See https://en.wikipedia.org/wiki/String_interning . See also -internStringCacheExpireDuration and -internStringMaxLen
  -internStringMaxLen int
     The maximum length for strings to intern. A lower limit may save memory at the cost of higher CPU usage. See https://en.wikipedia.org/wiki/String_interning . See also -internStringDisableCache and -internStringCacheExpireDuration (default 500)
  -loggerDisableTimestamps
     Whether to disable writing timestamps in logs
  -loggerErrorsPerSecondLimit int
     Per-second limit on the number of ERROR messages. If more than the given number of errors are emitted per second, the remaining errors are suppressed. Zero values disable the rate limit
  -loggerFormat string
     Format for logs. Possible values: default, json (default "default")
  -loggerJSONFields string
     Allows renaming fields in JSON formatted logs. Example: "ts:timestamp,msg:message" renames "ts" to "timestamp" and "msg" to "message". Supported fields: ts, level, caller, msg
  -loggerLevel string
     Minimum level of errors to log. Possible values: INFO, WARN, ERROR, FATAL, PANIC (default "INFO")
  -loggerMaxArgLen int
     The maximum length of a single logged argument. Longer arguments are replaced with 'arg_start..arg_end', where 'arg_start' and 'arg_end' is prefix and suffix of the arg with the length not exceeding -loggerMaxArgLen / 2 (default 5000)
  -loggerOutput string
     Output for the logs. Supported values: stderr, stdout (default "stderr")
  -loggerTimezone string
     Timezone to use for timestamps in logs. Timezone must be a valid IANA Time Zone. For example: America/New_York, Europe/Berlin, Etc/GMT+3 or Local (default "UTC")
  -loggerWarnsPerSecondLimit int
     Per-second limit on the number of WARN messages. If more than the given number of warns are emitted per second, then the remaining warns are suppressed. Zero values disable the rate limit
  -memory.allowedBytes size
     Allowed size of system memory VictoriaMetrics caches may occupy. This option overrides -memory.allowedPercent if set to a non-zero value. Too low a value may increase the cache miss rate usually resulting in higher CPU and disk IO usage. Too high a value may evict too much data from the OS page cache resulting in higher disk IO usage. The process may behave unexpectedly if this flag is set too small (e.g., 1 byte).
     Supports the following optional suffixes for size values: KB, MB, GB, TB, KiB, MiB, GiB, TiB (default 0)
  -memory.allowedPercent float
     Allowed percent of system memory VictoriaMetrics caches may occupy. See also -memory.allowedBytes. Too low a value may increase cache miss rate usually resulting in higher CPU and disk IO usage. Too high a value may evict too much data from the OS page cache which will result in higher disk IO usage (default 60)
  -metrics.exposeMetadata
     Whether to expose TYPE and HELP metadata at the /metrics page, which is exposed at -httpListenAddr . The metadata may be needed when the /metrics page is consumed by systems, which require this information. For example, Managed Prometheus in Google Cloud - https://cloud.google.com/stackdriver/docs/managed-prometheus/troubleshooting#missing-metric-type
  -metricsAuthKey value
     Auth key for /metrics endpoint. It must be passed via authKey query arg. It overrides -httpAuth.*
     Flag value can be read from the given file when using -metricsAuthKey=file:///abs/path/to/file or -metricsAuthKey=file://./relative/path/to/file.
     Flag value can be read from the given http/https url when using -metricsAuthKey=http://host/path or -metricsAuthKey=https://host/path
  -notifier.basicAuth.password array
     Optional basic auth password for -notifier.url
     Supports an array of values separated by comma or specified via multiple flags.
     Each array item can contain comma inside single-quoted or double-quoted string, {}, [] and () braces.
  -notifier.basicAuth.passwordFile array
     Optional path to basic auth password file for -notifier.url
     Supports an array of values separated by comma or specified via multiple flags.
     Each array item can contain comma inside single-quoted or double-quoted string, {}, [] and () braces.
  -notifier.basicAuth.username array
     Optional basic auth username for -notifier.url
     Supports an array of values separated by comma or specified via multiple flags.
     Each array item can contain comma inside single-quoted or double-quoted string, {}, [] and () braces.
  -notifier.basicAuth.usernameFile array
     Optional path to basic auth username file for -notifier.url
     Supports an array of values separated by comma or specified via multiple flags.
     Each array item can contain comma inside single-quoted or double-quoted string, {}, [] and () braces.
  -notifier.bearerToken array
     Optional bearer token for -notifier.url
     Supports an array of values separated by comma or specified via multiple flags.
     Each array item can contain comma inside single-quoted or double-quoted string, {}, [] and () braces.
  -notifier.bearerTokenFile array
     Optional path to bearer token file for -notifier.url
     Supports an array of values separated by comma or specified via multiple flags.
     Each array item can contain comma inside single-quoted or double-quoted string, {}, [] and () braces.
  -notifier.blackhole
     Whether to blackhole alerting notifications. Enable this flag if you want vmalert to evaluate alerting rules without sending any notifications to external receivers (eg. alertmanager). -notifier.url, -notifier.config and -notifier.blackhole are mutually exclusive.
  -notifier.config string
     Path to configuration file for notifiers
  -notifier.headers array
     Optional HTTP headers to send with each request to the corresponding -notifier.url. For example, -remoteWrite.headers='My-Auth:foobar' would send 'My-Auth: foobar' HTTP header with every request to the corresponding -notifier.url. Multiple headers must be delimited by '^^': -notifier.headers='header1:value1^^header2:value2,header3:value3'
     Supports an array of values separated by comma or specified via multiple flags.
     Each array item can contain comma inside single-quoted or double-quoted string, {}, [] and () braces.
  -notifier.oauth2.clientID array
     Optional OAuth2 clientID to use for -notifier.url. If multiple args are set, then they are applied independently for the corresponding -notifier.url
     Supports an array of values separated by comma or specified via multiple flags.
     Each array item can contain comma inside single-quoted or double-quoted string, {}, [] and () braces.
  -notifier.oauth2.clientSecret array
     Optional OAuth2 clientSecret to use for -notifier.url. If multiple args are set, then they are applied independently for the corresponding -notifier.url
     Supports an array of values separated by comma or specified via multiple flags.
     Each array item can contain comma inside single-quoted or double-quoted string, {}, [] and () braces.
  -notifier.oauth2.clientSecretFile array
     Optional OAuth2 clientSecretFile to use for -notifier.url. If multiple args are set, then they are applied independently for the corresponding -notifier.url
     Supports an array of values separated by comma or specified via multiple flags.
     Each array item can contain comma inside single-quoted or double-quoted string, {}, [] and () braces.
  -notifier.oauth2.endpointParams array
     Optional OAuth2 endpoint parameters to use for the corresponding -notifier.url . The endpoint parameters must be set in JSON format: {"param1":"value1",...,"paramN":"valueN"}
     Supports an array of values separated by comma or specified via multiple flags.
     Each array item can contain comma inside single-quoted or double-quoted string, {}, [] and () braces.
  -notifier.oauth2.scopes array
     Optional OAuth2 scopes to use for -notifier.url. Scopes must be delimited by ';'. If multiple args are set, then they are applied independently for the corresponding -notifier.url
     Supports an array of values separated by comma or specified via multiple flags.
     Each array item can contain comma inside single-quoted or double-quoted string, {}, [] and () braces.
  -notifier.oauth2.tokenUrl array
     Optional OAuth2 tokenURL to use for -notifier.url. If multiple args are set, then they are applied independently for the corresponding -notifier.url
     Supports an array of values separated by comma or specified via multiple flags.
     Each array item can contain comma inside single-quoted or double-quoted string, {}, [] and () braces.
  -notifier.sendTimeout array
     Timeout when sending alerts to the corresponding -notifier.url (default 10s)
     Supports array of values separated by comma or specified via multiple flags.
     Empty values are set to default value.
  -notifier.showURL
     Whether to avoid stripping sensitive information such as passwords from URL in log messages or UI for -notifier.url. It is hidden by default, since it can contain sensitive info such as auth key
  -notifier.suppressDuplicateTargetErrors
     Whether to suppress 'duplicate target' errors during discovery
  -notifier.tlsCAFile array
     Optional path to TLS CA file to use for verifying connections to -notifier.url. By default, system CA is used
     Supports an array of values separated by comma or specified via multiple flags.
     Each array item can contain comma inside single-quoted or double-quoted string, {}, [] and () braces.
  -notifier.tlsCertFile array
     Optional path to client-side TLS certificate file to use when connecting to -notifier.url
     Supports an array of values separated by comma or specified via multiple flags.
     Each array item can contain comma inside single-quoted or double-quoted string, {}, [] and () braces.
  -notifier.tlsInsecureSkipVerify array
     Whether to skip tls verification when connecting to -notifier.url
     Supports array of values separated by comma or specified via multiple flags.
     Empty values are set to false.
  -notifier.tlsKeyFile array
     Optional path to client-side TLS certificate key to use when connecting to -notifier.url
     Supports an array of values separated by comma or specified via multiple flags.
     Each array item can contain comma inside single-quoted or double-quoted string, {}, [] and () braces.
  -notifier.tlsServerName array
     Optional TLS server name to use for connections to -notifier.url. By default, the server name from -notifier.url is used
     Supports an array of values separated by comma or specified via multiple flags.
     Each array item can contain comma inside single-quoted or double-quoted string, {}, [] and () braces.
  -notifier.url array
     Prometheus Alertmanager URL, e.g. http://127.0.0.1:9093. List all Alertmanager URLs if it runs in the cluster mode to ensure high availability.
     Supports an array of values separated by comma or specified via multiple flags.
     Each array item can contain comma inside single-quoted or double-quoted string, {}, [] and () braces.
  -pprofAuthKey value
     Auth key for /debug/pprof/* endpoints. It must be passed via authKey query arg. It overrides -httpAuth.*
     Flag value can be read from the given file when using -pprofAuthKey=file:///abs/path/to/file or -pprofAuthKey=file://./relative/path/to/file.
     Flag value can be read from the given http/https url when using -pprofAuthKey=http://host/path or -pprofAuthKey=https://host/path
  -promscrape.consul.waitTime duration
     Wait time used by Consul service discovery. Default value is used if not set
  -promscrape.consulSDCheckInterval duration
     Interval for checking for changes in Consul. This works only if consul_sd_configs is configured in '-promscrape.config' file. See https://docs.victoriametrics.com/victoriametrics/sd_configs/#consul_sd_configs for details (default 30s)
  -promscrape.discovery.concurrency int
     The maximum number of concurrent requests to Prometheus autodiscovery API (Consul, Kubernetes, etc.) (default 100)
  -promscrape.discovery.concurrentWaitTime duration
     The maximum duration for waiting to perform API requests if more than -promscrape.discovery.concurrency requests are simultaneously performed (default 1m0s)
  -promscrape.dnsSDCheckInterval duration
     Interval for checking for changes in dns. This works only if dns_sd_configs is configured in '-promscrape.config' file. See https://docs.victoriametrics.com/victoriametrics/sd_configs/#dns_sd_configs for details (default 30s)
  -pushmetrics.disableCompression
     Whether to disable request body compression when pushing metrics to every -pushmetrics.url
  -pushmetrics.extraLabel array
     Optional labels to add to metrics pushed to every -pushmetrics.url . For example, -pushmetrics.extraLabel='instance="foo"' adds instance="foo" label to all the metrics pushed to every -pushmetrics.url
     Supports an array of values separated by comma or specified via multiple flags.
     Each array item can contain comma inside single-quoted or double-quoted string, {}, [] and () braces.
  -pushmetrics.header array
     Optional HTTP request header to send to every -pushmetrics.url . For example, -pushmetrics.header='Authorization: Basic foobar' adds 'Authorization: Basic foobar' header to every request to every -pushmetrics.url
     Supports an array of values separated by comma or specified via multiple flags.
     Each array item can contain comma inside single-quoted or double-quoted string, {}, [] and () braces.
  -pushmetrics.interval duration
     Interval for pushing metrics to every -pushmetrics.url (default 10s)
  -pushmetrics.url array
     Optional URL to push metrics exposed at /metrics page. See https://docs.victoriametrics.com/victoriametrics/single-server-victoriametrics/#push-metrics . By default, metrics exposed at /metrics page aren't pushed to any remote storage
     Supports an array of values separated by comma or specified via multiple flags.
     Each array item can contain comma inside single-quoted or double-quoted string, {}, [] and () braces.
  -reloadAuthKey value
     Auth key for /-/reload http endpoint. It must be passed via authKey query arg. It overrides -httpAuth.*
     Flag value can be read from the given file when using -reloadAuthKey=file:///abs/path/to/file or -reloadAuthKey=file://./relative/path/to/file.
     Flag value can be read from the given http/https url when using -reloadAuthKey=http://host/path or -reloadAuthKey=https://host/path
  -remoteRead.basicAuth.password string
     Optional basic auth password for -remoteRead.url
  -remoteRead.basicAuth.passwordFile string
     Optional path to basic auth password to use for -remoteRead.url
  -remoteRead.basicAuth.username string
     Optional basic auth username for -remoteRead.url
  -remoteRead.basicAuth.usernameFile string
     Optional path to basic auth username to use for -remoteRead.url
  -remoteRead.bearerToken string
     Optional bearer auth token to use for -remoteRead.url.
  -remoteRead.bearerTokenFile string
     Optional path to bearer token file to use for -remoteRead.url.
  -remoteRead.disablePathAppend
     Whether to disable automatic appending of '/api/v1/query' or '/select/logsql/stats_query' path to the configured -datasource.url and -remoteRead.url
  -remoteRead.headers string
     Optional HTTP headers to send with each request to the corresponding -remoteRead.url. For example, -remoteRead.headers='My-Auth:foobar' would send 'My-Auth: foobar' HTTP header with every request to the corresponding -remoteRead.url. Multiple headers must be delimited by '^^': -remoteRead.headers='header1:value1^^header2:value2'
  -remoteRead.idleConnTimeout duration
     Defines a duration for idle (keep-alive connections) to exist. Consider settings this value less to the value of "-http.idleConnTimeout". It must prevent possible "write: broken pipe" and "read: connection reset by peer" errors. (default 50s)
  -remoteRead.lookback duration
     Lookback defines how far to look into past for alerts timeseries. For example, if lookback=1h then range from now() to now()-1h will be scanned. (default 1h0m0s)
  -remoteRead.oauth2.clientID string
     Optional OAuth2 clientID to use for -remoteRead.url.
  -remoteRead.oauth2.clientSecret string
     Optional OAuth2 clientSecret to use for -remoteRead.url.
  -remoteRead.oauth2.clientSecretFile string
     Optional OAuth2 clientSecretFile to use for -remoteRead.url.
  -remoteRead.oauth2.endpointParams string
     Optional OAuth2 endpoint parameters to use for -remoteRead.url . The endpoint parameters must be set in JSON format: {"param1":"value1",...,"paramN":"valueN"}
  -remoteRead.oauth2.scopes string
     Optional OAuth2 scopes to use for -remoteRead.url. Scopes must be delimited by ';'.
  -remoteRead.oauth2.tokenUrl string
     Optional OAuth2 tokenURL to use for -remoteRead.url.
  -remoteRead.showURL
     Whether to show -remoteRead.url in the exported metrics. It is hidden by default, since it can contain sensitive info such as auth key
  -remoteRead.tlsCAFile string
     Optional path to TLS CA file to use for verifying connections to -remoteRead.url. By default, system CA is used
  -remoteRead.tlsCertFile string
     Optional path to client-side TLS certificate file to use when connecting to -remoteRead.url
  -remoteRead.tlsInsecureSkipVerify
     Whether to skip tls verification when connecting to -remoteRead.url
  -remoteRead.tlsKeyFile string
     Optional path to client-side TLS certificate key to use when connecting to -remoteRead.url
  -remoteRead.tlsServerName string
     Optional TLS server name to use for connections to -remoteRead.url. By default, the server name from -remoteRead.url is used
  -remoteRead.url string
     Optional URL to datasource compatible with MetricsQL. It can be single node VictoriaMetrics or vmselect. Remote read is used to restore alerts state. This configuration makes sense only if vmalert was configured with '-remoteWrite.url' before and has been successfully persisted its state. Supports address in the form of IP address with a port (e.g., http://127.0.0.1:8428) or DNS SRV record. See also '-remoteRead.disablePathAppend', '-remoteRead.showURL'.
  -remoteWrite.basicAuth.password string
     Optional basic auth password for -remoteWrite.url
  -remoteWrite.basicAuth.passwordFile string
     Optional path to basic auth password to use for -remoteWrite.url
  -remoteWrite.basicAuth.username string
     Optional basic auth username for -remoteWrite.url
  -remoteWrite.basicAuth.usernameFile string
     Optional path to basic auth username to use for -remoteWrite.url
  -remoteWrite.bearerToken string
     Optional bearer auth token to use for -remoteWrite.url.
  -remoteWrite.bearerTokenFile string
     Optional path to bearer token file to use for -remoteWrite.url.
  -remoteWrite.concurrency int
     Defines number of writers for concurrent writing into remote write endpoint. Default value depends on the number of available CPU cores. (default 2*cgroup.AvailableCPUs())
  -remoteWrite.disablePathAppend
     Whether to disable automatic appending of '/api/v1/write' path to the configured -remoteWrite.url.
  -remoteWrite.flushInterval duration
     Defines interval of flushes to remote write endpoint (default 2s)
  -remoteWrite.headers string
     Optional HTTP headers to send with each request to the corresponding -remoteWrite.url. For example, -remoteWrite.headers='My-Auth:foobar' would send 'My-Auth: foobar' HTTP header with every request to the corresponding -remoteWrite.url. Multiple headers must be delimited by '^^': -remoteWrite.headers='header1:value1^^header2:value2'
  -remoteWrite.idleConnTimeout duration
     Defines a duration for idle (keep-alive connections) to exist. Consider settings this value less to the value of "-http.idleConnTimeout". It must prevent possible "write: broken pipe" and "read: connection reset by peer" errors. (default 50s)
  -remoteWrite.maxBatchSize int
     Defines max number of timeseries to be flushed at once (default 10000)
  -remoteWrite.maxQueueSize int
     Defines the max number of pending datapoints to remote write endpoint (default 100000)
  -remoteWrite.oauth2.clientID string
     Optional OAuth2 clientID to use for -remoteWrite.url
  -remoteWrite.oauth2.clientSecret string
     Optional OAuth2 clientSecret to use for -remoteWrite.url
  -remoteWrite.oauth2.clientSecretFile string
     Optional OAuth2 clientSecretFile to use for -remoteWrite.url
  -remoteWrite.oauth2.endpointParams string
     Optional OAuth2 endpoint parameters to use for -remoteWrite.url . The endpoint parameters must be set in JSON format: {"param1":"value1",...,"paramN":"valueN"}
  -remoteWrite.oauth2.scopes string
     Optional OAuth2 scopes to use for -notifier.url. Scopes must be delimited by ';'.
  -remoteWrite.oauth2.tokenUrl string
     Optional OAuth2 tokenURL to use for -notifier.url.
  -remoteWrite.retryMaxTime duration
     The max time spent on retry attempts for the failed remote-write request. Change this value if it is expected for remoteWrite.url to be unreachable for more than -remoteWrite.retryMaxTime. See also -remoteWrite.retryMinInterval (default 30s)
  -remoteWrite.retryMinInterval duration
     The minimum delay between retry attempts. Every next retry attempt will double the delay to prevent hammering of remote database. See also -remoteWrite.retryMaxTime (default 1s)
  -remoteWrite.sendTimeout duration
     Timeout for sending data to the configured -remoteWrite.url. (default 30s)
  -remoteWrite.showURL
     Whether to show -remoteWrite.url in the exported metrics. It is hidden by default, since it can contain sensitive info such as auth key
  -remoteWrite.tlsCAFile string
     Optional path to TLS CA file to use for verifying connections to -remoteWrite.url. By default, system CA is used
  -remoteWrite.tlsCertFile string
     Optional path to client-side TLS certificate file to use when connecting to -remoteWrite.url
  -remoteWrite.tlsInsecureSkipVerify
     Whether to skip tls verification when connecting to -remoteWrite.url
  -remoteWrite.tlsKeyFile string
     Optional path to client-side TLS certificate key to use when connecting to -remoteWrite.url
  -remoteWrite.tlsServerName string
     Optional TLS server name to use for connections to -remoteWrite.url. By default, the server name from -remoteWrite.url is used
  -remoteWrite.url string
     Optional URL to persist alerts state and recording rules results in form of timeseries. It must support either VictoriaMetrics remote write protocol or Prometheus remote_write protocol. Supports address in the form of IP address with a port (e.g., http://127.0.0.1:8428) or DNS SRV record. For example, if -remoteWrite.url=http://127.0.0.1:8428 is specified, then the alerts state will be written to http://127.0.0.1:8428/api/v1/write . See also -remoteWrite.disablePathAppend, '-remoteWrite.showURL'.
  -replay.disableProgressBar
     Whether to disable rendering progress bars during the replay. Progress bar rendering might be verbose or break the logs parsing, so it is recommended to be disabled when not used in interactive mode.
  -replay.maxDatapointsPerQuery int
     Max number of data points expected in one request. It affects the max time range for every '/query_range' request during the replay. The higher the value, the less requests will be made during replay. (default 1000)
  -replay.ruleEvaluationConcurrency int
     The maximum number of concurrent '/query_range' requests when replay recording rule or alerting rule with for=0. Increasing this value when replaying for a long time, since each request is limited by -replay.maxDatapointsPerQuery. (default 1)
  -replay.ruleRetryAttempts int
     Defines how many retries to make before giving up on rule if request for it returns an error. (default 5)
  -replay.rulesDelay duration
     Delay before evaluating the next rule within the group. Is important for chained rules. Keep it equal or bigger than -remoteWrite.flushInterval. When set to >0, replay ignores group's concurrency setting. (default 1s)
  -replay.timeFrom string
     The time filter in RFC3339 format to start the replay from. E.g. '2020-01-01T20:07:00Z'
  -replay.timeTo string
     The time filter in RFC3339 format to finish the replay by. E.g. '2020-01-01T20:07:00Z'. By default, is set to the current time.
  -rule array
     Path to the files or http url with alerting and/or recording rules in YAML format.
     Supports hierarchical patterns and regexpes.
     Examples:
      -rule="/path/to/file". Path to a single file with alerting rules.
      -rule="http://<some-server-addr>/path/to/rules". HTTP URL to a page with alerting rules.
      -rule="dir/*.yaml" -rule="/*.yaml" -rule="gcs://vmalert-rules/tenant_%{TENANT_ID}/prod".
      -rule="dir/**/*.yaml". Includes all the .yaml files in "dir" subfolders recursively.
     Rule files support YAML multi-document. Files may contain %{ENV_VAR} placeholders, which are substituted by the corresponding env vars.

     Enterprise version of vmalert supports S3 and GCS paths to rules.
     For example: gs://bucket/path/to/rules, s3://bucket/path/to/rules
     S3 and GCS paths support only matching by prefix, e.g. s3://bucket/dir/rule_ matches
     all files with prefix rule_ in folder dir.
     See https://docs.victoriametrics.com/victoriametrics/vmalert/#reading-rules-from-object-storage

     Supports an array of values separated by comma or specified via multiple flags.
     Each array item can contain comma inside single-quoted or double-quoted string, {}, [] and () braces.
  -rule.defaultRuleType string
     Default type for rule expressions, can be overridden via "type" parameter on the group level, see https://docs.victoriametrics.com/victoriametrics/vmalert/#groups. Supported values: "graphite", "prometheus" and "vlogs". (default "prometheus")
  -rule.evalDelay duration
     Adjustment of the 'time' parameter for rule evaluation requests to compensate intentional data delay from the datasource. Normally, should be equal to '-search.latencyOffset' (cmd-line flag configured for VictoriaMetrics single-node or vmselect). This doesn't apply to groups with eval_offset specified. (default 30s)
  -rule.maxResolveDuration duration
     Limits the maximum duration for automatic alert expiration, which by default is 4 times evaluationInterval of the parent group
  -rule.resendDelay duration
     Minimum amount of time to wait before resending an alert to notifier.
  -rule.resultsLimit int
     Limits the number of alerts or recording results a single rule can produce. Can be overridden by the limit option under group if specified. If exceeded, the rule will be marked with an error and all its results will be discarded. 0 means no limit.
  -rule.stripFilePath
     Whether to strip rule file paths in logs and all API responses, including /metrics. For example, file path '/path/to/tenant_id/rules.yml' will be stripped to 'groupHashID/rules.yml'. This flag may be useful for hiding sensitive information in file paths, such as S3 bucket details.
  -rule.templates array
     Path or glob pattern to location with go template definitions for rules annotations templating. Flag can be specified multiple times.
     Examples:
      -rule.templates="/path/to/file". Path to a single file with go templates
      -rule.templates="dir/*.tpl" -rule.templates="/*.tpl". Relative path to all .tpl files in "dir" folder,
     absolute path to all .tpl files in root.
      -rule.templates="dir/**/*.tpl". Includes all the .tpl files in "dir" subfolders recursively.

     Supports an array of values separated by comma or specified via multiple flags.
     Each array item can contain comma inside single-quoted or double-quoted string, {}, [] and () braces.
  -rule.updateEntriesLimit int
     Defines the max number of rule's state updates stored in-memory. Rule's updates are available on rule's Details page and are used for debugging purposes. The number of stored updates can be overridden per rule via update_entries_limit param. (default 20)
  -rule.validateExpressions
     Whether to validate rules expressions for different types. (default true)
  -rule.validateTemplates
     Whether to validate annotation and label templates (default true)
  -secret.flags array
     Comma-separated list of flag names with secret values. Values for these flags are hidden in logs and on /metrics page
     Supports an array of values separated by comma or specified via multiple flags.
     Each array item can contain comma inside single-quoted or double-quoted string, {}, [] and () braces.
  -tls array
     Whether to enable TLS for incoming HTTP requests at the given -httpListenAddr (aka https). -tlsCertFile and -tlsKeyFile must be set if -tls is set. See also -mtls
     Supports array of values separated by comma or specified via multiple flags.
     Empty values are set to false.
  -tlsCertFile array
     Path to file with TLS certificate for the corresponding -httpListenAddr if -tls is set. Prefer ECDSA certs instead of RSA certs as RSA certs are slower. The provided certificate file is automatically re-read every second, so it can be dynamically updated. See also -tlsAutocertHosts
     Supports an array of values separated by comma or specified via multiple flags.
     Each array item can contain comma inside single-quoted or double-quoted string, {}, [] and () braces.
  -tlsCipherSuites array
     Optional list of TLS cipher suites for incoming requests over HTTPS if -tls is set. See the list of supported cipher suites at https://pkg.go.dev/crypto/tls#pkg-constants
     Supports an array of values separated by comma or specified via multiple flags.
     Each array item can contain comma inside single-quoted or double-quoted string, {}, [] and () braces.
  -tlsKeyFile array
     Path to file with TLS key for the corresponding -httpListenAddr if -tls is set. The provided key file is automatically re-read every second, so it can be dynamically updated. See also -tlsAutocertHosts
     Supports an array of values separated by comma or specified via multiple flags.
     Each array item can contain comma inside single-quoted or double-quoted string, {}, [] and () braces.
  -tlsMinVersion array
     Optional minimum TLS version to use for the corresponding -httpListenAddr if -tls is set. Supported values: TLS10, TLS11, TLS12, TLS13
     Supports an array of values separated by comma or specified via multiple flags.
     Each array item can contain comma inside single-quoted or double-quoted string, {}, [] and () braces.
  -version
     Show VictoriaMetrics version
Enterprise flags #
These flags are available only in VictoriaMetrics enterprise .
        -clusterMode
     If clusterMode is enabled, then vmalert automatically adds the tenant specified in config groups to -datasource.url, -remoteWrite.url and -remoteRead.url. See https://docs.victoriametrics.com/victoriametrics/vmalert/#multitenancy . This flag is available only in Enterprise binaries. See https://docs.victoriametrics.com/victoriametrics/enterprise/
  -defaultTenant.graphite string
     Default tenant for Graphite alerting groups. See https://docs.victoriametrics.com/victoriametrics/vmalert/#multitenancy .This flag is available only in Enterprise binaries. See https://docs.victoriametrics.com/victoriametrics/enterprise/
  -defaultTenant.prometheus string
     Default tenant for Prometheus alerting groups. See https://docs.victoriametrics.com/victoriametrics/vmalert/#multitenancy . This flag is available only in Enterprise binaries. See https://docs.victoriametrics.com/victoriametrics/enterprise/
  -eula
     Deprecated, please use -license or -licenseFile flags instead. By specifying this flag, you confirm that you have an enterprise license and accept the ESA https://victoriametrics.com/legal/esa/ . This flag is available only in Enterprise binaries. See https://docs.victoriametrics.com/victoriametrics/enterprise/
  -license string
     License key for VictoriaMetrics Enterprise. See https://victoriametrics.com/products/enterprise/ . Trial Enterprise license can be obtained from https://victoriametrics.com/products/enterprise/trial/ . This flag is available only in Enterprise binaries. The license key can be also passed via file specified by -licenseFile command-line flag
  -license.forceOffline
     Whether to enable offline verification for VictoriaMetrics Enterprise license key, which has been passed either via -license or via -licenseFile command-line flag. The issued license key must support offline verification feature. Contact info@victoriametrics.com if you need offline license verification. This flag is available only in Enterprise binaries
  -licenseFile string
     Path to file with license key for VictoriaMetrics Enterprise. See https://victoriametrics.com/products/enterprise/ . Trial Enterprise license can be obtained from https://victoriametrics.com/products/enterprise/trial/ . This flag is available only in Enterprise binaries. The license key can be also passed inline via -license command-line flag
  -licenseFile.reloadInterval duration
     Interval for reloading the license file specified via -licenseFile. A non-positive value disables periodic and SIGHUP-triggered reloads of -licenseFile. See https://victoriametrics.com/products/enterprise/ . This flag is available only in Enterprise binaries (default 1h0m0s)
  -mtls array
     Whether to require valid client certificate for https requests to the corresponding -httpListenAddr . This flag works only if -tls flag is set. See also -mtlsCAFile . This flag is available only in Enterprise binaries. See https://docs.victoriametrics.com/victoriametrics/enterprise/
     Supports array of values separated by comma or specified via multiple flags.
     Empty values are set to false.
  -mtlsCAFile array
     Optional path to TLS Root CA for verifying client certificates at the corresponding -httpListenAddr when -mtls is enabled. By default the host system TLS Root CA is used for client certificate verification. This flag is available only in Enterprise binaries. See https://docs.victoriametrics.com/victoriametrics/enterprise/
     Supports an array of values separated by comma or specified via multiple flags.
     Each array item can contain comma inside single-quoted or double-quoted string, {}, [] and () braces.
  -s3.configFilePath string
     Path to file with S3 configs. Configs are loaded from default location if not set.
     See https://docs.aws.amazon.com/general/latest/gr/aws-security-credentials.html . This flag is available only in Enterprise binaries. See https://docs.victoriametrics.com/victoriametrics/enterprise/
  -s3.configProfile string
     Profile name for S3 configs. If no set, the value of the environment variable will be loaded (AWS_PROFILE or AWS_DEFAULT_PROFILE), or if both not set, DefaultSharedConfigProfile is used. This flag is available only in Enterprise binaries. See https://docs.victoriametrics.com/victoriametrics/enterprise/
  -s3.credsFilePath string
     Path to file with GCS or S3 credentials. Credentials are loaded from default locations if not set.
     See https://cloud.google.com/iam/docs/creating-managing-service-account-keys and https://docs.aws.amazon.com/general/latest/gr/aws-security-credentials.html . This flag is available only in Enterprise binaries. See https://docs.victoriametrics.com/victoriametrics/enterprise/
  -s3.customEndpoint string
     Custom S3 endpoint for use with S3-compatible storages (e.g. MinIO). S3 is used if not set. This flag is available only in Enterprise binaries. See https://docs.victoriametrics.com/victoriametrics/enterprise/
  -s3.forcePathStyle
     Prefixing endpoint with bucket name when set false, true by default. This flag is available only in Enterprise binaries. See https://docs.victoriametrics.com/victoriametrics/enterprise/ (default true)
  -tlsAutocertCacheDir string
     Directory to store TLS certificates issued via Let's Encrypt. Certificates are lost on restarts if this flag isn't set. This flag is available only in Enterprise binaries. See https://docs.victoriametrics.com/victoriametrics/enterprise/
  -tlsAutocertEmail string
     Contact email for the issued Let's Encrypt TLS certificates. See also -tlsAutocertHosts and -tlsAutocertCacheDir . This flag is available only in Enterprise binaries. See https://docs.victoriametrics.com/victoriametrics/enterprise/
  -tlsAutocertHosts array
     Optional hostnames for automatic issuing of Let's Encrypt TLS certificates. These hostnames must be reachable at -httpListenAddr . The -httpListenAddr must listen tcp port 443 . The -tlsCertFile and -tlsKeyFile must be unset when -tlsAutocertHosts is used . See also -tlsAutocertEmail and -tlsAutocertCacheDir . This flag is available only in Enterprise binaries. See https://docs.victoriametrics.com/victoriametrics/enterprise/
     Supports an array of values separated by comma or specified via multiple flags.
     Each array item can contain comma inside single-quoted or double-quoted string, {}, [] and () braces.
Hot config reload #
vmalert supports “hot” config reload via the following methods:
- send SIGHUP signal to
vmalertprocess; - send GET request to
/-/reloadendpoint (this endpoint can be protected with-reloadAuthKeycommand-line flag); - configure
-configCheckIntervalflag for periodic reload on config change.
On config reload, vmalert re-reads configurations specified via -rule, -rule.templates and -notifier.config cmd-line
flags.
If configuration has changed, vmalert will update its internal states accordingly, log the corresponding message,
set vmalert_config_last_reload_successful to 1 and vmalert_config_last_reload_success_timestamp_seconds to the moment
when the update happened. If configuration hasn’t changed, vmalert won’t do anything.
If vmalert failed to load or parse the configuration, it will log a corresponding error message and set
vmalert_config_last_reload_successful to 0. It will keep the previous config and will continue operating as before.
URL params #
To set additional URL params for datasource.url, remoteWrite.url or remoteRead.url
just add them in address: -datasource.url=http://localhost:8428?nocache=1.
To set additional URL params for specific
group of rules
modify
the params group:
      groups:
  - name: TestGroup
    params:
      denyPartialResponse: ["true"]
      extra_label: ["env=dev"]
Please note, params are used only for executing rules expressions (requests to datasource.url).
If there would be a conflict between URL params set in datasource.url flag and params in group definition
the latter will have higher priority.
Chaining groups #
For chaining groups, they must be executed in a specific order, and the next group should be executed after
the results from previous group are available in the datasource.
In vmalert, user can specify eval_offset to achieve that
Available from v1.113.0
.
For example:
      groups:
  - name: BaseGroup
    interval: 5m
    eval_offset: 1m
    rules:
      - record: http_server_request_duration_seconds:sum_rate:5m:http_get
        expr: |
          sum without(instance, pod) (
            rate(
              http_server_request_duration_seconds{
                http_request_method="GET"
              }[5m]
            )
          )
      - record: http_server_request_duration_seconds:sum_rate:5m:http_post
        expr: |
          sum without(instance, pod) (
            rate(
              http_server_request_duration_seconds{
                http_request_method="POST"
              }[5m]
            )
          )
  - name: TopGroup
    interval: 5m
    eval_offset: 3m
    rules:
      - record: http_server_request_duration_seconds:sum_rate:5m:merged
        expr: |
          http_server_request_duration_seconds:sum_rate:5m:http_get
          or
          http_server_request_duration_seconds:sum_rate:5m:http_post
This configuration ensures that rules in BaseGroup are executed at(assuming vmalert starts at 12:00:00):
[12:01:00, 12:06:00, 12:11:00, 12:16:00...]
while rules in group TopGroup are executed at:
[12:03:00, 12:08:00, 12:13:00, 12:18:00...]
As a result, TopGroup can consistently obtain the latest results from BaseGroup if BaseGroup completes its evaluation and uploads its results to the datasource within 2 minutes.
By default, the eval_offset values should be at least 30 seconds apart to accommodate the
-search.latencyOffset(default 30s) command-line flag at vmselect or VictoriaMetrics single-node.
The minimum eval_offset gap should be adjusted according to the sum of the execution duration of BaseGroup and -search.latencyOffset.
Notifier configuration file #
Notifier also supports configuration via file specified with flag notifier.config:
      ./bin/vmalert -rule=app/vmalert/config/testdata/rules.good.rules \
  -datasource.url=http://localhost:8428 \
  -notifier.config=app/vmalert/notifier/testdata/consul.good.yaml
The configuration file allows to configure static notifiers, discover notifiers via Consul and DNS : For example:
      static_configs:
  - targets:
      # support using full url
      - 'http://alertmanager:9093/test/api/v2/alerts'
      - 'https://alertmanager:9093/api/v2/alerts'
      # the following target with only host:port will be used as <scheme>://localhost:9093/<path_prefix>/api/v2/alerts
      - localhost:9093

consul_sd_configs:
  - server: localhost:8500
    services:
      - alertmanager

dns_sd_configs:
  - names:
      - my.domain.com
    type: 'A'
    port: 9093
The list of configured or discovered Notifiers can be explored via UI . If Alertmanager runs in cluster mode then all its URLs needs to be available during discovery to ensure high availability .
The configuration file specification is the following:
      # Per-target Notifier timeout when pushing alerts.
[ timeout: <duration> | default = 10s ]

# Prefix for the HTTP path alerts are pushed to.
[ path_prefix: <path> | default = / ]

# Configures the protocol scheme used for requests.
[ scheme: <scheme> | default = http ]

# Sets the `Authorization` header on every request with the
# configured username and password.
# password and password_file are mutually exclusive.
basic_auth:
  [ username: <string> ]
  [ password: <string> ]
  [ password_file: <string> ]

# Optional `Authorization` header configuration.
authorization:
  # Sets the authentication type.
  [ type: <string> | default: Bearer ]
  # Sets the credentials. It is mutually exclusive with
  # `credentials_file`.
  [ credentials: <secret> ]
  # Sets the credentials to the credentials read from the configured file.
  # It is mutually exclusive with `credentials`.
  [ credentials_file: <filename> ]

# Configures the scrape request's TLS settings.
# see https://prometheus.io/docs/prometheus/latest/configuration/configuration/#tls_config
tls_config:
  [ <tls_config> ]

# Configures Bearer authentication token via string
bearer_token: <string>
# or by passing path to the file with token.
bearer_token_file: <string>

# Configures OAuth 2.0 authentication
# see https://prometheus.io/docs/prometheus/latest/configuration/configuration/#oauth2
oauth2:
  [ <oauth2_config> ]

# Optional list of HTTP headers in form `header-name: value`
# applied for all requests to notifiers
# For example:
#  headers:
#    - "CustomHeader: foo"
#    - "CustomHeader2: bar"
headers:
  [ <string>, ...]

# List of labeled statically configured Notifiers.
#
# Each list of targets may be additionally instructed with
# authorization params. Target's authorization params will
# inherit params from global authorization params if there
# are no conflicts.
static_configs:
  [ - targets: ]
      [ - '<host>' ]
      [ oauth2 ]
      [ basic_auth ]
      [ authorization ]
      [ tls_config ]
      [ bearer_token ]
      [ bearer_token_file ]
      [ headers ]
      # Relabel configurations for static notifiers.
      # If used with the external `alert_relabel_configs`, the external configs are applied first.
      alert_relabel_configs:
        [ - <relabel_config> ... ]

# List of Consul service discovery configurations.
consul_sd_configs:
  # See https://prometheus.io/docs/prometheus/latest/configuration/configuration/#consul_sd_config
  [ - <consul_sd_config> ]
  # Relabel configurations for Consul SD notifiers.
  # If used with the external `alert_relabel_configs`, the external configs are applied first.
  alert_relabel_configs:
    [ - <relabel_config> ... ]

# List of DNS service discovery configurations.
dns_sd_configs:
  # See https://prometheus.io/docs/prometheus/latest/configuration/configuration/#dns_sd_config
  [ - <dns_sd_config> ]
  # Relabel configurations for DNS SD notifiers.
  # If used with the external `alert_relabel_configs`, the external configs are applied first.
  alert_relabel_configs:
    [ - <relabel_config> ... ]

# List of relabel configurations for entities discovered via service discovery.
# Supports the same relabeling features as the rest of VictoriaMetrics components.
# See https://docs.victoriametrics.com/victoriametrics/relabeling/
relabel_configs:
  [ - <relabel_config> ... ]

# List of relabel configurations for alert labels sent via Notifier.
# Supports the same relabeling features as the rest of VictoriaMetrics components.
# See https://docs.victoriametrics.com/victoriametrics/relabeling/
alert_relabel_configs:
  [ - <relabel_config> ... ]
The configuration file can be hot-reloaded .
Contributing #
vmalert is mostly designed and built by VictoriaMetrics community.
Feel free to share your experience and ideas for improving this
software. Please keep simplicity as the main priority.
How to build from sources #
It is recommended using binary releases
vmalertis located invmutils-*archives there.
Docker image #
You can build vmalert docker image from source and push it to your own docker repository.
Run the following commands from the root folder of the repository
:
      make package-vmalert
docker tag victoria-metrics/vmalert:version my-repo:my-version-name
docker push my-repo:my-version-name
To run the built image in victoria-metrics-k8s-stack or VMAlert CR object apply the following config change:
      kind: VMAlert
spec:
  image:
    repository: my-repo
    tag: my-version-name
Development build #
- Install Go .
- Run
make vmalertfrom the root folder of the repository . It buildsvmalertbinary and puts it into thebinfolder.
Production build #
- Install docker .
- Run
make vmalert-prodfrom the root folder of the repository . It buildsvmalert-prodbinary and puts it into thebinfolder.
ARM build #
ARM build may run on Raspberry Pi or on energy-efficient ARM servers .
Development ARM build #
- Install Go .
- Run
make vmalert-linux-armormake vmalert-linux-arm64from the root folder of the repository . It buildsvmalert-linux-armorvmalert-linux-arm64binary respectively and puts it into thebinfolder.
Production ARM build #
- Install docker .
- Run
make vmalert-linux-arm-prodormake vmalert-linux-arm64-prodfrom the root folder of the repository . It buildsvmalert-linux-arm-prodorvmalert-linux-arm64-prodbinary respectively and puts it into thebinfolder.