In today’s fast-paced and complex landscape of system monitoring, VictoriaMetrics Anomaly Detection
(vmanomaly), a part of our Enterprise offering
, serves as an observability layer for SREs and DevOps teams atop of collected data to automate the detection of anomalies in time-series data, reducing manual efforts required to identify abnormal system behavior.
Unlike traditional threshold-based alerting, which relies on raw metric values and requires constant tuning and maintenance of thresholds and alerting rules, vmanomaly introduces a unified, interpretable
anomaly score
- a de-trended, de-seasonalized metric generated through machine learning. This approach eliminates the need for frequent manual adjustments by enabling stable, long-term static thresholds (as simple as anomaly_score > 1) that remain effective over time through continuous model retraining and updates.
By shifting to anomaly-based detection, teams can identify and respond to potential issues faster, enhancing system reliability and operational efficiency while significantly reducing the engineering effort spent on handcrafting and maintaining alerting rules.
What does it do? #
vmanomaly is designed to periodically analyze new data points across selected metrics - either requested from
VictoriaMetrics TSDB
or produced by
VictoriaLogs
or
VictoriaTraces
metrics
endpoint
- to generate a unified metric called
anomaly score
.
vmanomaly can use both single-node and cluster versions of VictoriaMetrics/VictoriaLogs/VictoriaTraces as a data source, and is compatible with both OpenSource and Enterprise versions of it. However, vmanomaly itself requires an Enterprise license to run, and is part of our Enterprise offering
.
Key functions:
- Automated anomaly detection - continuously scans time-series data to identify deviations from expected behavior.
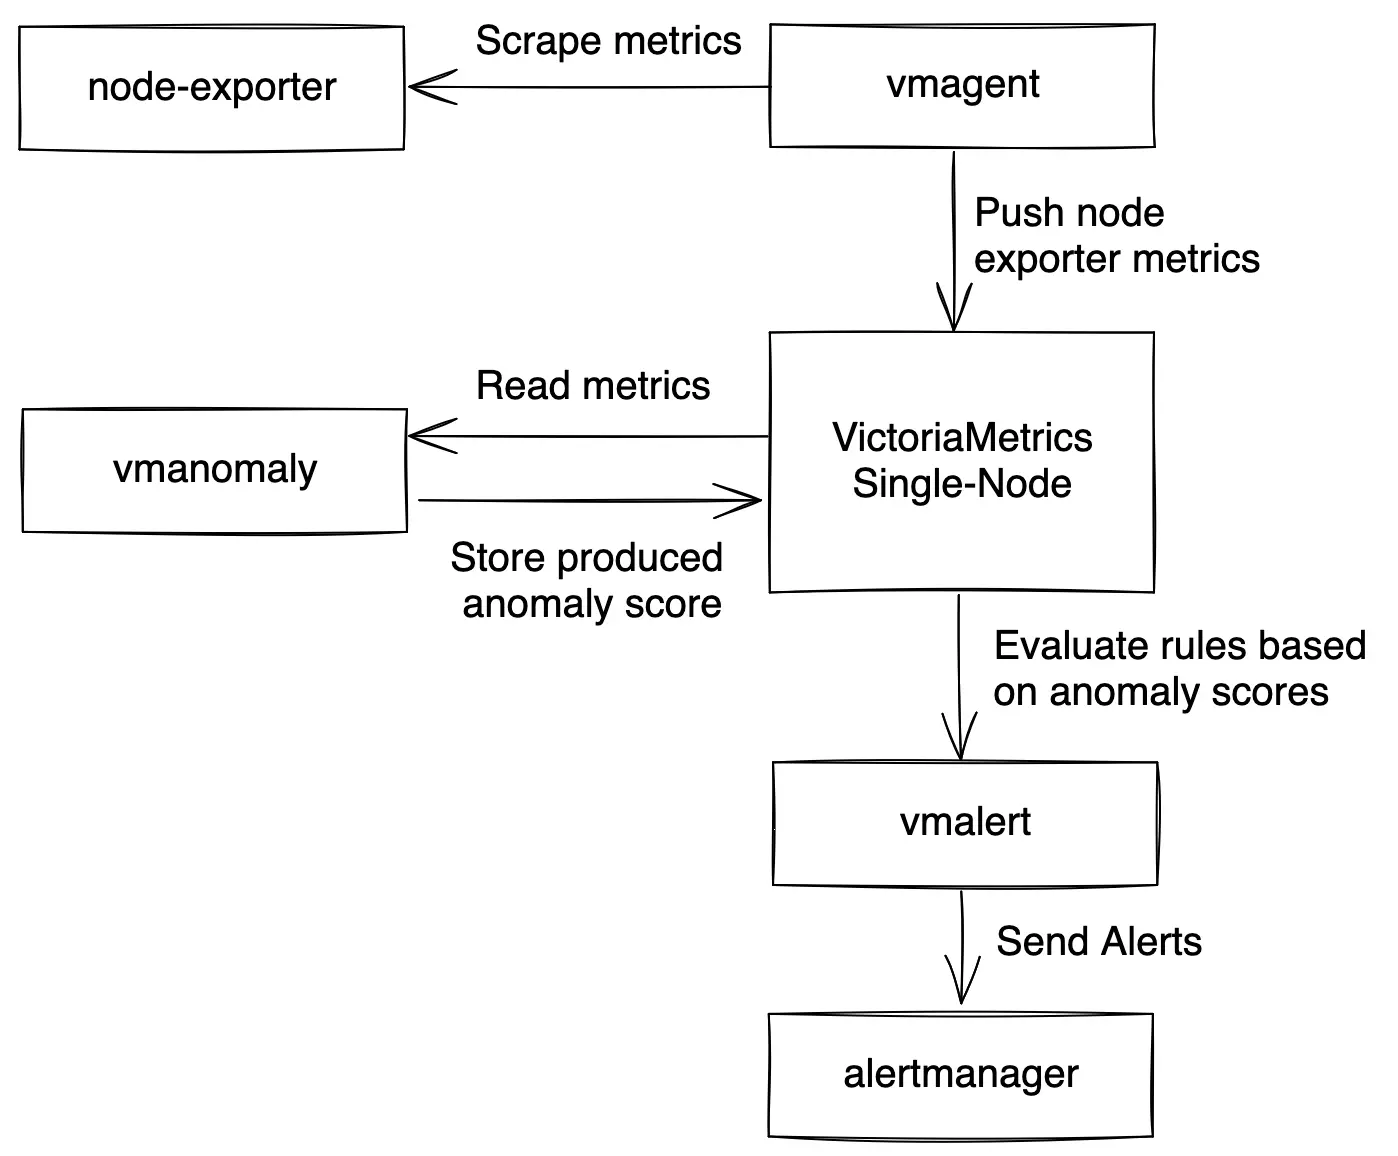
- Seamless integration - anomaly scores are stored in VictoriaMetrics TSDB for use in alerting, visualization, and downstream analytics.
The diagram below illustrates how vmanomaly fits into an observability setup, such as detecting anomalies in metrics collected by node_exporter:
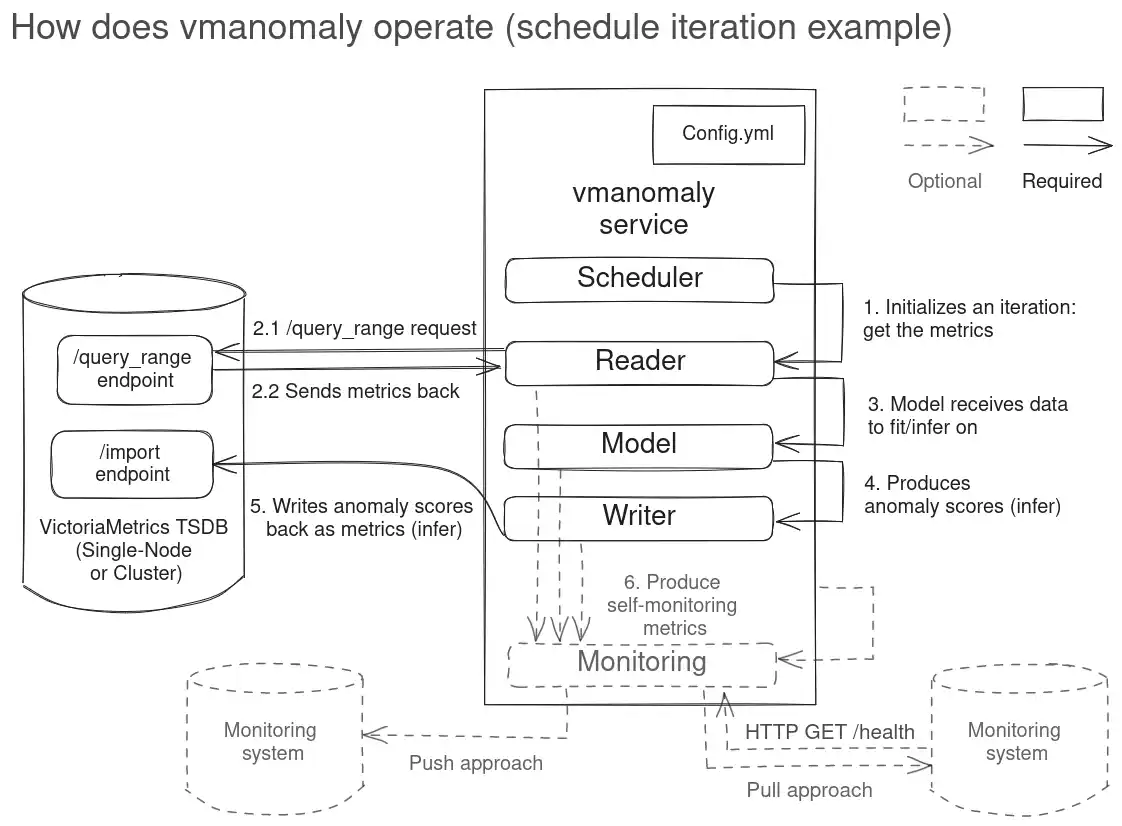
How does it work? #
VictoriaMetrics Anomaly Detection continuously re-fit and apply machine learning models - either
built-in
or
custom
, specific to your business needs — on your
input
data. This ensures that the default cut-off threshold (anomaly score == 1), which differentiates normal (≤ 1) from anomalous (> 1) data points, remains relevant over time.
- Automated anomaly scoring - ML models calculate anomaly scores for new data points based on a predefined schedule .
- Simplified alerting - alerts can be triggered using straightforward thresholds (e.g.,
anomaly_score > 1), reducing complexity in observability setups. - Additional model outputs - beyond anomaly scores, models provide
supplementary outputs
, including:
- Point estimates (
yhat) - Confidence intervals (
[yhat_lower, yhat_upper])
These outputs integrate seamlessly into downstream applications, making it easier to visually inspect anomalies, e.g. in respective Grafana dashboards .
- Point estimates (
Key benefits #
vmanomaly is designed to reduce MTTR (Mean Time to Resolution) in observability workflows by automating anomaly detection and eliminating the need for manual threshold tuning. It is particularly beneficial for:
Reducing alerting rule maintenance – shifts from manually maintaining static thresholds on raw metric values to a stable anomaly score threshold that remains reliable and interpretable over time.
Handling complex metrics – effectively detects anomalies in trending, seasonal, or dynamically scaling data, where fixed thresholds and simpler models usually fail.
Detecting anomalies in interconnected metrics – supports multivariate anomaly detection , identifying patterns across related metrics instead of treating them in isolation as univariate metrics .
Practical guides and installation #
Get started with VictoriaMetrics Anomaly Detection by following our guides and installation options:
Quickstart: Learn how to quickly set up
vmanomalyby following the Quickstart Guide .UI: Explore anomaly detection configurations through the vmanomaly UI .
MCP: Allow AI to assist you in generating service and alerting configurations, answering questions, planning migration with the MCP Server . Find the setup guide how to setup and use it here .
Integration: Integrate anomaly detection into your existing observability stack. Find detailed steps here .
Anomaly Detection Presets: Enable anomaly detection on predefined sets of metrics. Learn more here .
Installation Options: Choose the installation method that best fits your infrastructure:
- Docker Installation: Ideal for containerized environments. Follow the Docker Installation Guide .
- Helm Chart Installation: Recommended for Kubernetes deployments. See our Helm charts .
- Kubernetes Custom Resource: If you are using
VM Operator
, deploy
vmanomalyusing the custom resource guide .
High Availability: See how to enable horizontal scalability and high availability for
vmanomalyservice hereSelf-Monitoring: Ensure
vmanomalyis functioning optimally, using provided Grafana dashboards and alerting rules to track service health and operational metrics. Find the guide here .Migration: For information on migrating between different versions of
vmanomaly, please refer to the Migration section for compatibility considerations and steps for a smooth transition.
Starting from
v1.5.0
vmanomaly requires a
license key
to run. You can obtain a trial license key here
.
Key Components #
Explore the integral components that define VictoriaMetrics Anomaly Detection:
Deep Dive into Anomaly Detection #
Enhance your knowledge with our handbook on Anomaly Detection & Root Cause Analysis and stay updated:
- Anomaly Detection Handbook
- Follow the
#anomaly-detectiontag in our blog
Product Updates #
Stay up-to-date with the latest improvements and features in VictoriaMetrics Anomaly Detection, and the rest of our products on our blog .
Frequently Asked Questions (FAQ) #
Got questions about VictoriaMetrics Anomaly Detection? Chances are, we’ve got the answers ready for you.
Dive into our FAQ section to find responses to common questions.
Get in Touch #
We are eager to connect with you and adapt our solutions to your specific needs. Here’s how you can engage with us:
- Book a Demo to discover what our product can do.
- Interested in exploring our Enterprise features , including Anomaly Detection ? Request your trial license today and take the first step towards advanced system observability.
Our CHANGELOG is just a click away , keeping you informed about the latest updates and enhancements.